
Foundation June 2022 Paper 2 Q16
16 60 people were asked if they would vote in an election.
- \(\dfrac{1}{4}\) of the people said No
- 20 people said Yes
- The rest said Maybe
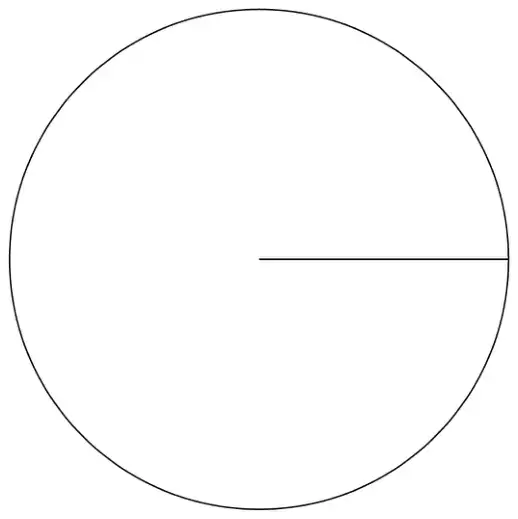
Draw and label a pie chart to show this information. [3 marks]
| Answer | Mark | Comments |
|---|---|---|
| 90 seen or [88°, 92°] drawn on pie chart | M1 | allow missing or incorrect label |
| \(\dfrac{20}{60} \times 360\) or 120 seen or [118°, 122°] drawn on pie chart | M1 | oe eg \(360 \div 3\) allow missing or incorrect label |
| Fully correct pie chart with unambiguous labels and all angles ±2° | A1 |
Additional guidance
All three labels (or a key) needed for the A1 but accept eg No, Yes, Rest or N, Y, M or N, Y, R
eg for No do not accept 15 (people) or \(\dfrac{1}{4}\) or 90 as the label
Not using the given radius will score a maximum of M2