
Higher June 2025 Paper 3 Q5
5 The pie chart represents the results of matches played by a team.
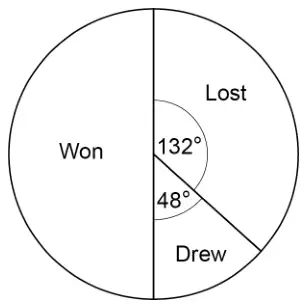
30 matches were won.
How many matches were lost? [3 marks]
| Answer | Mark | Comments |
|---|---|---|
| Alternative method 1: proportion using angles | ||
| \(\dfrac{132}{180}\) or \([0.73, 0.7\dot{3}]\) or \(\dfrac{132}{360}\) or [0.36, 0.37] or \(\dfrac{48}{180}\) or [0.26, 0.27] or \(\dfrac{48}{360}\) or \([0.13, 0.1\dot{3}]\) or 132 : 48 or 11 : 4 | M1 | oe fraction or percentage ratio: oe either order |
| or \(\dfrac{132}{180} \times 30\) or \(\dfrac{48}{180} \times 30\) or 8 or 22 : 8 or 8 : 22 (not oe) | M1dep | oe eg \([0.73, 0.7\dot{3}] \times 30\) \(\dfrac{132}{360} \times 30 \times 2\) or \(\dfrac{48}{360} \times 30 \times 2\) is M2 |
| 22 | A1 | SC1 11 |
| Alternative method 2: using the number of degrees per match | ||
| \((360 - 132 - 48) \div 30\) or \(180 \div 30\) or \(360 \div (30 \times 2)\) or 6 | M1 | oe |
| \(132 \div\) their 6 or \(48 \div\) their 6 or 8 | M1dep | oe \(\dfrac{132}{360 \div (30 \times 2)}\) or \(\dfrac{48}{360 \div (30 \times 2)}\) is M2 |
| 22 | A1 | SC1 11 |
| Alternative method 3: using the number of matches per degree | ||
| \(\dfrac{30}{180}\) or \(\dfrac{30 \times 2}{360}\) or [0.16, 0.17] | M1 | oe fraction or percentage eg \(\dfrac{1}{6}\) |
| or \(\dfrac{30}{180} \times 132\) or \(\dfrac{30}{180} \times 48\) or 8 | M1dep | oe eg \([0.16, 0.17] \times 132\) |
| 22 | A1 | SC1 11 |
Additional guidance
| SC1 is for using 30 matches in total | |
| \(0.17 \times 132 = 22.44\) with answer 22 | M1M1A0 |
| \(30 \div 2 = 15\) and \(15 \div 2 = 7.5\) and \(15 + 7.5 = 22.5\) with answer 22 | M1M1A1 |
| \(30 \div 2 = 15\) and \(15 \div 2 = 7.5\) and \(15 + 7.5 = 22.5\) | M0 |
| \(30 \div 2 = 15\) and \(15 \div 2 = 7.5\) and \(7.5 \to 8\) | M1M1 |
| \(360 \div 30 = 12\) | M0 |