
Foundation June 2025 Paper 1 Q5
5 The pie chart shows the proportion of games won by a sports team.
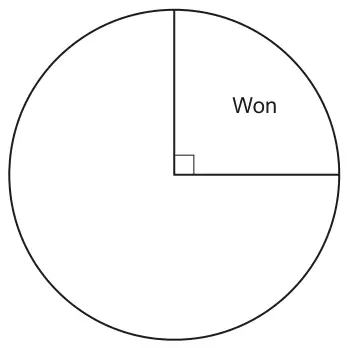
(a) The sports team won 9 games.
Work out how many games the sports team played. [2]
(b) The ratio of the number of games drawn by the sports team to the number of games lost by the sports team was 2 : 1.
Complete the pie chart above. [2]
| Answer | Marks | Part marks and guidance | |
|---|---|---|---|
| 36 | 2 | M1 for \(9 \times 4\) or \(9 + 9 + 9 + 9\) or \(360 \div \left(\dfrac{90}{9}\right)\) | |
| Answer | Marks | Part marks and guidance | |
|---|---|---|---|
| Correct, labelled, 3 sector pie chart | 2 | M1 for 180 and 90 or for \(\dfrac{1}{2}\) and \(\dfrac{1}{4}\) or 18 and 9 maybe implied by correct 3 sector pie chart with wrong or missing labels or 4 quadrant pie chart with 2 quadrants labelled draw and 1 quadrant labelled lost | Tolerance \(\pm 2^\circ\) by eye, accept good freehand |