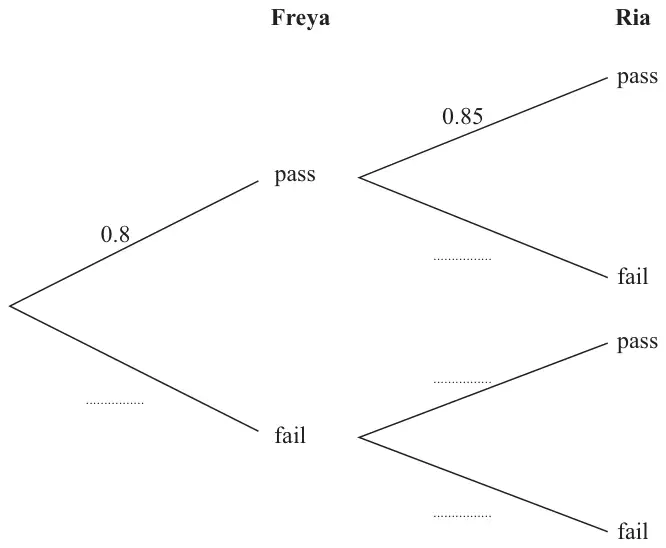
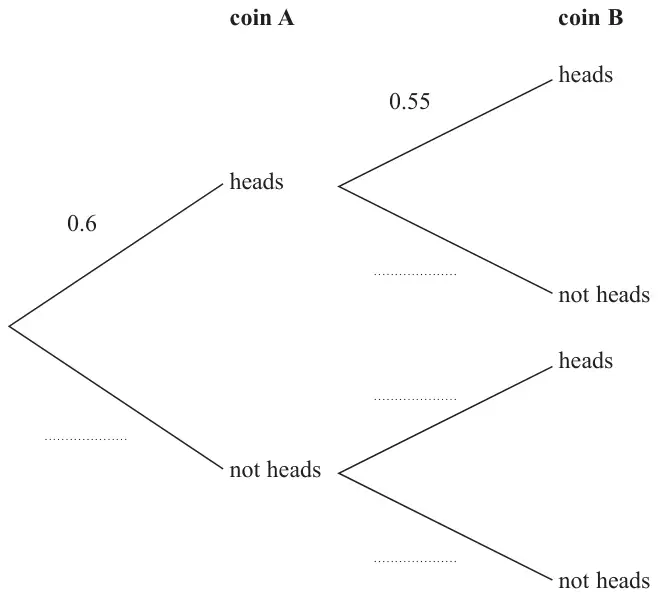
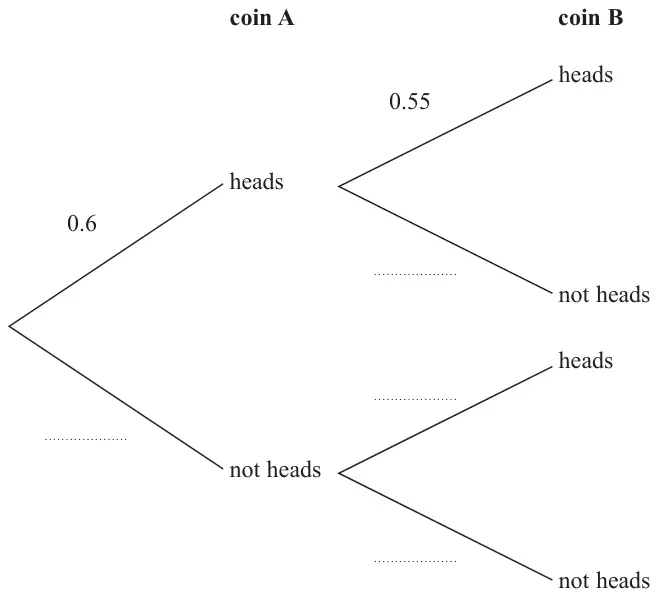
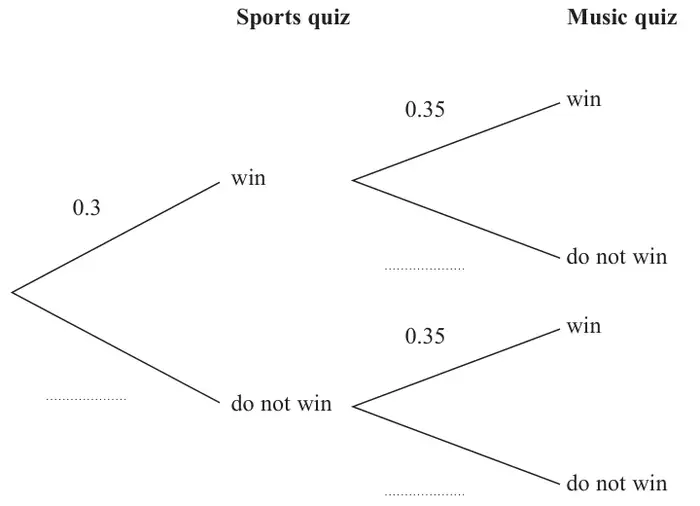
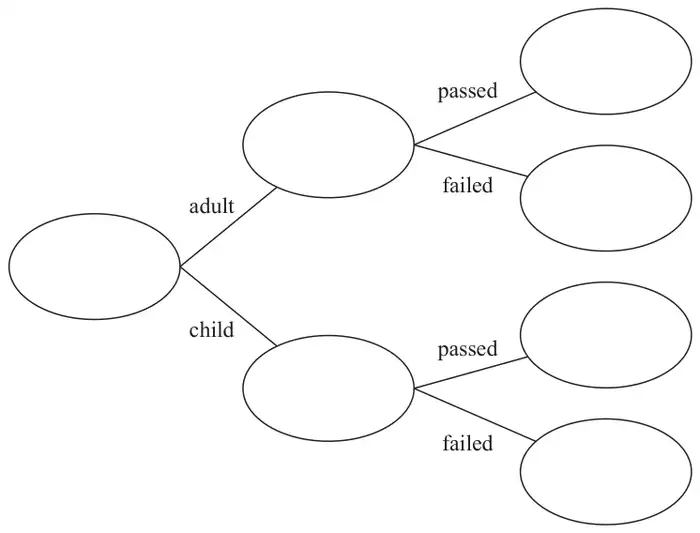
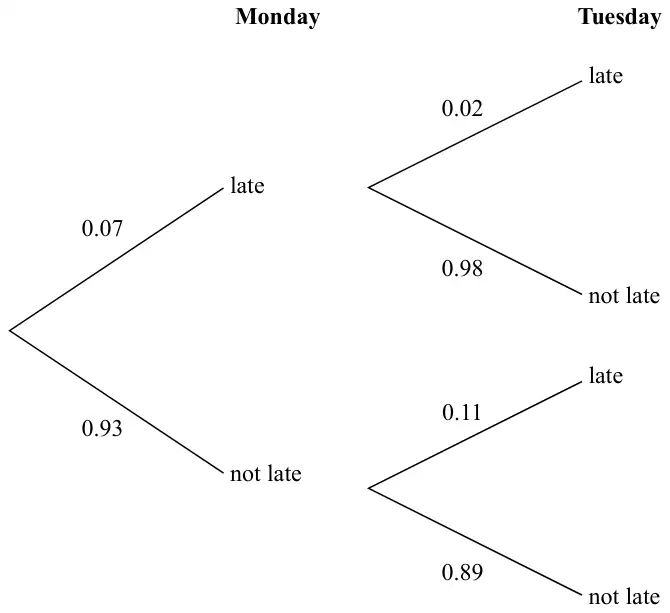
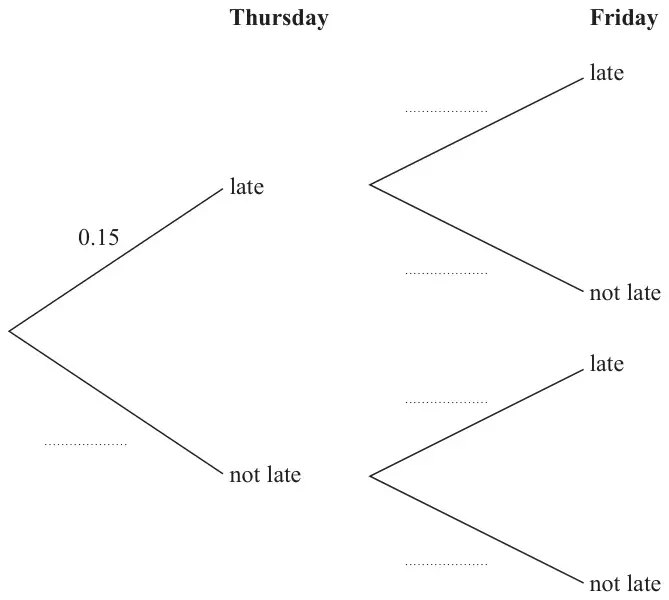
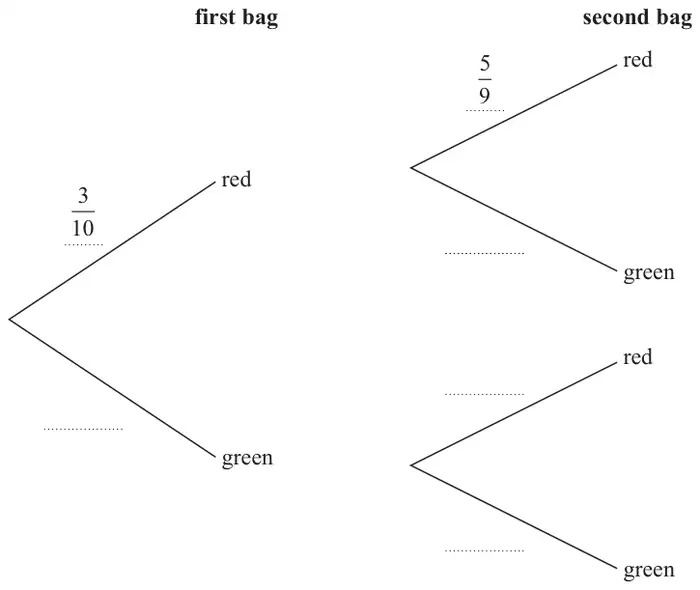
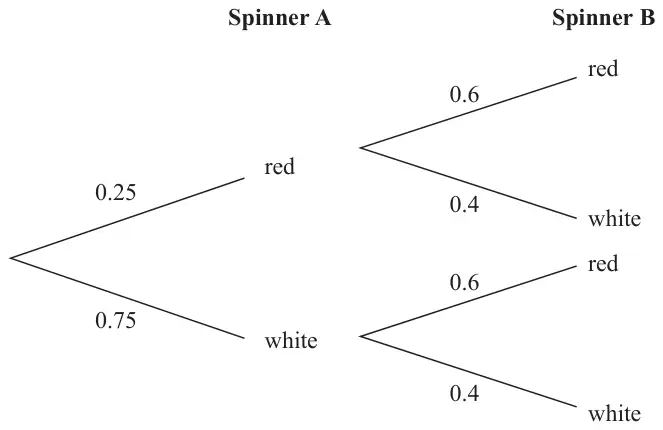
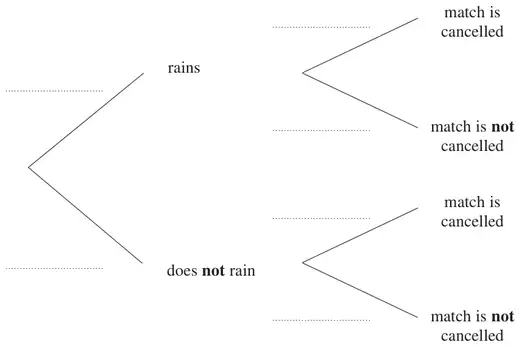
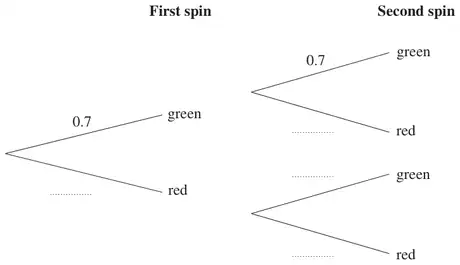
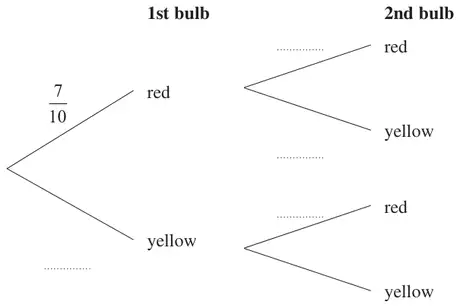
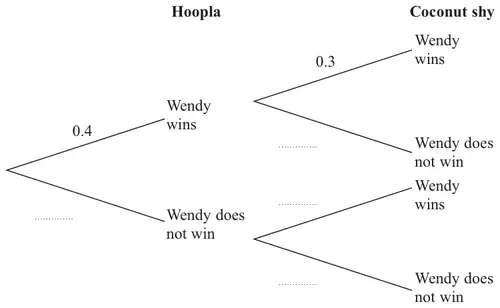
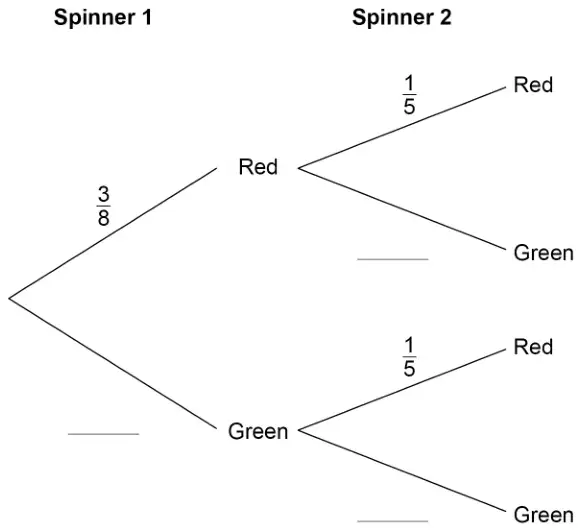
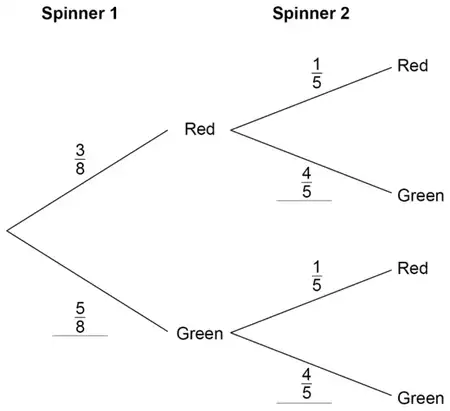
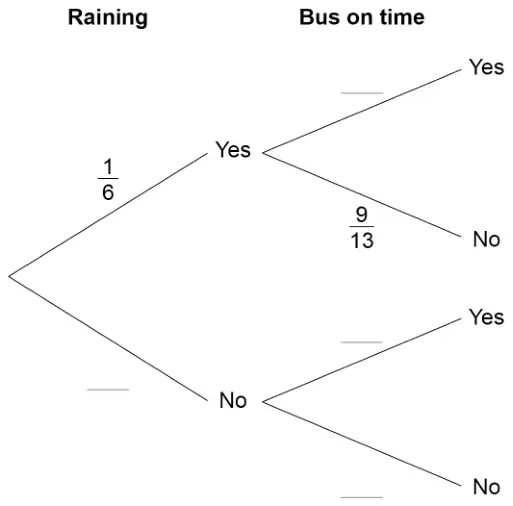
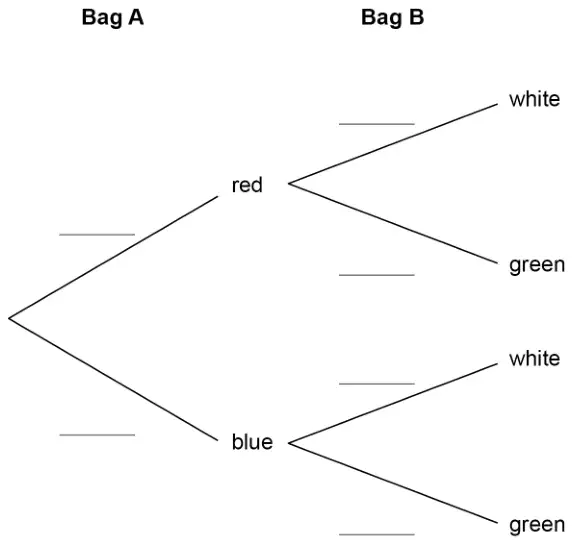
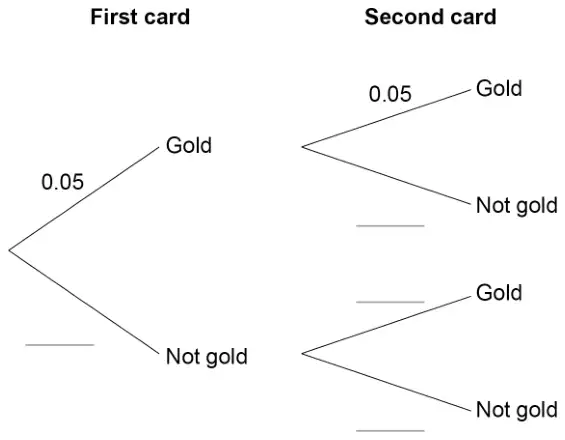
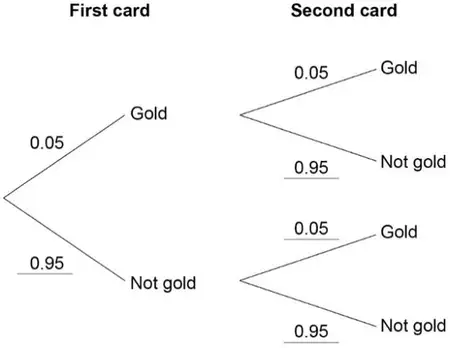
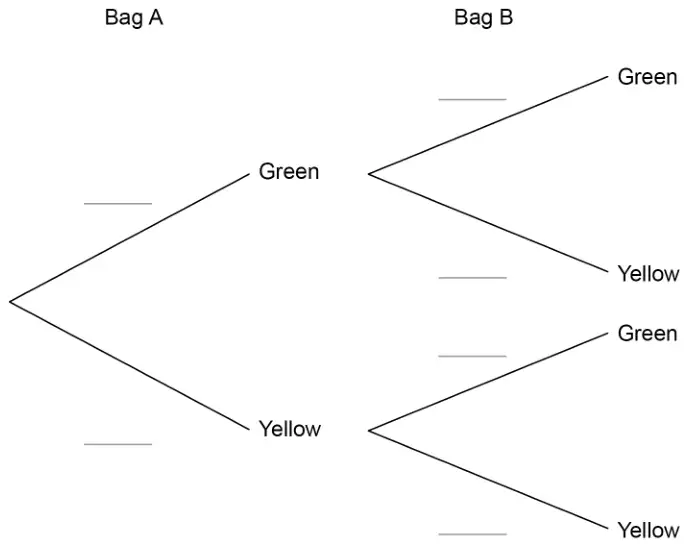
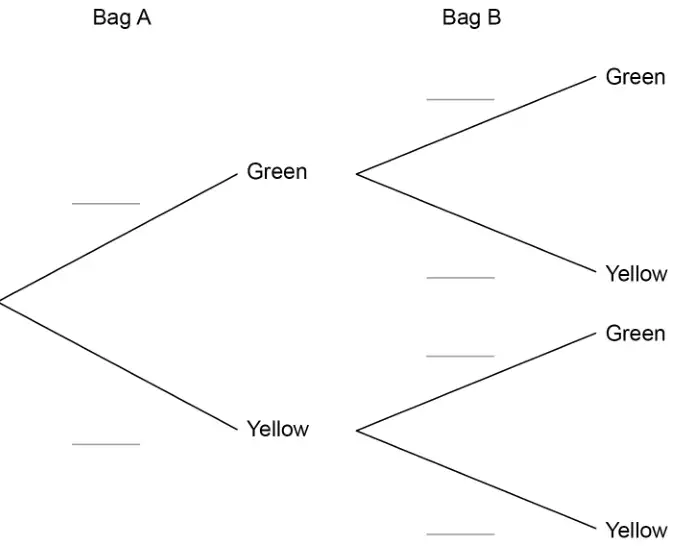
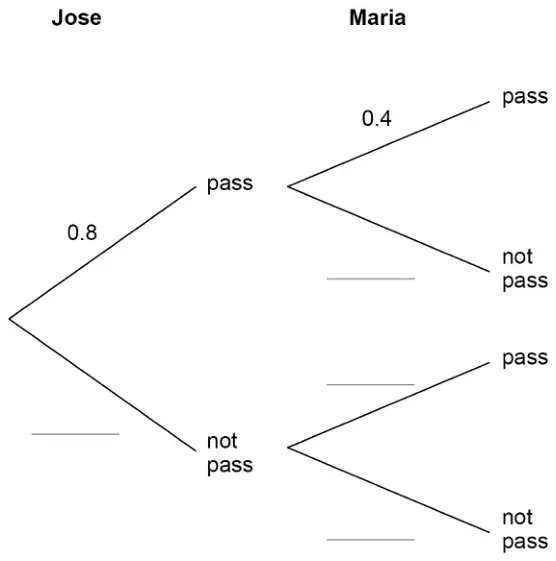
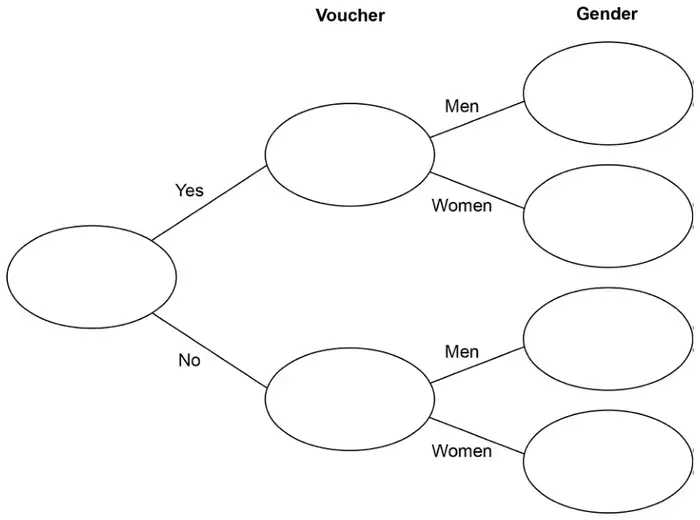
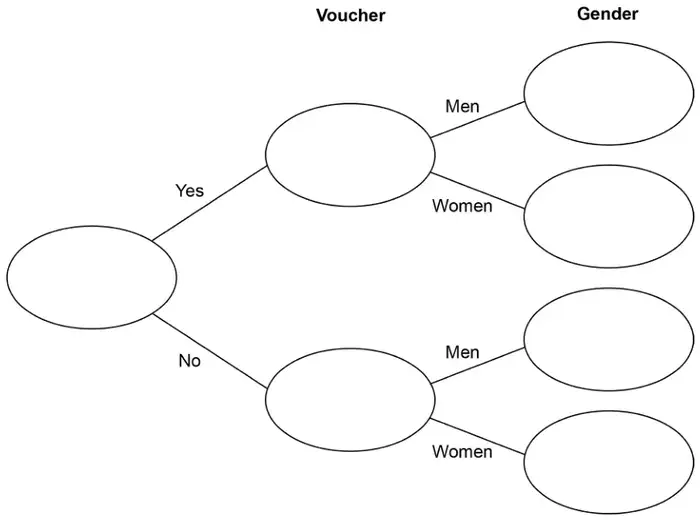
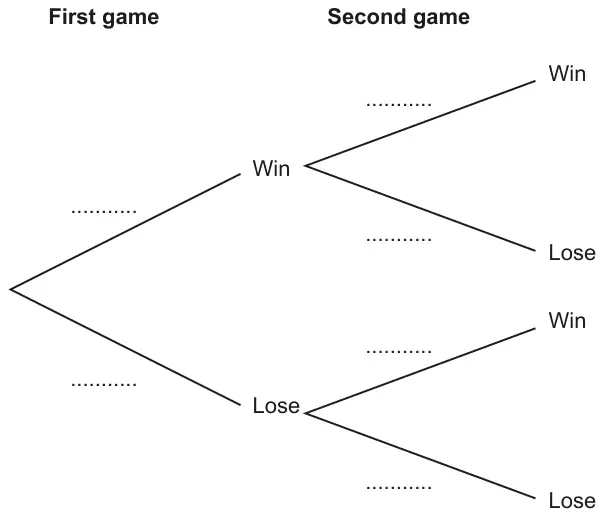
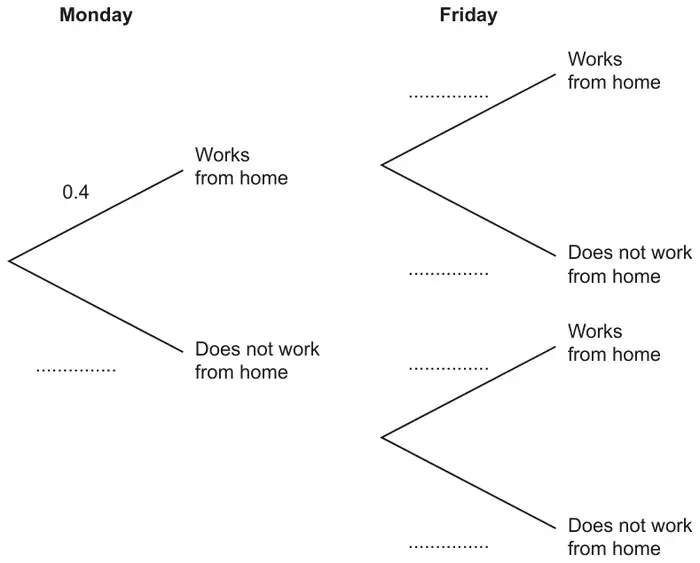
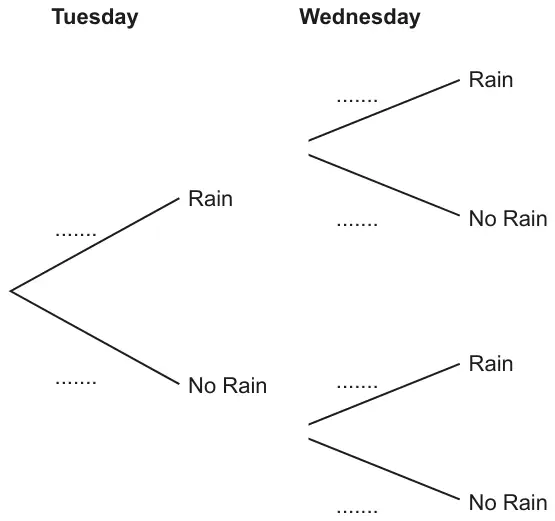
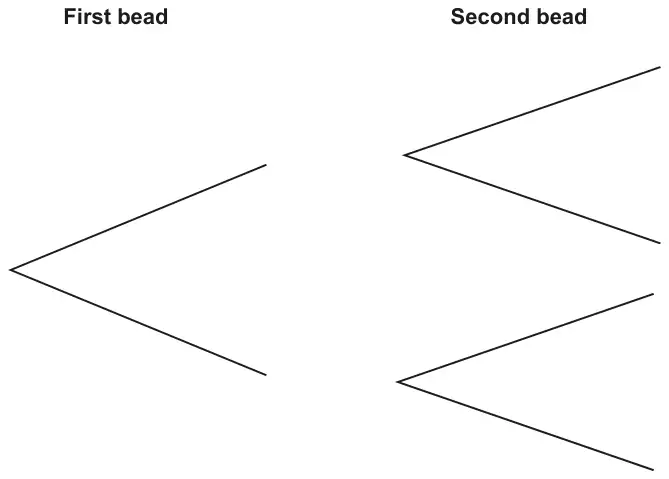
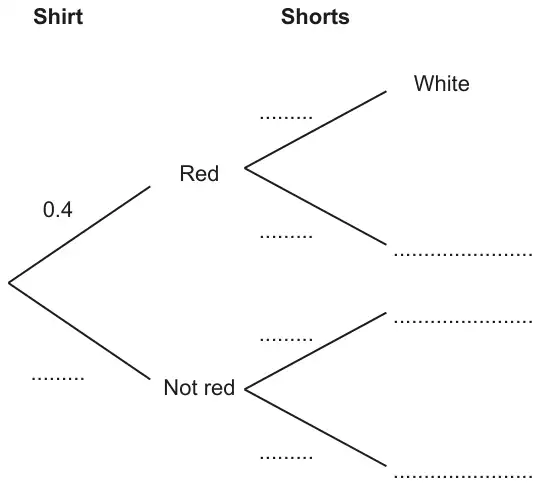
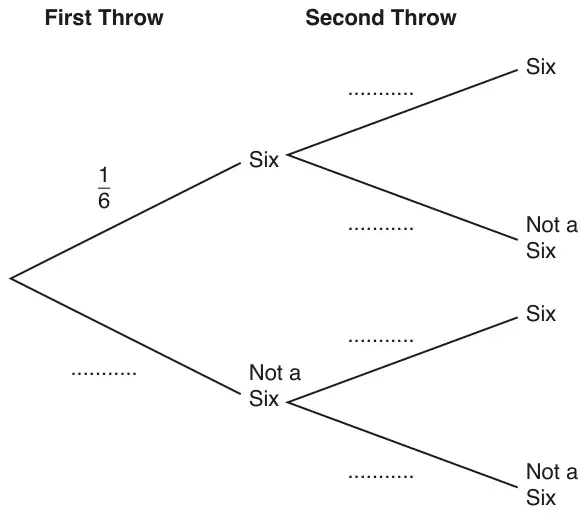
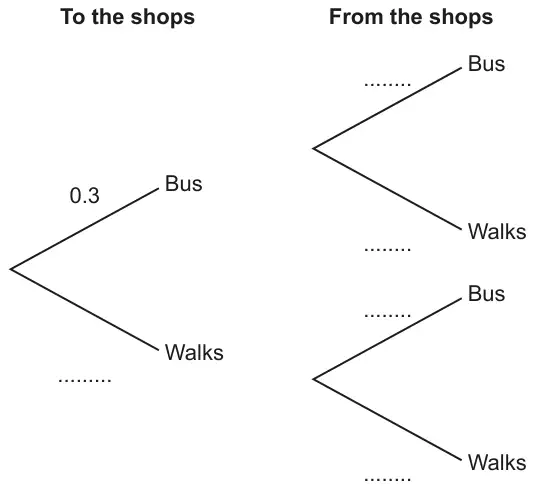
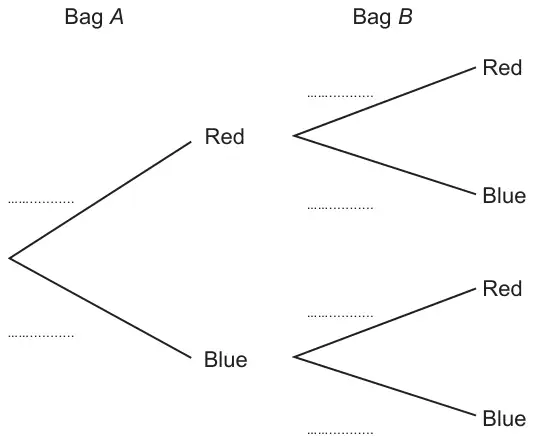
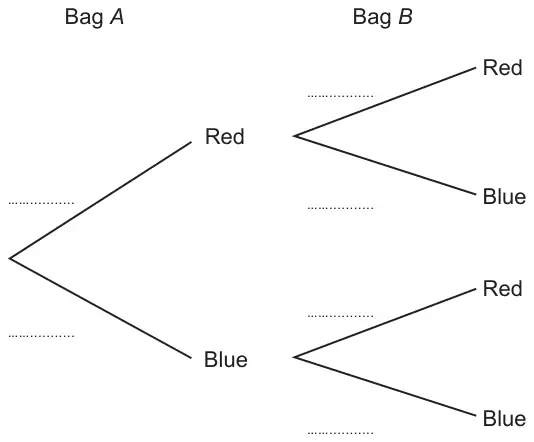
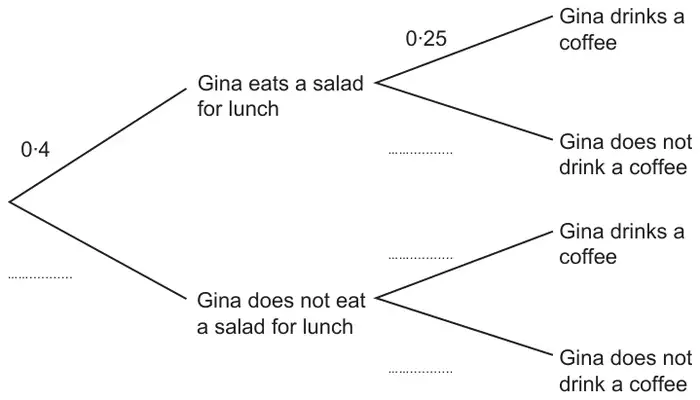
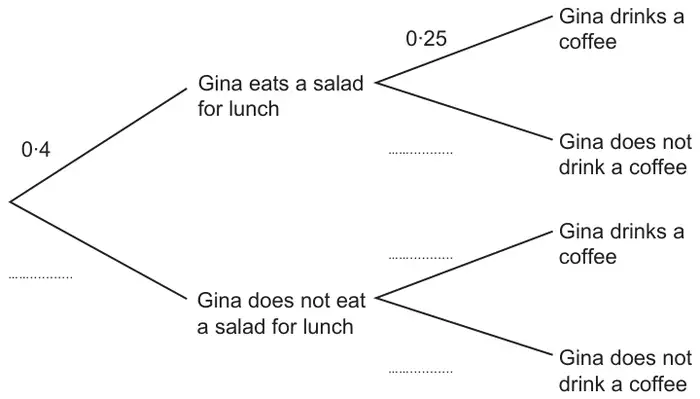
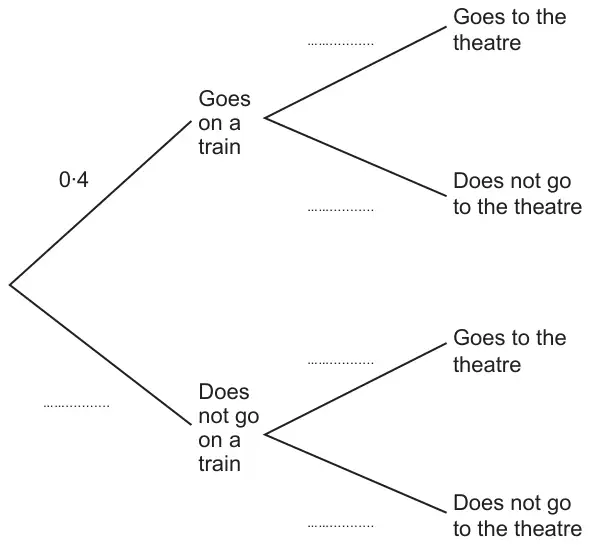
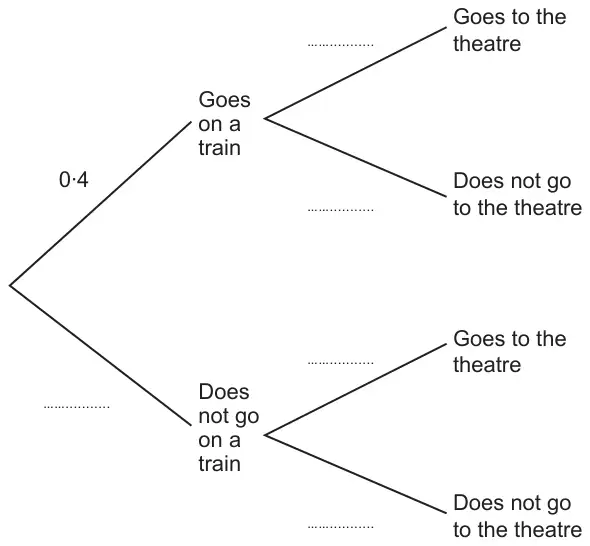
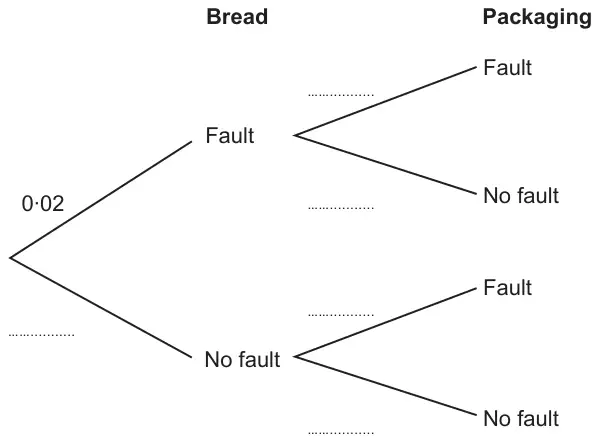
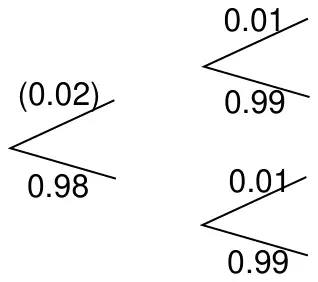
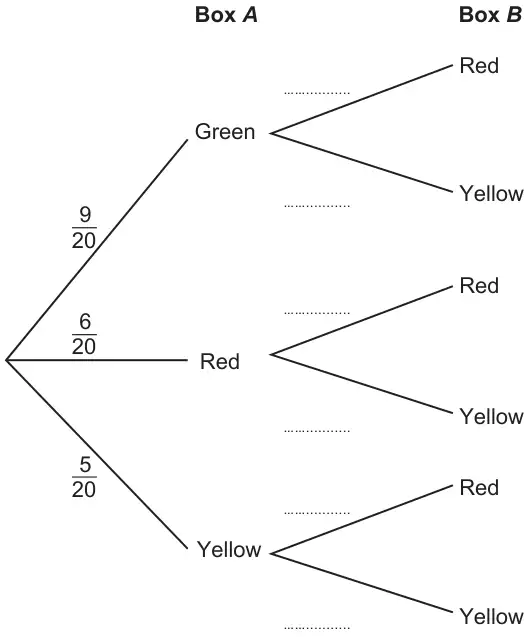
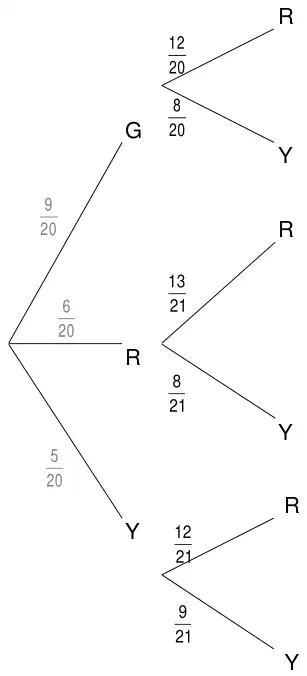
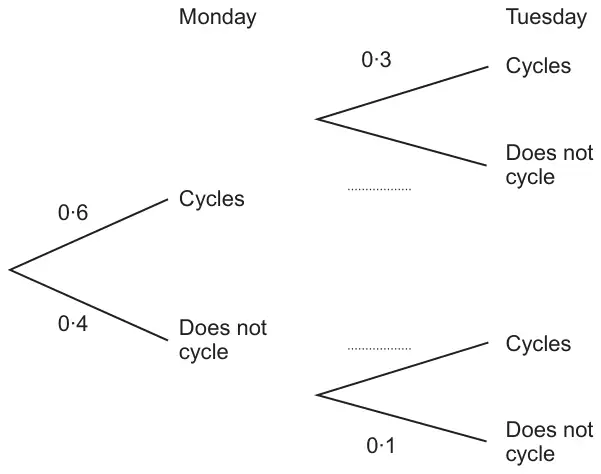
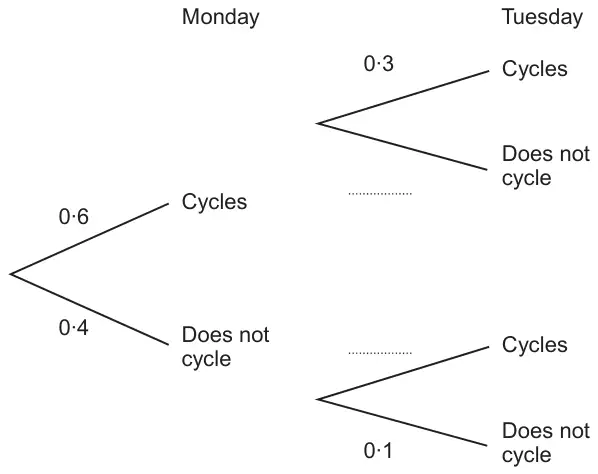
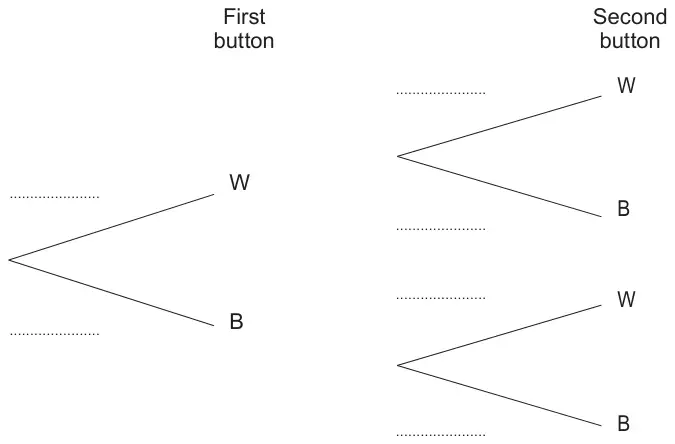
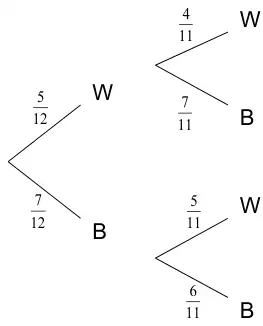
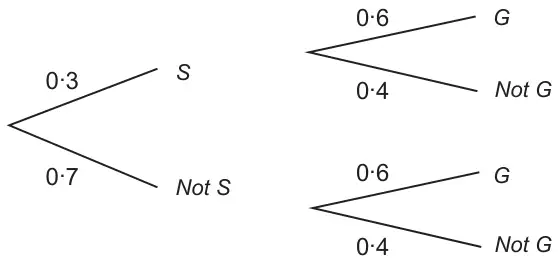
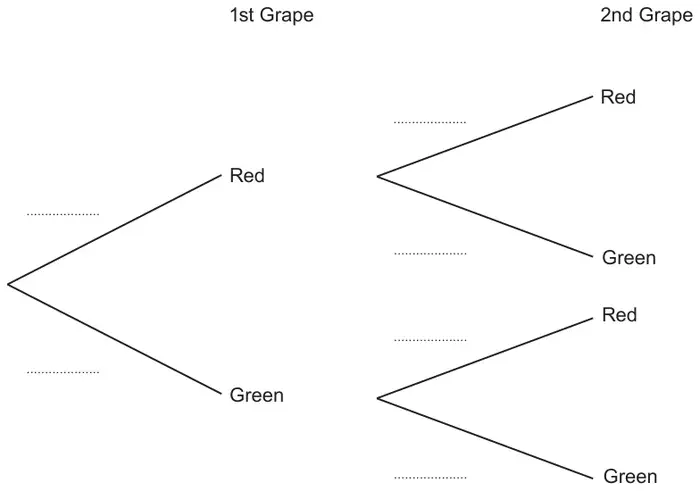
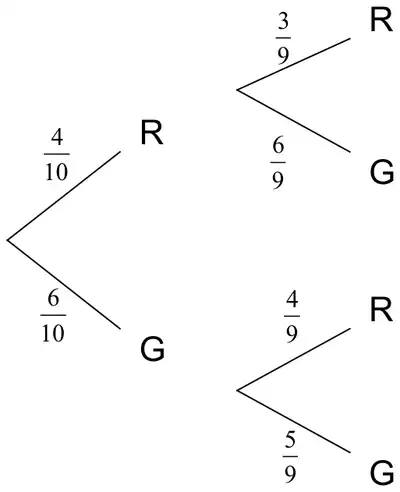
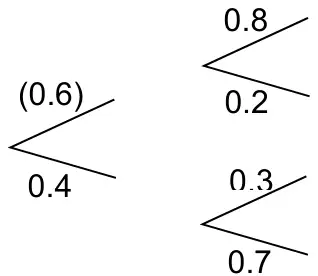
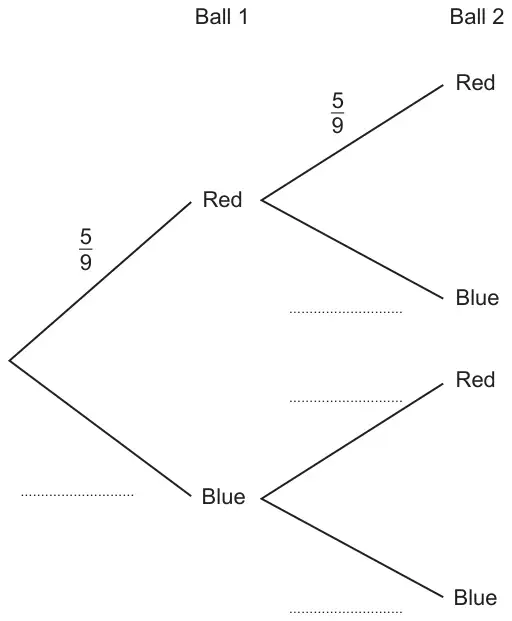
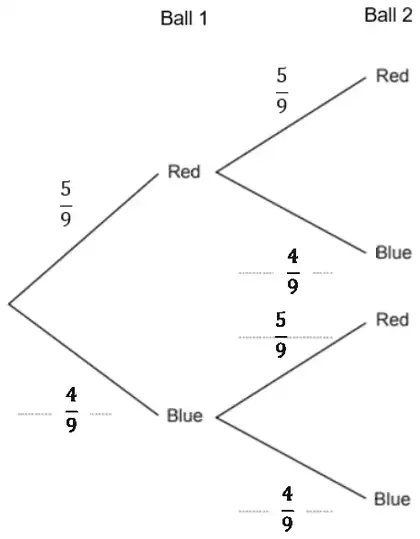
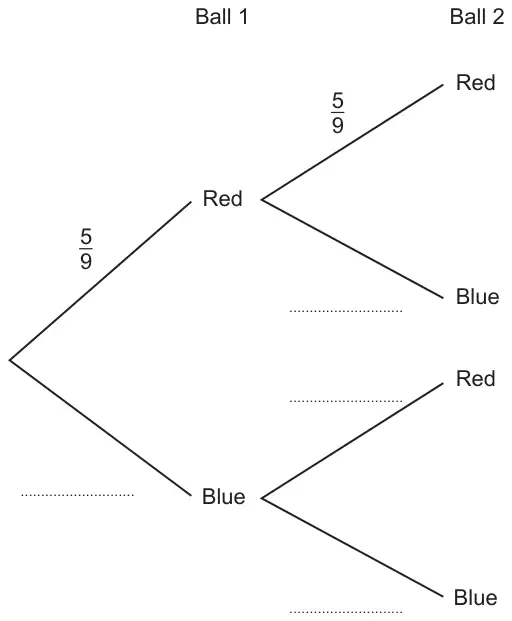
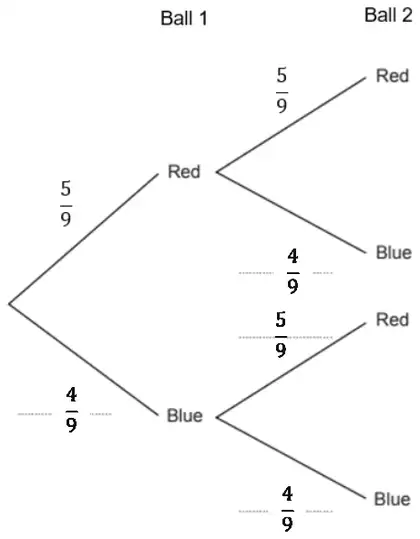
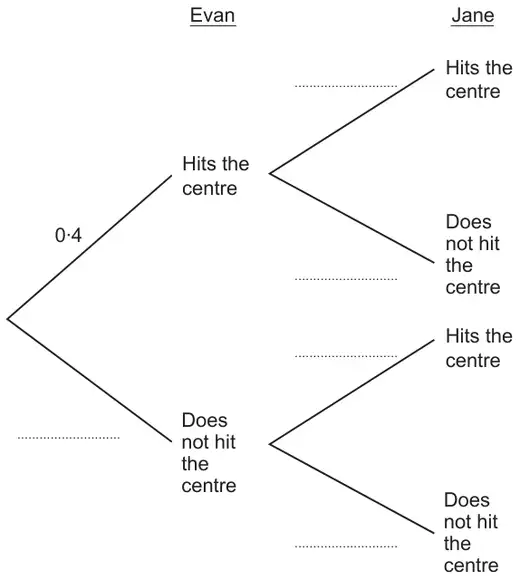
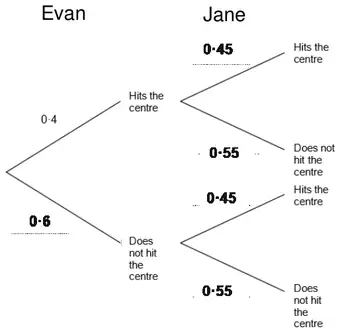
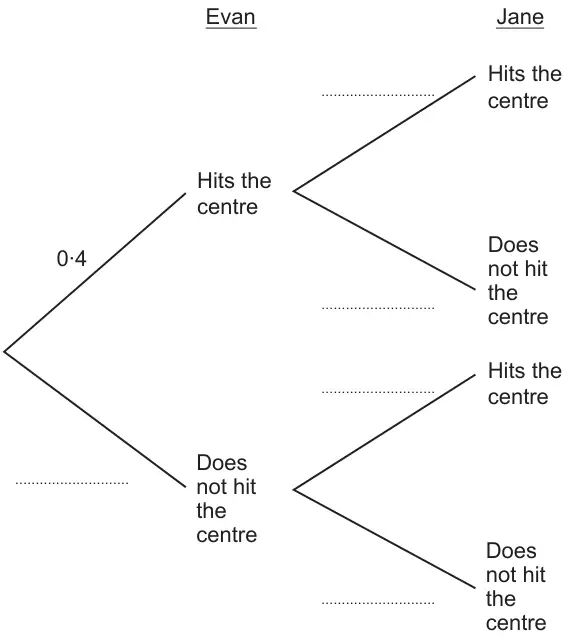
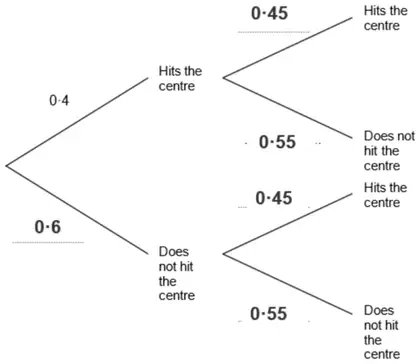
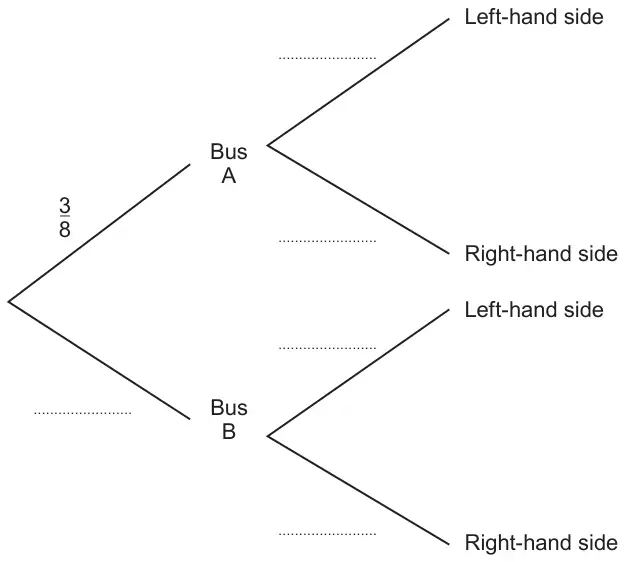
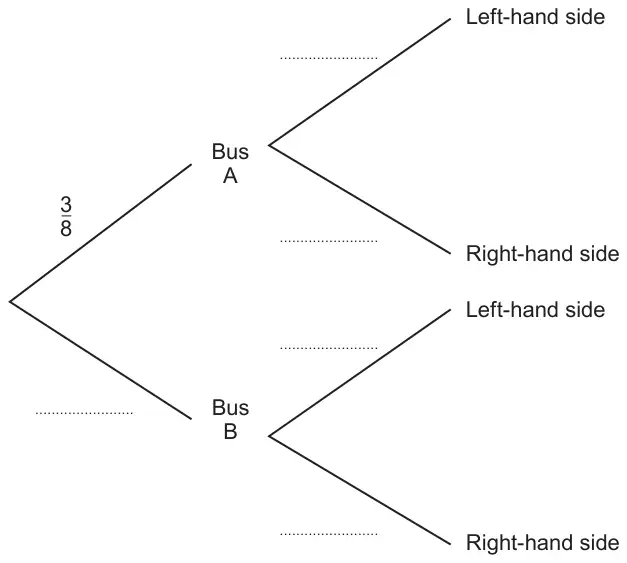
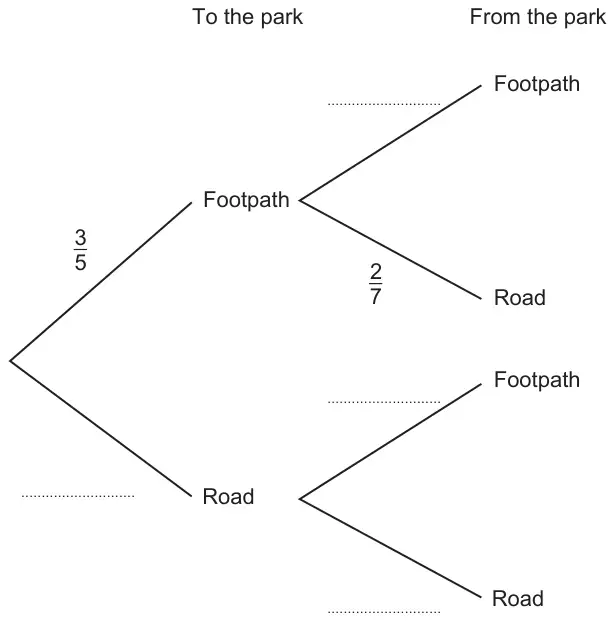
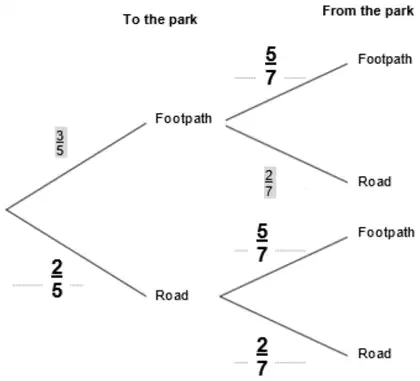
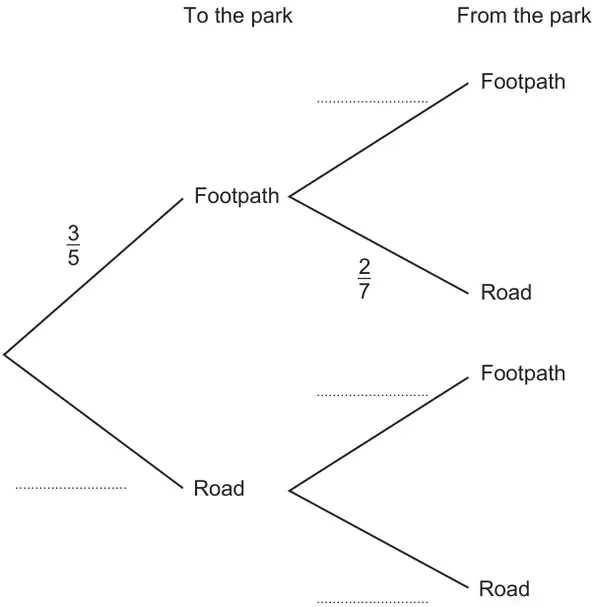
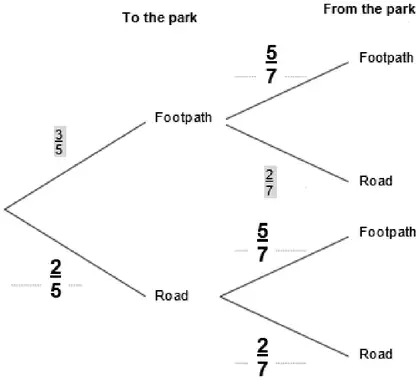
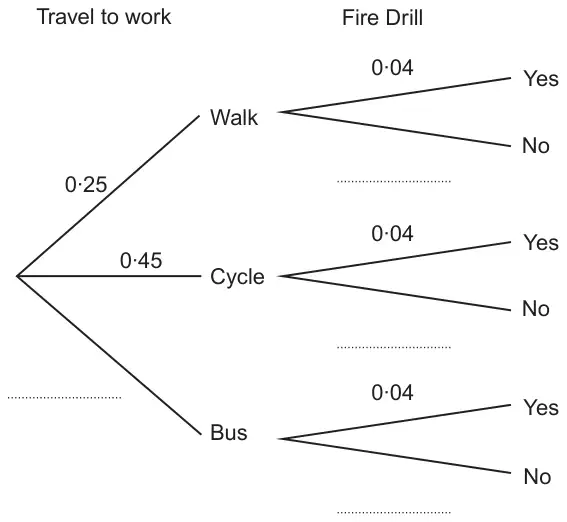
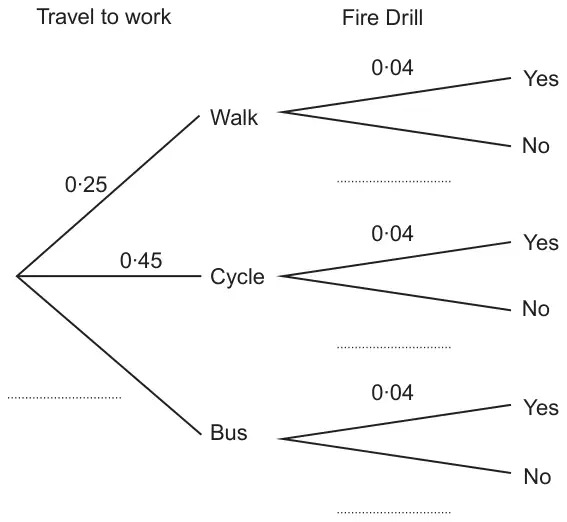
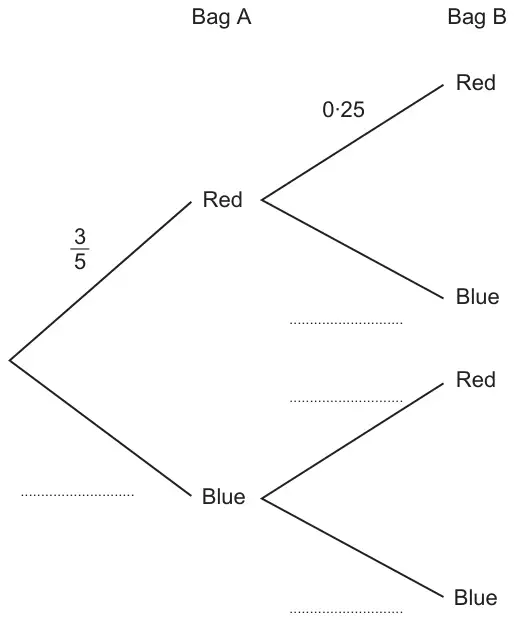
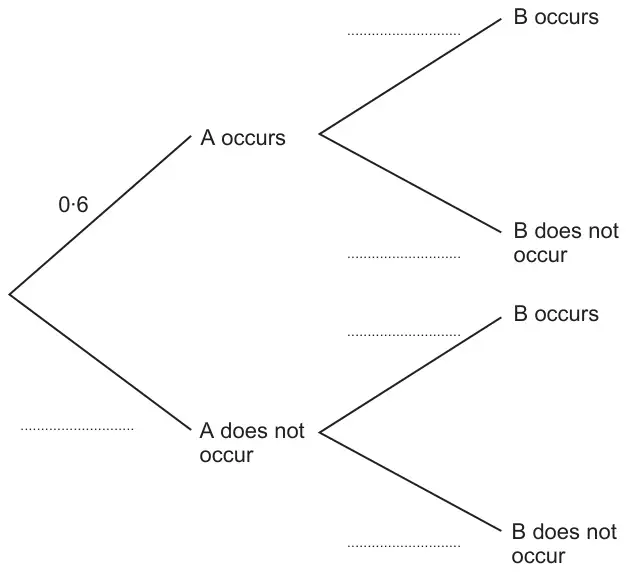
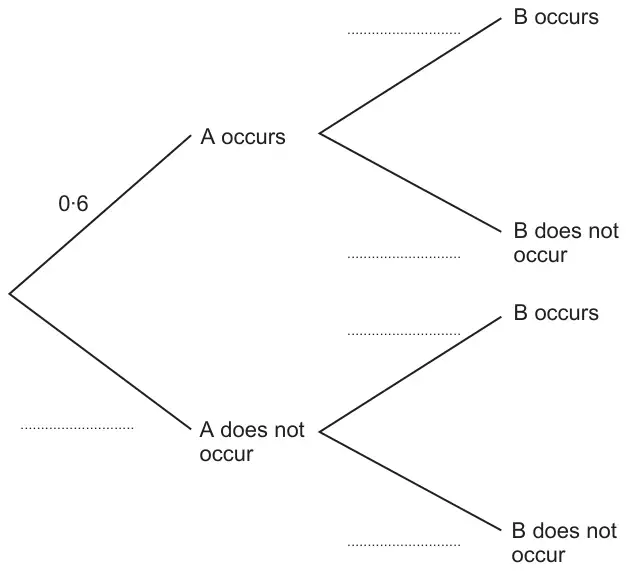
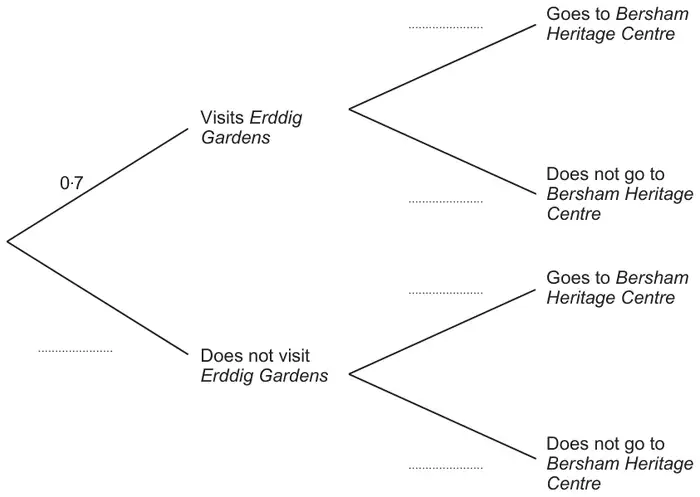
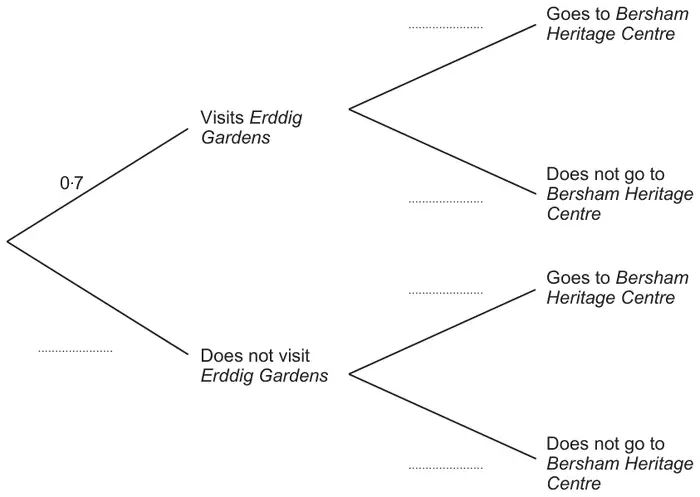
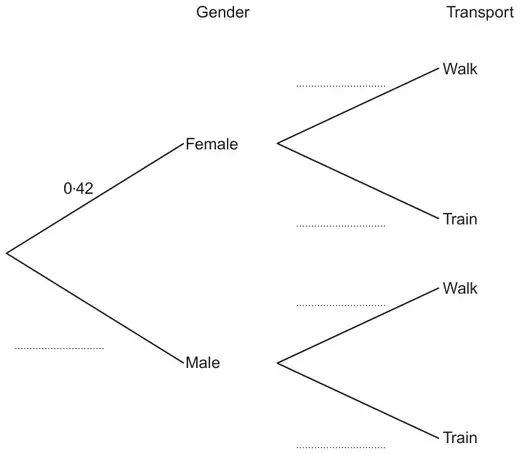
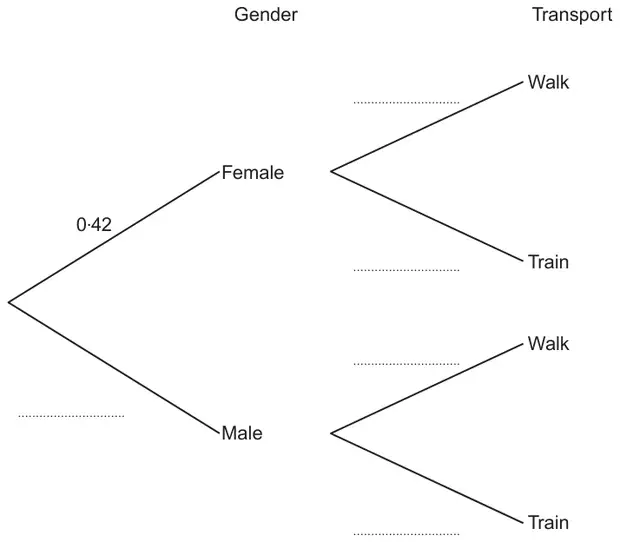
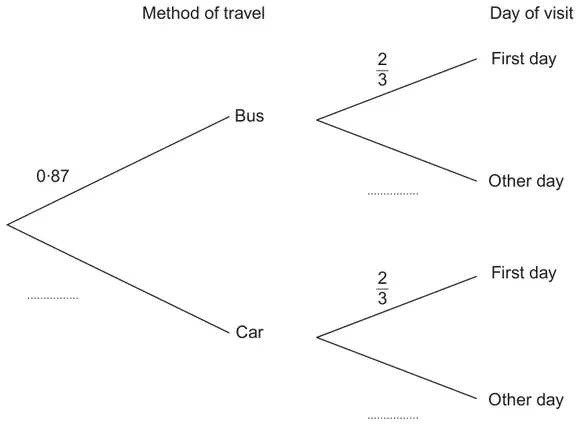
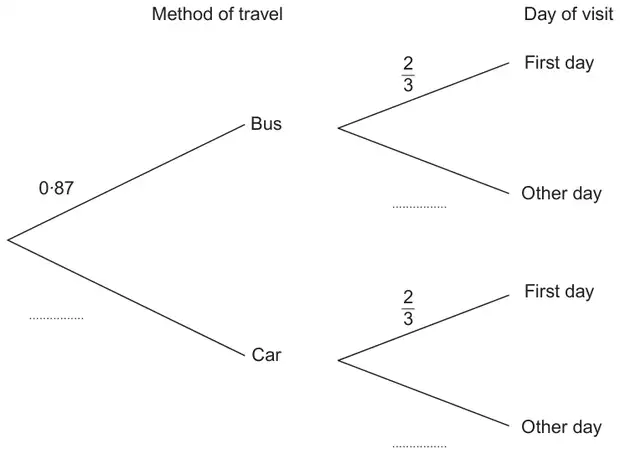
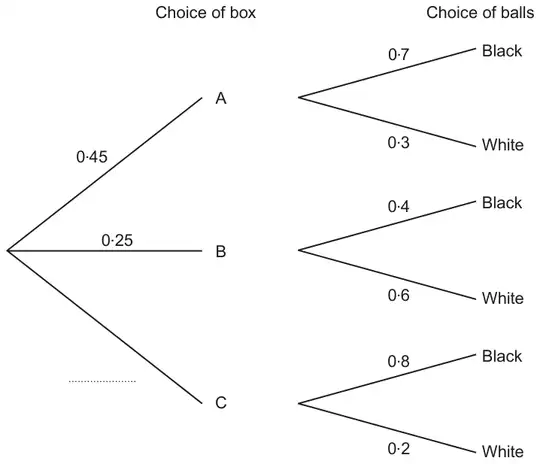
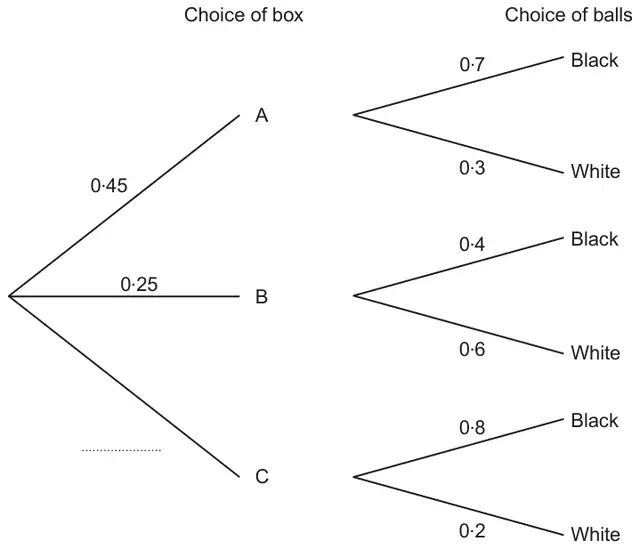
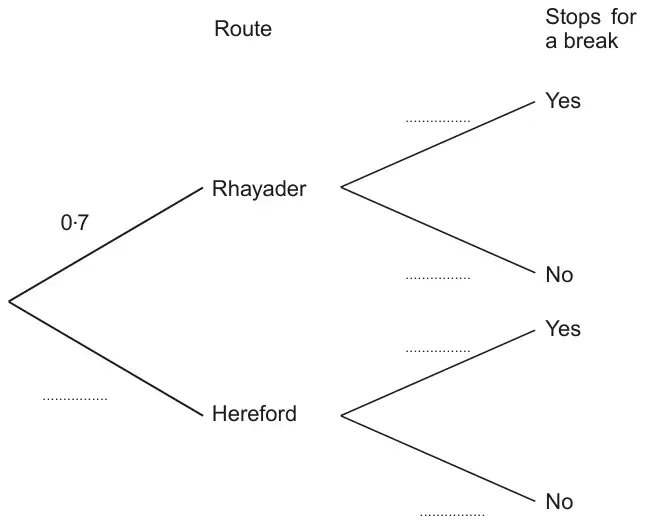
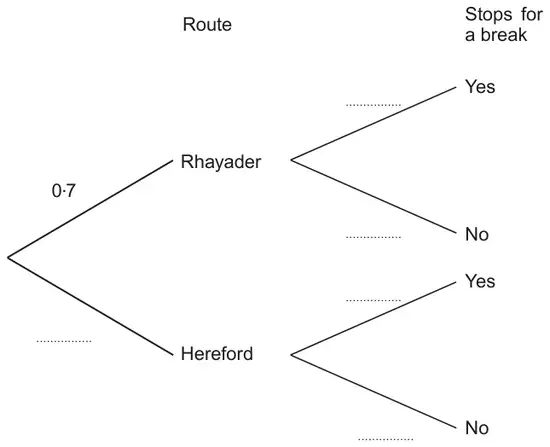
The probability that Freya will pass the exam is 0.8 The probability that Ria will pass the exam is 0.85
(a) Complete the probability tree diagram.(2)
(b) Work out the probability that only one of Freya or Ria will pass the exam. (3)
Mark scheme (a)
Answer
Mark
Mark scheme
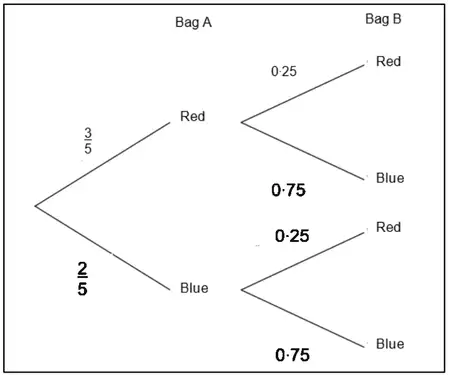
0.2, 0.15, 0.85, 0.15
B2
all placed correctly
(B1
for 2 or 3 placed correctly)
Mark scheme (b)
Answer
Mark
Mark scheme
0.29
M1
for one correct product, ft their tree diagram eg \(0.8 \times 0.85\ (= 0.68)\) or \(0.8 \times \text{``}0.15\text{''}\ (= 0.12)\) or \(\text{``}0.2\text{''} \times \text{``}0.85\text{''}\ (= 0.17)\) or \(\text{``}0.2\text{''} \times \text{``}0.15\text{''}\ (= 0.03)\)
M1
for a complete method, ft their tree diagram eg \(\text{``}0.2\text{''} \times \text{``}0.85\text{''} + 0.8 \times \text{``}0.15\text{''}\) or \(1 - (0.8 \times 0.85 + \text{``}0.2\text{''} \times \text{``}0.15\text{''})\)
A1
for 0.29 oe or ft their tree diagram
Additional guidance
Working for part (b) may be seen in part (a) To apply ft values must be <1
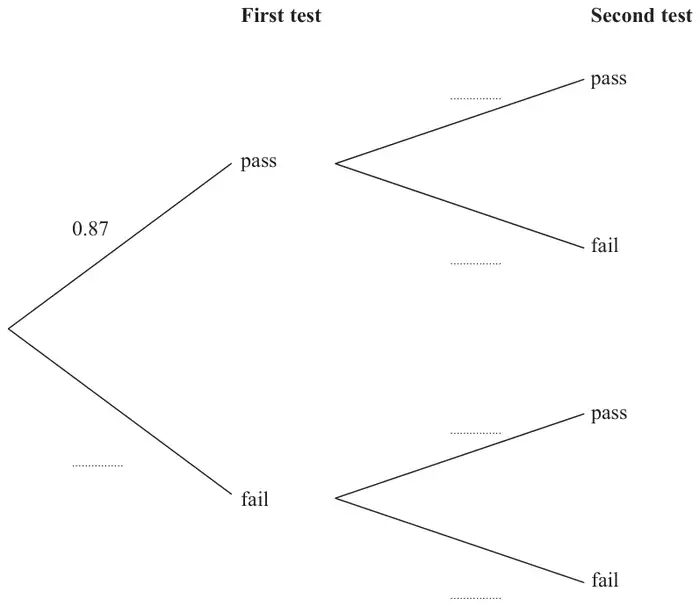
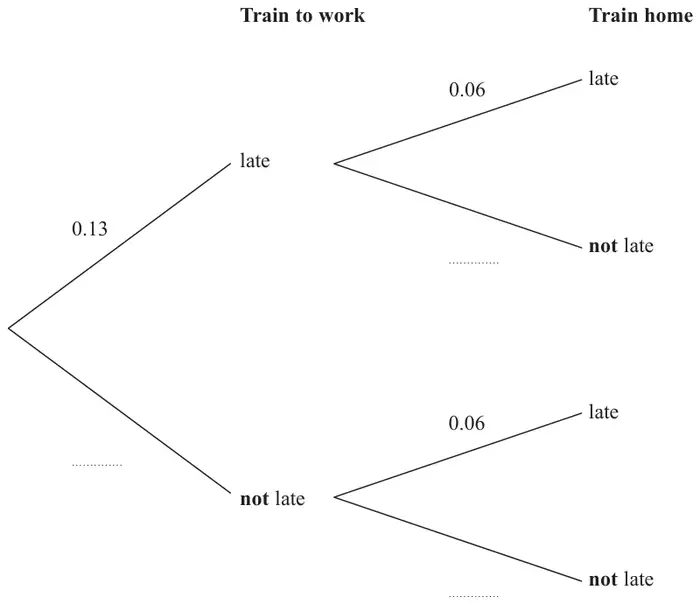
10 Shakir has to complete two tests. He can either pass or fail each test.
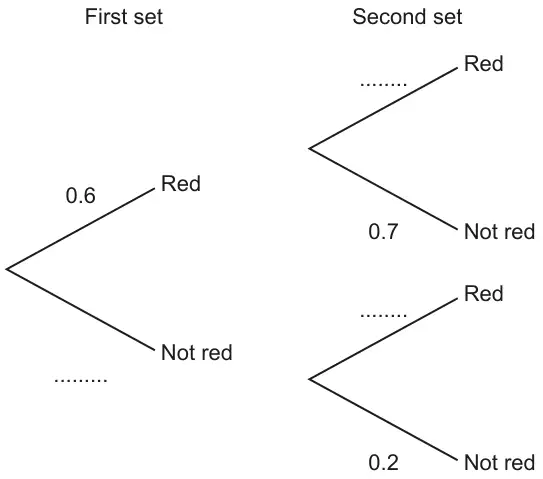
The probability that he will pass the first test is 0.87
If he passes the first test the probability he will pass the second test is 0.94 If he fails the first test the probability he will pass the second test is 0.73
(a) Complete the probability tree diagram for this information.(2)
(b) Work out the probability that Shakir passes at least one of the tests. (3)
Mark scheme (a)
Answer
Mark
Mark scheme
0.13, 0.94, 0.06, 0.73, 0.27
B2
for all values correctly placed
(B1
for at least 2 correct values placed)
Mark scheme (b)
Answer
Mark
Mark scheme
0.9649
M1
(ft their diagram) for one correct product, eg \(0.87 \times 0.94\ (= 0.8178)\) or \(0.87 \times 0.06\ (= 0.0522)\) or \(0.13 \times 0.73\ (= 0.0949)\) or \(0.13 \times 0.27\ (= 0.0351)\)
M1
for a full method, eg \(\text{``}0.8178\text{''} + \text{``}0.0522\text{''} + \text{``}0.0949\text{''}\) or \(1 - \text{``}0.0351\text{''}\)
A1
for 0.9649, 96.49% or \(\dfrac{9649}{10000}\)
Additional guidance
Allow values that are truncated or rounded as long as the intention is clear.
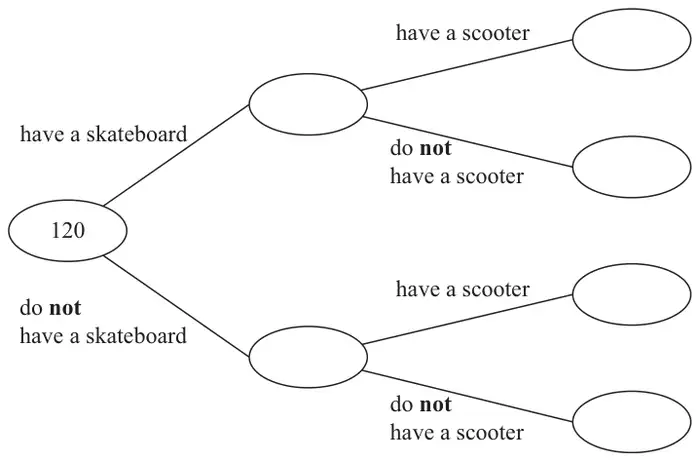
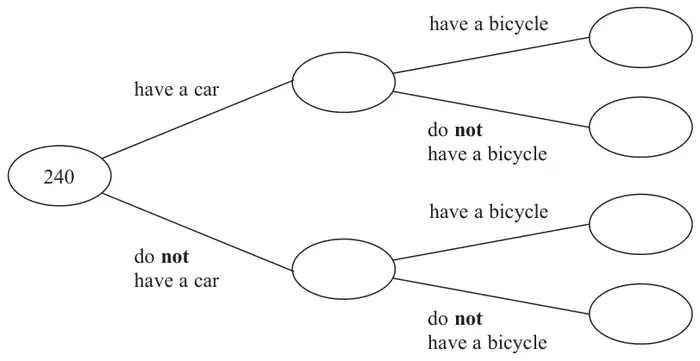
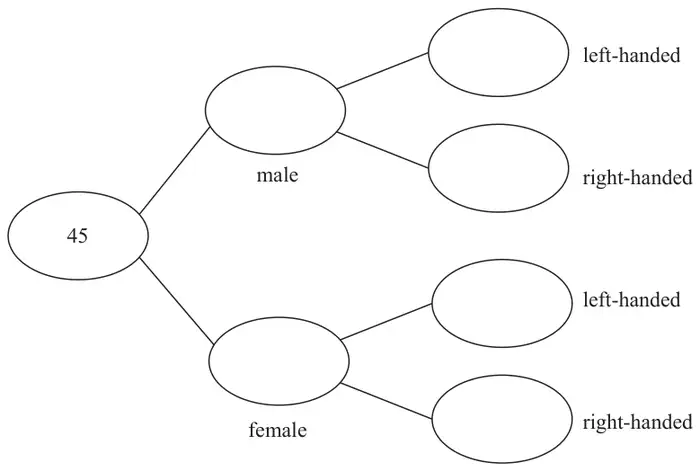
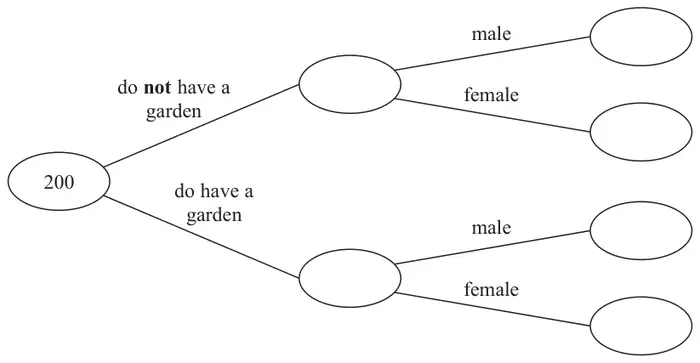
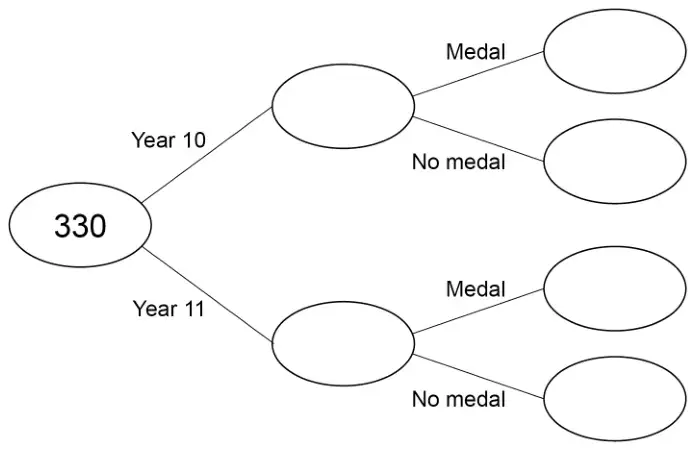
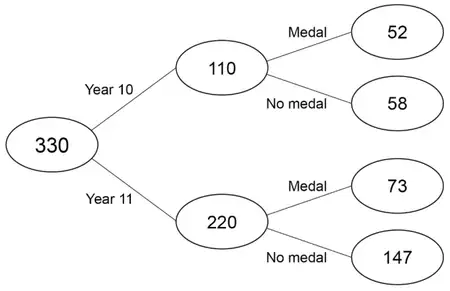
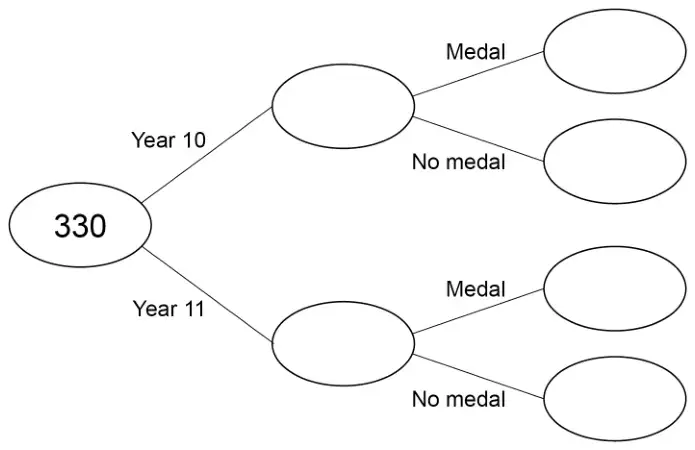
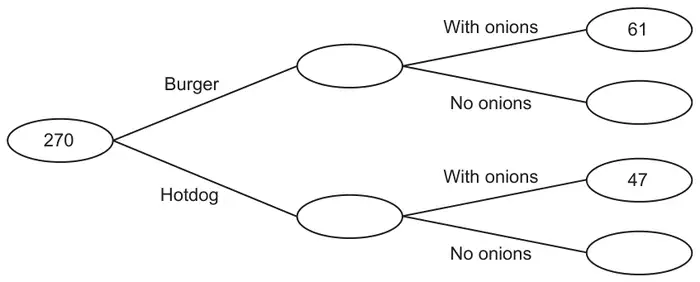
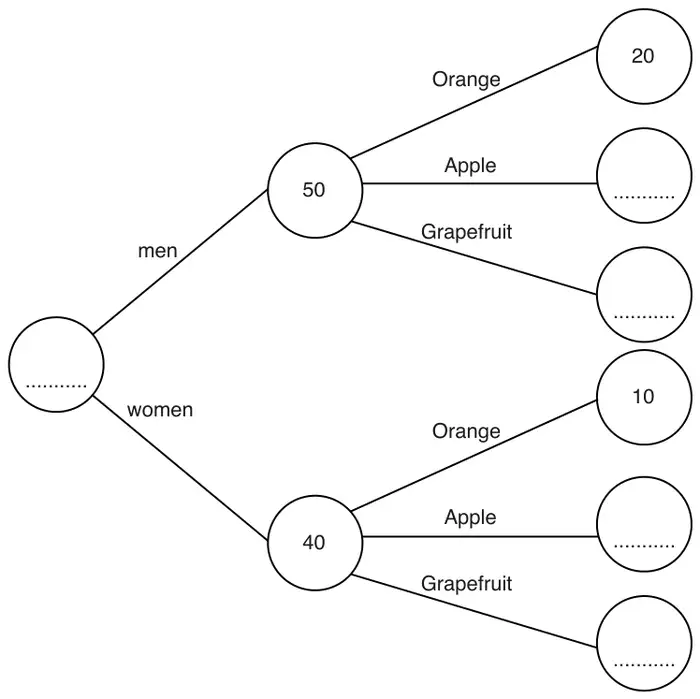
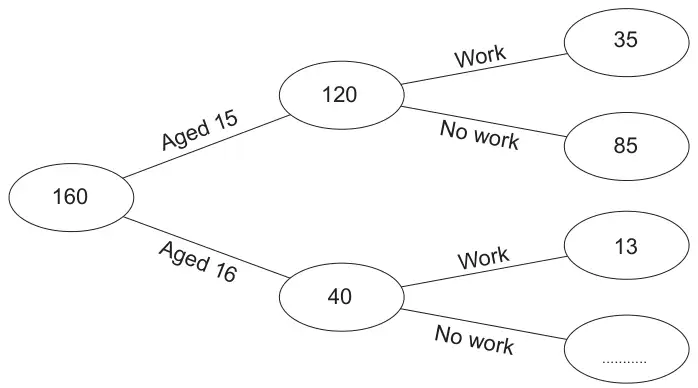
150 have a car 110 have a bicycle 65 of the people who have a bicycle do not have a car.
(a) Use this information to complete the frequency tree.(3)
(b) What percentage of the 150 people who have a car also have a bicycle? (2)
Mark scheme (a)
Answer
Mark
Mark scheme
Frequency tree
B3
for a fully correct frequency tree
(B2
for at least 4 figures correctly placed)
(B1
for at least 1 figure correctly placed)
Additional guidance
If probabilities used instead of frequencies award a maximum of B2
Answer
have a car 150
have a bicycle 45 do not have a bicycle 105
do not have a car 90
have a bicycle 65 do not have a bicycle 25
Mark scheme (b)
Answer
Mark
Mark scheme
30
M1
for eg \(\dfrac{45}{150}\) oe or \(45 \div 150\ (= 0.3)\) or for \(\dfrac{[\text{number of car owners who own a bicycle}]}{[\text{total number of people who own a car}]}\) ft diagram oe
A1
for 30 or ft diagram
Additional guidance
Must be values from their diagram with numerator < denominator
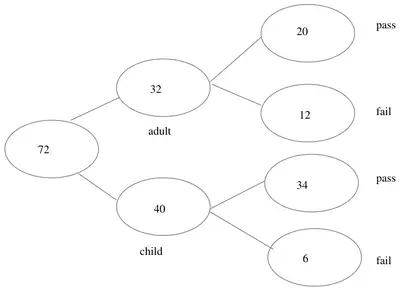
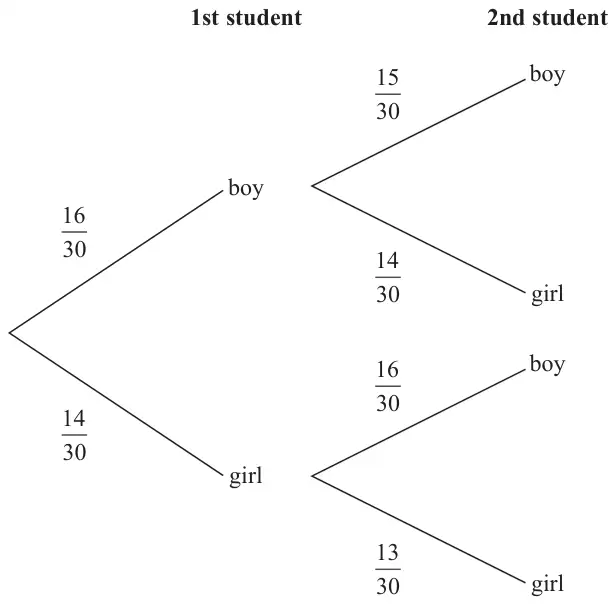
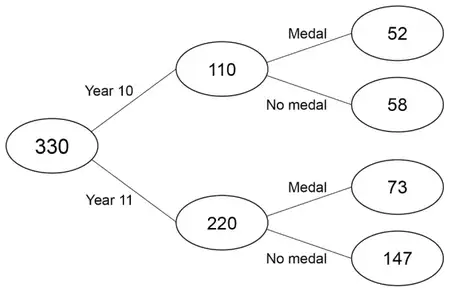
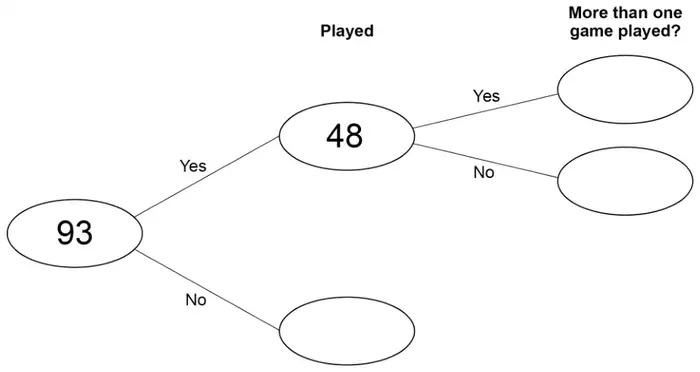
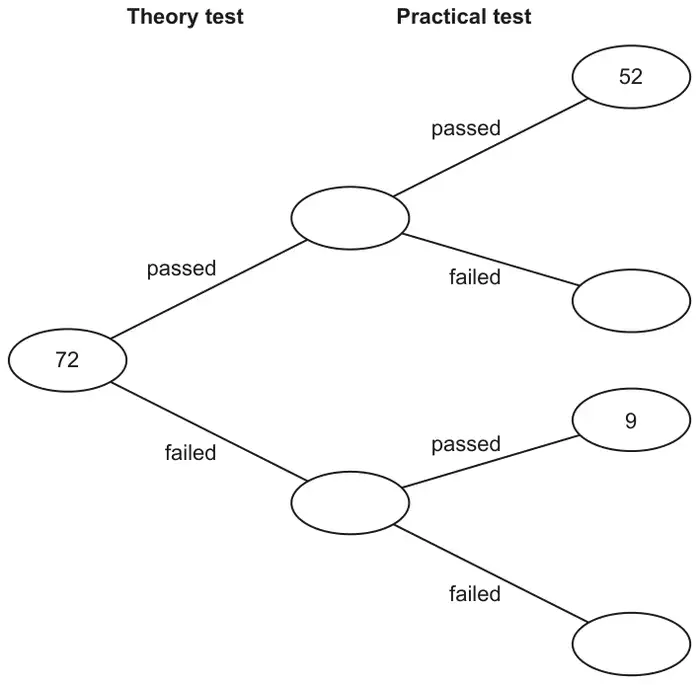
20 of the 32 adults who did the test passed. 6 of the children who did the test failed.
(a) Use this information to complete the frequency tree.(3)
One of these people is picked at random.
(b) Find the probability that this person is an adult who failed the test. (2)
Mark scheme (a)
Answer
Mark
Mark scheme
Frequency diagram
See end of m/s
C3
for a fully correct frequency diagram
(C2
for at least 5 correct values in the frequency diagram)
(C1
for at least 3 correct values in the frequency diagram)
Additional guidance
If probabilities used instead of frequencies then maximum of C2 can be awarded
Mark scheme (b)
Answer
Mark
Mark scheme
\(\dfrac{12}{72}\)
M1
for \(\dfrac{a}{72}\) where \(0 \lt a \lt 72\) and \(a\) is an integer or \(\dfrac{12}{b}\) where \(b \gt 12\) and \(b\) is an integer or 12 : 72 or ft their values for 72 and/or 12 from (a)
A1
for \(\dfrac{12}{72}\) oe or ft (a)
Additional guidance
Accept equivalent decimal or percentage forms of probability Ignore errors in cancelling of their \(\dfrac{12}{72}\)
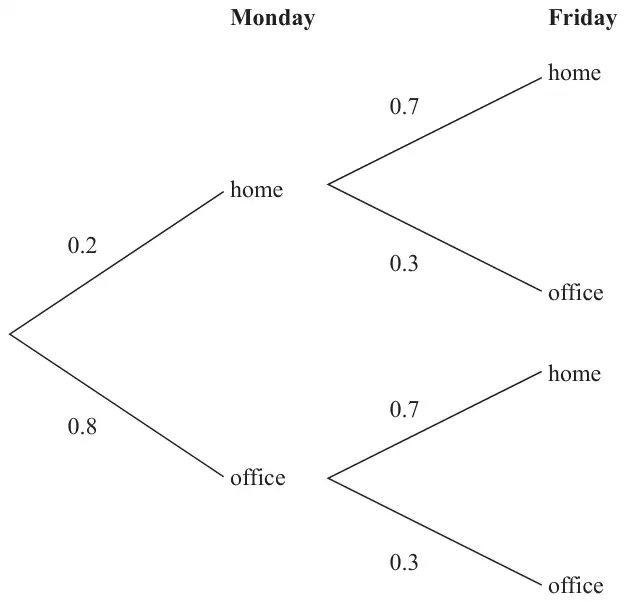
if it rains on one day, the probability that it will rain on the next day is 0.8 if it does not rain on one day, the probability that it will rain on the next day is 0.6
A weather forecaster says, “There is a 70% chance that it will rain in the village on Monday.”
Work out an estimate for the probability that it will rain in the village on Wednesday. You must show all your working. (4)
Mark scheme
Answer
Mark
Mark scheme
0.748
P1
for a process to find a correct probability product for 2 consecutive days, eg. \(0.7 \times 0.8\) (rain M + T) or \(0.7 \times 0.2\) (rain M + no rain T) or \(0.3 \times 0.6\) (no rain M + rain on T) or \(0.3 \times 0.4\) (no rain M + T)
P1
for process to find a correct triple probability product for it raining on Wednesday, eg. \(0.7 \times 0.8 \times 0.8\) (rain M + T + W) (= 0.448 or \(\dfrac{56}{125}\) oe) or \(0.7 \times 0.2 \times 0.6\) (rain M + no rain T + rain W) (= 0.084 or \(\dfrac{21}{250}\) oe) or \(0.3 \times 0.6 \times 0.8\) (no rain M + rain T + rain W) (= 0.144 or \(\dfrac{18}{125}\) oe) or \(0.3 \times 0.4 \times 0.6\) (no rain M + no rain T + rain W) (= 0.072 or \(\dfrac{9}{125}\) oe)
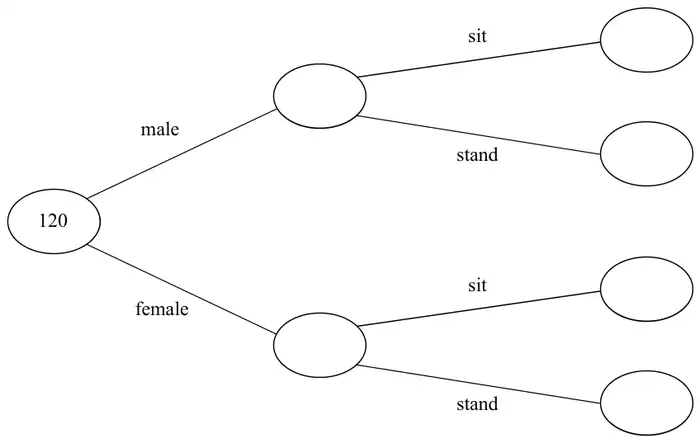
Each person was asked if they wanted to stand or to sit to watch the match.
75 of the people were female 29 of the males wanted to stand 30 of the people wanted to sit
(a) Use this information to complete the frequency tree.(3)
One of the 120 people is chosen at random.
(b) Write down the probability that this person is a male who wanted to stand. (1)
Mark scheme (a)
Answer
Mark
Mark scheme
male 45: sit 16, stand 29 female 75: sit 14, stand 61
C1
starts to interpret information eg 75 or 29 in the correct place
C1
for \(120 - 75\ (= 45)\) and \(\text{``}45\text{''} - 29\ (= 16)\)
C1
Complete and correct frequency tree
Additional guidance
May be seen as numerators of fractions for the first 2 marks.
Could be seen in working or on the diagram
Mark scheme (b)
Answer
Mark
Mark scheme
\(\dfrac{29}{120}\)
B1
for \(\dfrac{29}{120}\) or ft “29” from part (a)
Additional guidance
Accept any equivalent fraction, decimal form 0.24(166...) or percentage form 24(.166.. ) Ignore subsequent incorrect attempts to write the correct answer in a different form.
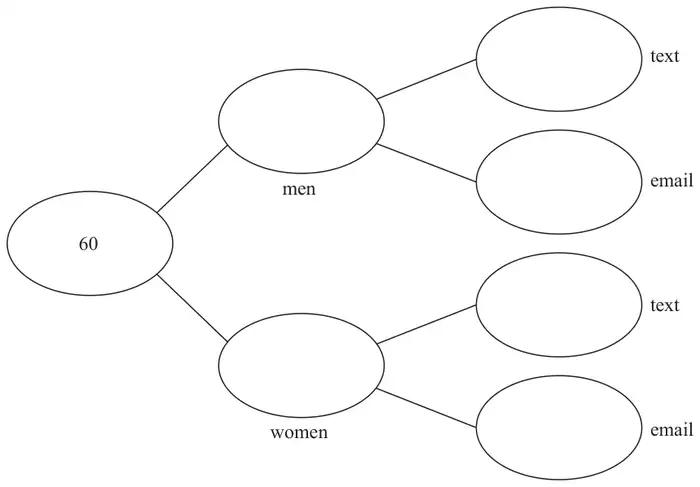
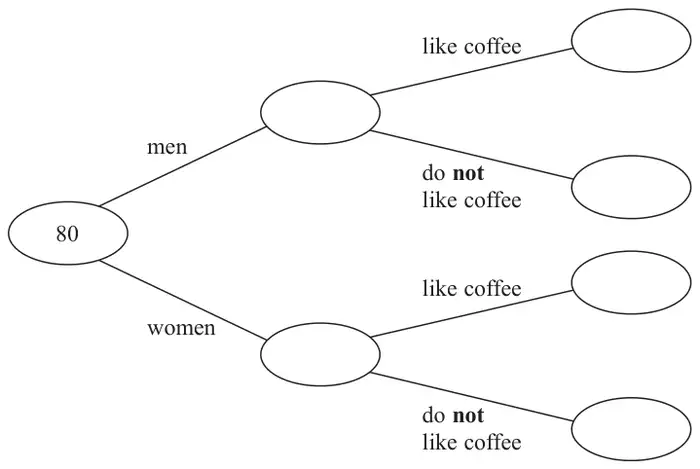
48 of these people are women. 61 of the 80 people like coffee. 8 of the men do not like coffee.
(a) Use this information to complete the frequency tree.(3)
One of the people who like coffee is chosen at random.
(b) Find the probability that this person is a woman. (2)
Mark scheme (a)
Answer
Mark
Mark scheme
32, 48, 24, 8, 37, 11
C1
starts to interpret information, eg 48 or 8 in correct place
C1
for \(80 - 48\ (= 32)\) and \(\text{``}32\text{''} - 8\ (= 24)\)
C1
completes frequency tree correctly SC: award C2 if all correct frequencies are shown as fractions of 80.
Mark scheme (b)
Answer
Mark
Mark scheme
\(\dfrac{37}{61}\)
M1
ft for \(\dfrac{a}{\text{``}61\text{''}}\) with \(a \lt \text{``}61\text{''}\) or \(\dfrac{\text{``}37\text{''}}{b}\) with \(b \gt \text{``}37\text{''}\)
A1
ft from diagram in (a)
Additional guidance
Incorrect notation with “37” and “61” can earn the method mark but not the accuracy mark.
Accept any equivalent fraction, decimal form 0.60(65...) or 0.61 or percentage form 60(.65...)% or 60% or 61%
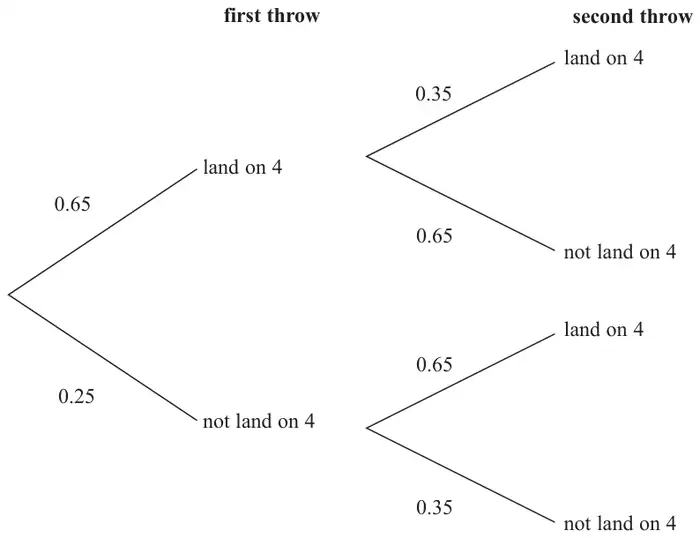
22 When a biased 6-sided dice is thrown once, the probability that it will land on 4 is 0.65 The biased dice is thrown twice.
Amir draws this probability tree diagram. The diagram is not correct.
Write down two things that are wrong with the probability tree diagram. (2)
Mark scheme
Answer
Mark
Mark scheme
Probabilities should sum to 1
C1
for stating that the probabilities should total 1 eg 0.25 should be 0.35
0.35 and 0.65 reversed
C1
for recognising that the 0.35 and 0.65 in the first branches for the 2nd throw should be reversed eg, “for the second throw, the probability it lands on 4 should be 0.65”
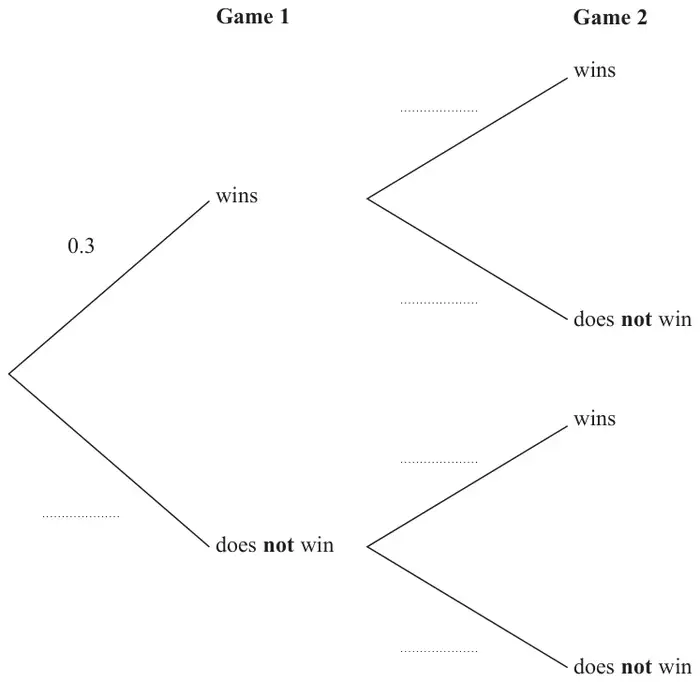
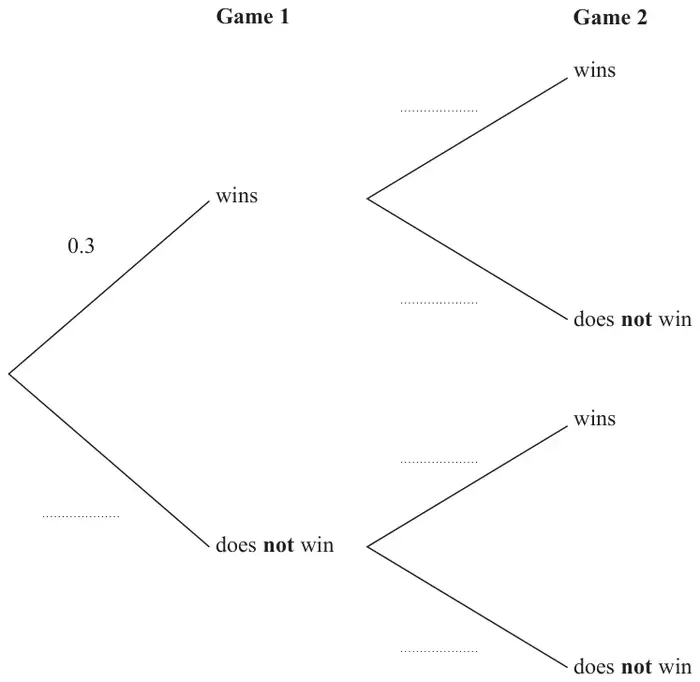
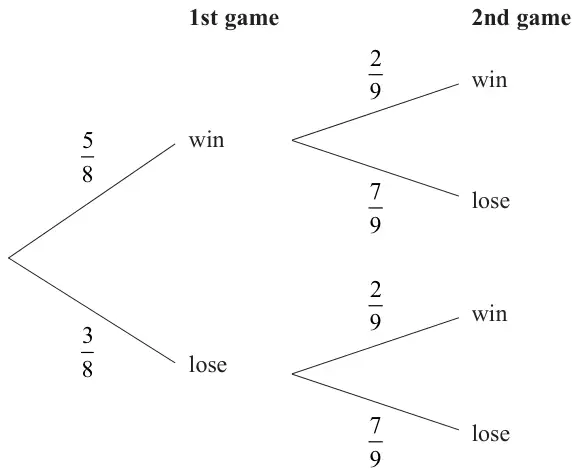
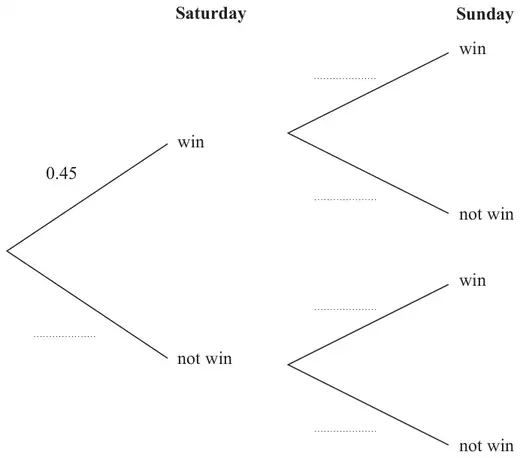
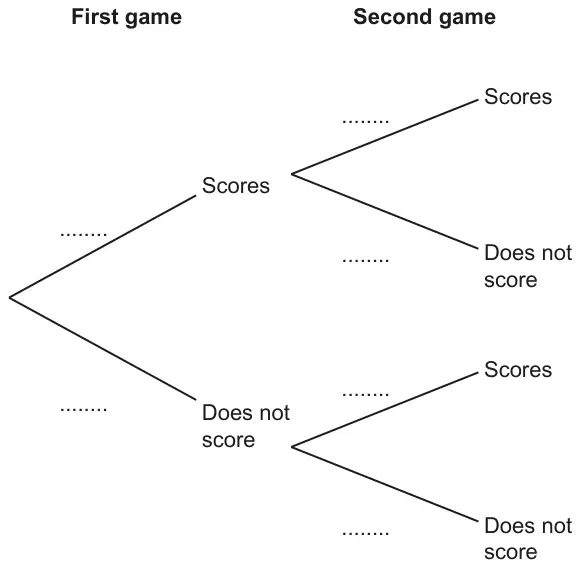
15 A darts team is going to play a match on Saturday and on Sunday. The probability that the team will win on Saturday is 0.45
If they win on Saturday, the probability that they will win on Sunday is 0.67 If they do not win on Saturday, the probability that they will win on Sunday is 0.35
(a) Complete the probability tree diagram.(2)
(b) Find the probability that the team will win exactly one of the two matches. (3)
Mark scheme (a)
Answer
Mark
Mark scheme
0.55, 0.67, 0.33, 0.35, 0.65
B1
for 0.55 in correct position
B1
for the branches for the second game correct
Additional guidance
Can be seen as fractions or percentages
Mark scheme (b)
Answer
Mark
Mark scheme
0.341
M1
for one correct product, eg \(0.45 \times \text{``}0.33\text{''}\) (=0.1485) or \(\text{``}0.55\text{''} \times \text{``}0.35\text{''}\) (=0.1925) or \(0.45 \times \text{``}0.67\text{''}\) (=0.3015) or \(\text{``}0.55\text{''} \times \text{``}0.65\text{''}\) (=0.3575)
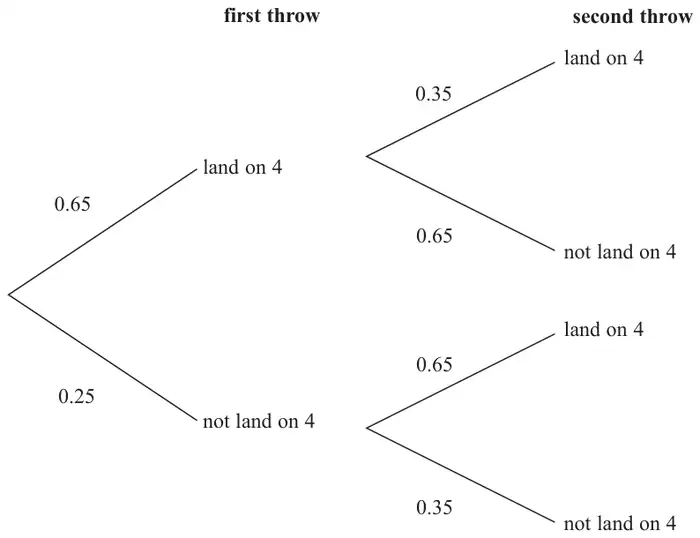
4 When a biased 6-sided dice is thrown once, the probability that it will land on 4 is 0.65 The biased dice is thrown twice.
Amir draws this probability tree diagram. The diagram is not correct.
Write down two things that are wrong with the probability tree diagram. (2)
Mark scheme
Answer
Mark
Mark scheme
Probabilities should sum to 1
C1
for stating that the probabilities should total 1 eg 0.25 should be 0.35
0.35 and 0.65 reversed
C1
for recognising that the 0.35 and 0.65 in the first branches for the 2nd throw should be reversed eg, “for the second throw, the probability it lands on 4 should be 0.65”
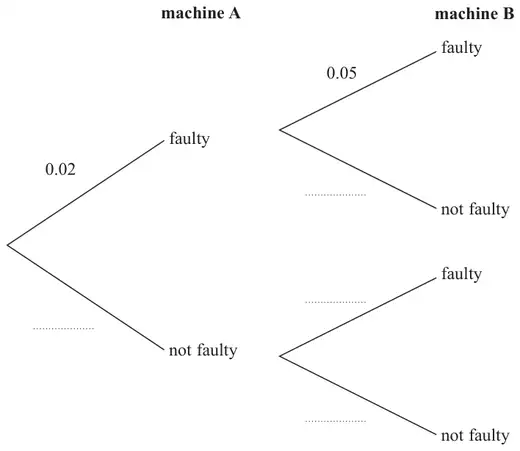
19 Machine A and machine B make bottles. The probability that a bottle made by machine A is faulty is 0.02 The probability that a bottle made by machine B is faulty is 0.05
(a) Complete the probability tree diagram.(2)
Shazia takes at random one bottle made by machine A and one bottle made by machine B.
(b) Work out the probability that at least one of these bottles is faulty. (3)
Mark scheme (a)
Answer
Mark
Notes
0.98 0.95, 0.05, 0.95
2
B1 for 0.98 oe for machine A B1 for 0.95, 0.05, 0.95 in correct positions for machine B
Mark scheme (b)
Answer
Mark
Notes
0.069
3
M1 for \(0.02 \times 0.05\) or \(0.02 \times \text{``}0.95\text{''}\) or \(\text{``}0.98\text{''} \times \text{``}0.05\text{''}\) or \(\text{``}0.98\text{''} \times \text{``}0.95\text{''}\) M1 for \(0.02 \times 0.05 + 0.02 \times \text{``}0.95\text{''} + \text{``}0.98\text{''} \times \text{``}0.05\text{''}\) or \(1 - \text{``}0.98\text{''} \times \text{``}0.95\text{''}\) A1 for 0.069 oe
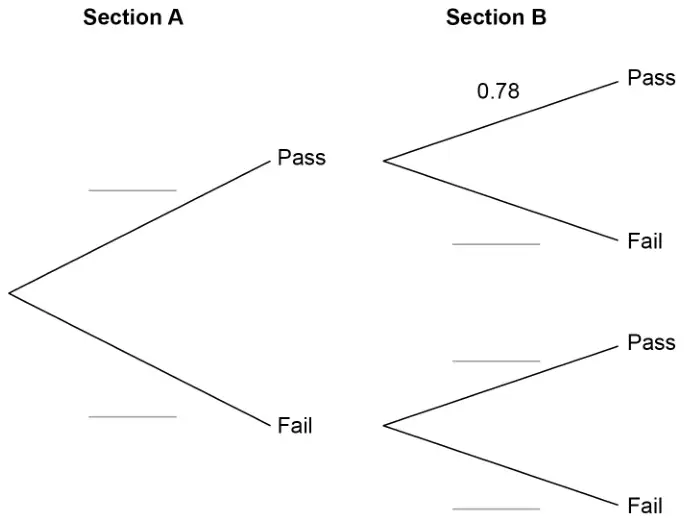
78% of people who pass section A also pass section B.
36% of people who fail section A also fail section B.
(a) Complete the tree diagram. [2 marks]
(b) 40% of people who fail at least one section take the test again.
5000 people take the test.
How many of these 5000 people are expected to take the test again? [4 marks]
Mark scheme (a)
Answer
Mark
Comments
0.85 (Pass) and 0.15 (Fail) for Section A
B1
oe fractions, decimals or percentages
0.22 (Fail) on top branch for Section B and 0.64 (Pass) and 0.36 (Fail) on bottom branches for Section B
B1
oe fractions, decimals or percentages
Mark scheme (b)
Answer
Mark
Comments
Alternative method 1
their \(0.85 \times\) their 0.78 or 0.663 or their \(0.85 \times\) their 0.22 or 0.187 or their \(0.15 \times\) their 0.64 or 0.096 or their \(0.15 \times\) their 0.36 or 0.054
M1
oe ft their tree diagram provided all probabilities are \(\gt 0\) and \(\lt 1\)
\(1 -\) their 0.663 or their \(0.187 +\) their \(0.096 +\) their 0.054 or their \(0.187 + 0.15\) or 0.337
M1dep
oe their 0.663, their 0.187, their 0.096 and their 0.054 must be from correct methods
their \(0.337 \times 0.4\) or 0.1348 or their \(0.337 \times 5000\) or 1685
M1dep
oe fraction, decimal or percentage dep on M2
674
A1ft
ft their tree diagram provided all probabilities are \(\gt 0\) and \(\lt 1\)
Alternative method 2
their \(0.85 \times\) their \(0.78 \times 5000\) or 3315 or their \(0.85 \times\) their \(0.22 \times 5000\) or 935 or their \(0.15 \times\) their \(0.64 \times 5000\) or 480 or their \(0.15 \times\) their \(0.36 \times 5000\) or 270 or their \(0.15 \times 5000\) or 750
M2
M1 their \(0.85 \times 5000\) or 4250
implied by 374
implied by 192
implied by 108
ft their tree diagram provided all probabilities are \(\gt 0\) and \(\lt 1\)
\(5000 -\) their 3315 or their \(935 +\) their \(480 +\) their 270 or their \(935 +\) their 750 or 1685 or 374 and 192 and 108
M1dep
dep on M2
674
A1ft
ft their tree diagram provided all probabilities are \(\gt 0\) and \(\lt 1\)
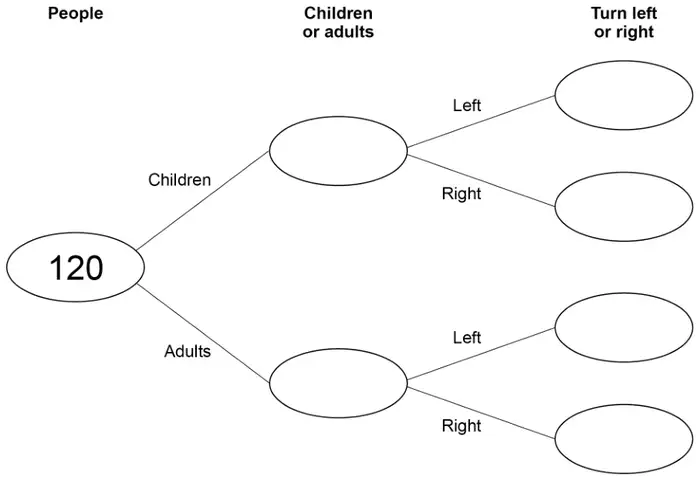
At the start of the maze you can turn left or right.
45 children turn left.
75 people in total turn left.
(a) Complete the frequency tree. [4 marks]
(b) What fraction of the children turn left?
Give your answer in its simplest form. [2 marks]
Mark scheme (a)
Answer
Mark
Comments
80 children and 40 adults
B1
45 left (children) and 35 right (children)
B1
30 left (adults)
B1ft
ft \(75 -\) their 45, where their 45 is an integer \(\geqslant 0\) and answer an integer \(\geqslant 0\)
10 right (adults)
B1ft
ft their \(40 -\) their 30, where both integers are \(\geqslant 0\) and answer an integer \(\geqslant 0\)
Additional guidance
Use of relative frequency or probability for an answer is B0 for that answer
Ignore working outside the frequency tree
Mark scheme (b)
Answer
Mark
Comments
\(\dfrac{9}{16}\)
B2ft
ft their 45 and/or ft their 80 B1ft \(\dfrac{\text{their } 45}{\text{their } 80}\) not fully simplified or correct simplification of their fraction, using numbers from their tree
Additional guidance
B2ft can only be awarded if their numbers can be simplified, otherwise B1ft
Do not ignore further work for B2 after correct answer seen \(\dfrac{9}{16} = \dfrac{3}{4}\)
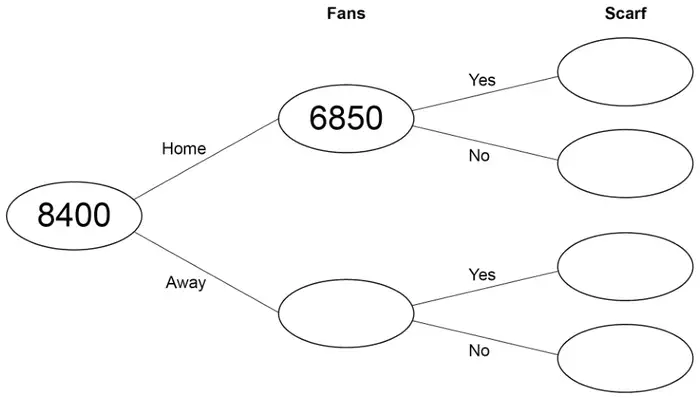
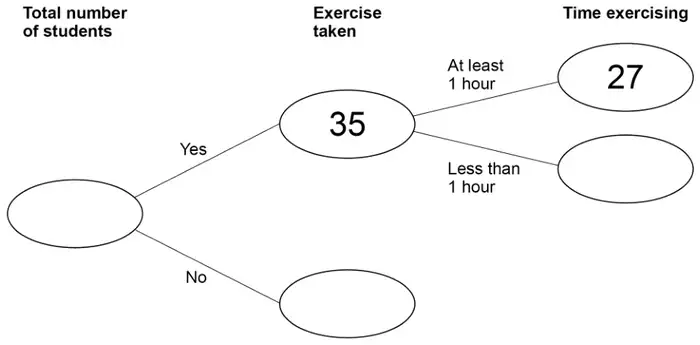
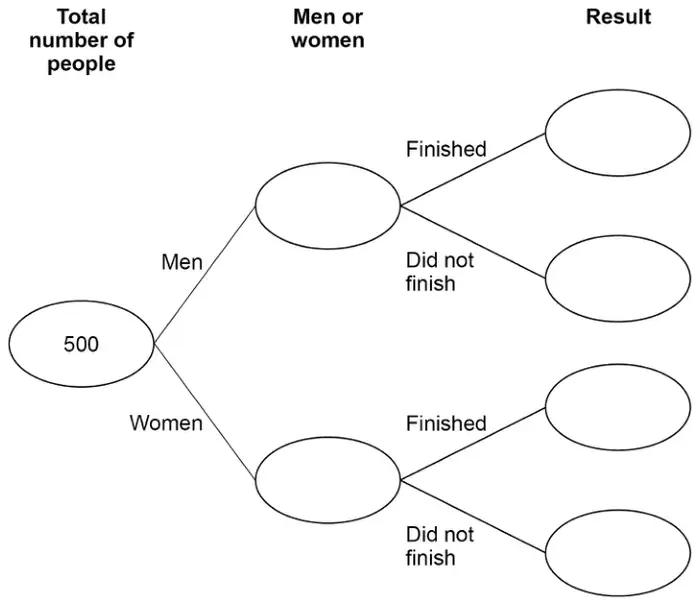
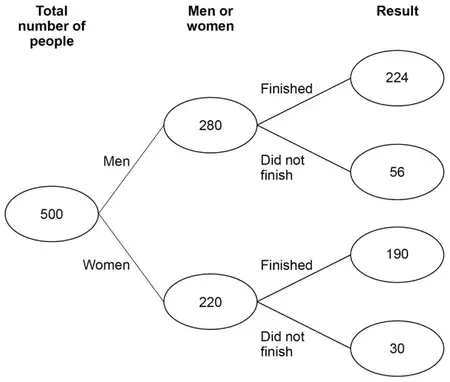
6850 of the fans support the Home team. The remaining fans support the Away team. 20% of the Home fans wear a scarf. 2319 of all the fans wear a scarf.
Complete the frequency tree. [5 marks]
Mark scheme
Answer
Mark
Comments
1550 in Away
B1
1370 in Home Yes
B1
5480 in Home No
B1ft
ft 6850 − their 1370 their 1370 must be less than 6850
949 in Away Yes
B1ft
ft 2319 − their 1370 their 1370 must be less than 2319
601 in Away No
B1ft
ft their 1550 − their 949 their 1550 must be greater than their 949
Additional guidance
If Away oval is blank then condone an indication of 1550 as Away
If Home Yes oval is blank then condone an indication of 1370 as Home Yes
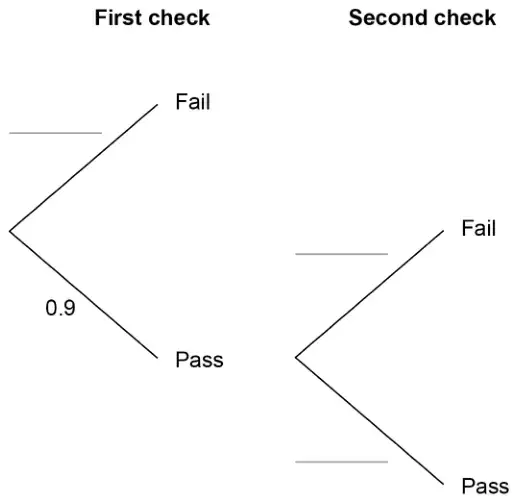
20 There should be a train leaving a station every hour from 7 am
No trains leave early.
P(the first train leaves on time) = 0.9
For all the other trains,
if the previous train did leave on time, P(this train leaves on time) = 0.8 if the previous train did not leave on time, P(this train leaves on time) = 0.65
(a) Work out \(\quad\) P(the first three trains leave on time) [2 marks]
(b) The 2 pm train does not leave on time.
Work out \(\quad\) P(exactly one of the next two trains does not leave on time) [3 marks]
Mark scheme (a)
Answer
Mark
Comments
\(0.9 \times 0.8^2\) or \(0.9 \times 0.64\)
M1
oe
0.576 or 0.58 or \(\dfrac{72}{125}\)
A1
oe fraction decimal or percentage
Additional guidance
Ignore any attempt to convert a correct answer
M1A1
Mark scheme (b)
Answer
Mark
Comments
Alternative method 1
(late, on time =) \((1 - 0.65) \times 0.65\) or \(0.35 \times 0.65\) or 0.2275 or (on time, late =) \(0.65 \times (1 - 0.8)\) or \(0.65 \times 0.2\) or 0.13
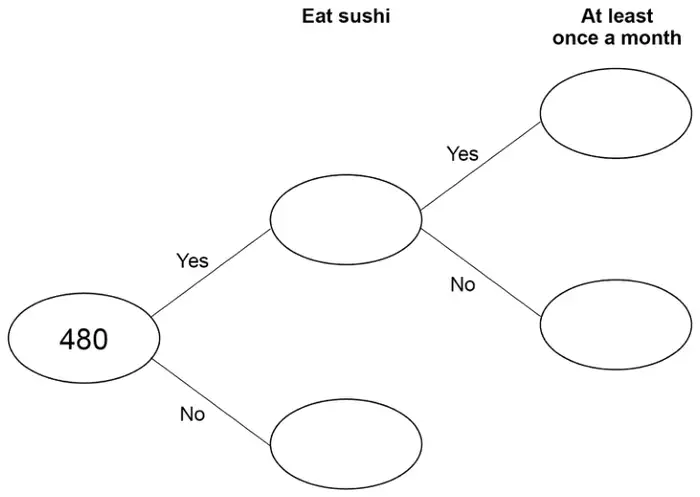
20% say Yes. \(\dfrac{2}{3}\) of the people who say Yes eat sushi at least once a month.
Complete the frequency tree. [4 marks]
Mark scheme
Answer
Mark
Comments
96 in Eat sushi Yes
B1
384 in Eat sushi No
B1ft
ft \(480 -\) their 96 if giving a value \(\gt 0\)
64 in At least once a month Yes
B1ft
ft their \(96 \div 3 \times 2\) truncated to the nearest integer or rounded up to the nearest integer
32 in At least once a month No
B1ft
ft their \(96 -\) their 64 if giving a value \(\gt 0\) or their \(96 \div 3\) truncated to the nearest integer or rounded up to the nearest integer
Additional guidance
Mark the four given diagram ovals only
240 240 160 80
B0B1ft B1ftB1ft
Follow through values may be rounded up or down to whole numbers provided the total is correct eg 80 400 53 27 (53 is \(\tfrac{2}{3}\) of 80 rounded down)
B0B1ft B1ftB1ft
Follow through decimal values, withhold first B1, if applicable, at first use of decimal eg1 105.6 374.4 70.4 35.2 (105.6 is incorrect and first use of decimal) eg2 80 400 53.3 26.7 (53.3 is correct ft and first use of decimal) eg3 96 384 63.36 32.64 (63.36 is incorrect and first use of decimal)
B0B1ft B1ftB1ft B0B1ft B0ftB1ft B1B1 B0B1ft
Correct or ft relative frequencies shown out of 480 seen in appropriate places, withhold first B1 that would have been awarded eg1 \(\dfrac{96}{480} \;\; \dfrac{384}{480} \;\; \dfrac{64}{480} \;\; \dfrac{32}{480}\) eg2 \(\dfrac{45}{480} \;\; \dfrac{435}{480} \;\; \dfrac{30}{480} \;\; \dfrac{15}{480}\) eg3 \(\dfrac{90}{480} \;\; \dfrac{390}{480} \;\; \dfrac{30}{480} \;\; \dfrac{60}{480}\)
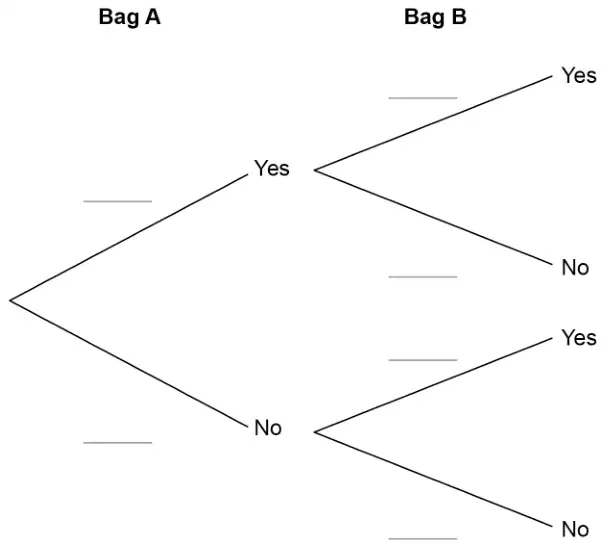
The table shows the number of each type of card in the bags.
Yes
No
Bag A
3
2
Bag B
1
9
In the game, a player picks one card at random from each bag.
The cards are then put back into the bags.
(a) Complete the tree diagram. [2 marks]
(b) To win a prize, a player must pick two cards marked Yes.
450 people each play the game once.
How many people are expected to win a prize? [3 marks]
Mark scheme (a)
Answer
Mark
Comments
Yes \(\dfrac{3}{5}\) and No \(\dfrac{2}{5}\) for Bag A
B1
oe fraction, decimal or percentage
Yes \(\dfrac{1}{10}\) and No \(\dfrac{9}{10}\) for both pairs of branches on Bag B
B1
oe fraction, decimal or percentage
Mark scheme (b)
Answer
Mark
Comments
their \(\dfrac{3}{5}\) \(\times\) their \(\dfrac{1}{10}\) or \(\dfrac{3}{50}\)
M1
oe may be on tree diagram ft their tree diagram if their \(\dfrac{3}{5}\) and their \(\dfrac{1}{10}\) are \(\gt 0\) and \(\lt 1\)
their \(\dfrac{3}{5}\) \(\times\) their \(\dfrac{1}{10}\) \(\times\) 450 or \(\dfrac{3}{50}\) \(\times\) 450
M1dep
oe their \(\dfrac{3}{50}\) must be \(\gt 0\) and \(\lt 1\)
27
A1ft
ft their tree diagram if their \(\dfrac{3}{5}\) and their \(\dfrac{1}{10}\) are \(\gt 0\) and \(\lt 1\)
Additional guidance
For the first mark, accept the correct probability shown on the tree diagram and ignore other probabilities
For the first mark, do not allow \(\dfrac{3}{5} \times \dfrac{1}{10}\) seen as part of a longer multiplication string of probabilities eg \(\dfrac{3}{5} \times \dfrac{1}{10} \times \dfrac{9}{10}\)
M0
Check tree diagram for working
\(\dfrac{27}{450}\) implies
M1M1A0
Students with incorrect probabilities on the tree diagram can score marks for follow through in part (b) or from the correct probabilities recovered eg probabilities of \(\dfrac{3}{4}\) and \(\dfrac{9}{10}\) on the top row of the tree diagram but an answer of 27 in part (b)
B0B0 in (a) M1M1A1 in (b)
Allow follow through from values rather than probabilities on the branches, with denominator 5 for Bag A and 10 for Bag B eg from 2 on Bag A and 9 on Bag B allow \(\dfrac{2}{5} \times \dfrac{9}{10} \times 450 = 162\)
M1M1A1ft
For A1ft allow a correct decimal answer or the answer truncated or rounded up to the nearest integer eg from \(\dfrac{3}{4}\) and \(\dfrac{1}{10}\) leading to \(\dfrac{3}{40} \times 450\) accept 33 or 33.75 or 34
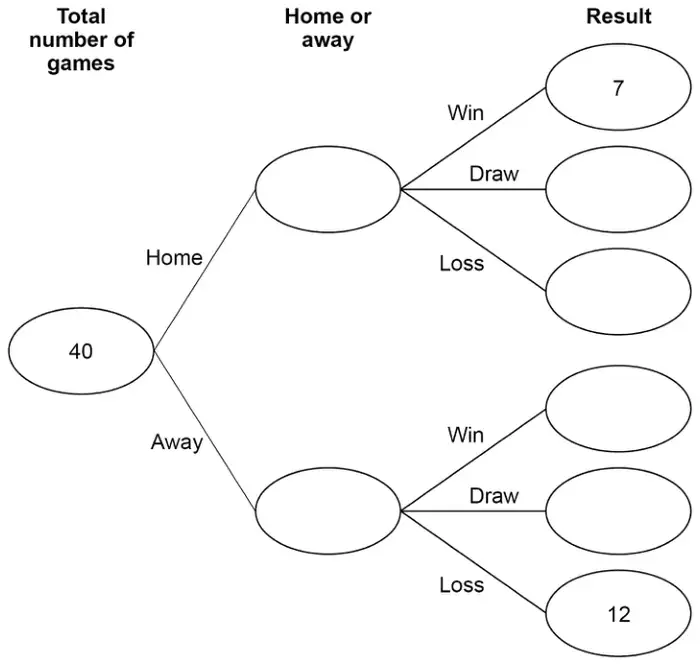
6 points for a win 3 points for a draw 0 points for a loss.
Work out the total number of points that the team got. [2 marks]
Mark scheme (a)
Answer
Mark
Comments
20 home and 20 away
B1
8 home losses
B1ft
ft their \(20 \times \dfrac{2}{5}\) rounded to the nearest whole number
2 away wins
B1ft
ft their \(20 \times \dfrac{1}{10}\) rounded to the nearest whole number
5 home draws and 6 away draws
B1ft
ft their 8 and their 2 condone their 8 and their 2 as zero or non-integers award if total of home games is their 20 and total of away games is their 20 and total number of games is 40
Additional guidance
Mark the cells in the frequency tree
Mark scheme (b)
Answer
Mark
Comments
Any two of (home wins =) \(7 \times 6\) or 42 or (home draws =) their \(5 \times 3\) or 15 or (away wins =) their \(2 \times 6\) or 12 or (away draws =) their \(6 \times 3\) or 18
M1
may be implied by one of (total points for their wins) 54 or (total points for their draws) 33 or (total points for their home) 57 or (total points for their away) 30
87
A1ft
ft their frequency tree with positive integers in all relevant sections
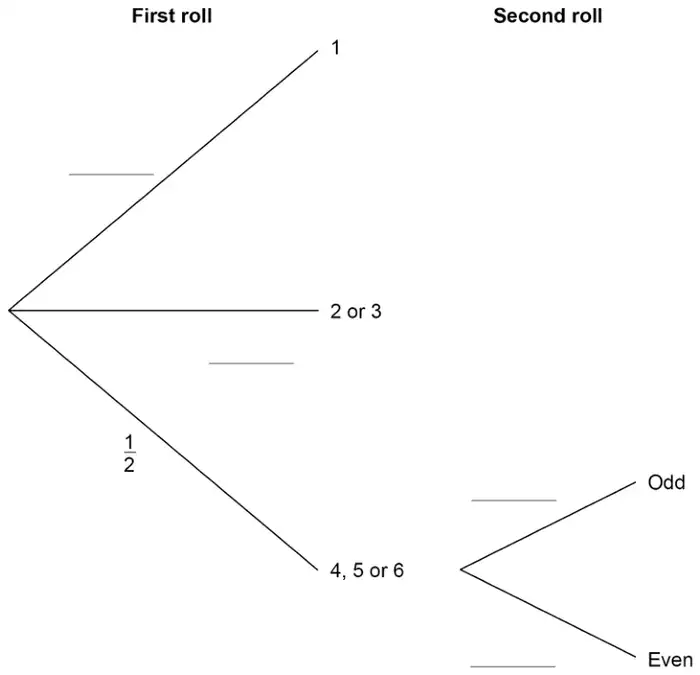
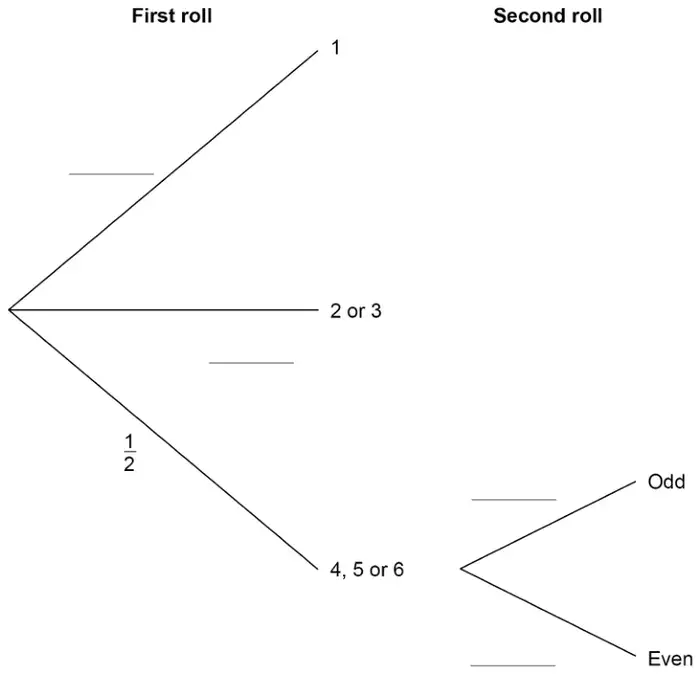
If she rolls 1 she wins. If she rolls 2 or 3 she loses. If she rolls 4, 5 or 6 she rolls again.
When she has to roll again,
if she rolls an odd number she wins if she rolls an even number she loses.
(a) Complete the tree diagram with the four missing probabilities. [2 marks]
(b) Is Anna more likely to win or to lose?
You must work out the probability that she wins. [4 marks]
Mark scheme (a)
Answer
Mark
Comments
\(\dfrac{1}{6}\) on ‘1’ and \(\dfrac{1}{3}\) or \(\dfrac{2}{6}\) on ‘2 or 3’ and \(\dfrac{1}{2}\) on each of ‘Odd’ and ‘Even’
B2
oe fraction, decimal or percentage B1 \(\dfrac{1}{6}\) on ‘1’ and \(\dfrac{1}{3}\) or \(\dfrac{2}{6}\) on ‘2 or 3’ or \(\dfrac{1}{2}\) on each of ‘Odd’ and ‘Even’ or all correct unsimplified probabilities with one or more simplification errors eg \(\dfrac{3}{6}\) on ‘Odd’ simplified to \(\dfrac{1}{3}\)
Additional guidance
Accept decimals or percentages rounded or truncated correctly to at least 2 significant figures
Only withhold a mark for simplification errors if B2 would otherwise be awarded
Ignore extra branches added
Ignore attempts to work out combined probabilities to the right of the tree diagram
If an answer line is blank, the student may have written their answer elsewhere on the branch
Mark scheme (b)
Answer
Mark
Comments
Alternative method 1: P(1) + P(4, 5 or 6) × P(Odd)
\(\dfrac{1}{2} \times\) their \(\dfrac{1}{2}\) or \(\dfrac{1}{4}\)
M1
oe
their \(\dfrac{1}{4} +\) their \(\dfrac{1}{6}\)
M1dep
oe
(P(win) =) \(\dfrac{10}{24}\) or \(\dfrac{5}{12}\)
A1ft
oe ft their tree diagram
Lose (and P(Lose) = \(\dfrac{14}{24}\) or \(\dfrac{7}{12}\) oe)
A1ft
ft correct decision for their \(\dfrac{5}{12}\) (and their \(\dfrac{7}{12}\)) with M2 scored
Alternative method 2: 1 – P(2 or 3) – P(4, 5 or 6) × P(Even)
\(\dfrac{1}{2} \times\) their \(\dfrac{1}{2}\) or \(\dfrac{1}{4}\)
M1
oe
their \(\dfrac{1}{4} +\) their \(\dfrac{1}{3}\) or P(lose) \(= \dfrac{7}{12}\)
M1dep
oe ft their tree diagram
(P(win) =) \(\dfrac{10}{24}\) or \(\dfrac{5}{12}\)
A1ft
oe ft their tree diagram
Lose (and P(Lose) = \(\dfrac{14}{24}\) or \(\dfrac{7}{12}\) oe)
A1ft
ft correct decision for their \(\dfrac{5}{12}\) (and their \(\dfrac{7}{12}\)) with M2 scored
Additional guidance
Check the tree diagram for working
Any ‘their’ or ft probability must be > 0 and < 1 for marks to be awarded
For the second A1ft, the ft can be from an incorrect tree (which may score 4 marks) or an arithmetic error (which scores 3 marks, M1M1A0A1ft)
Accept equivalent fractions or decimals within calculations and equivalent fractions, decimals or percentages for final probabilities
Accept decimals or percentages rounded or truncated correctly to at least 2 significant figures
Condone \(\dfrac{1}{2} \times\) their \(\dfrac{1}{2}\) as part of a longer, incorrect multiplication eg \(\dfrac{1}{2} \times \dfrac{1}{2} \times \dfrac{1}{6}\)
M1M0A0A0
Condone decimals used within fractions eg P(Win) \(= \dfrac{2.5}{6}\)
at least M1M1A1
For the method marks, condone incorrect mathematical notation eg \(\dfrac{1}{2} \times \dfrac{1}{2} = \dfrac{1}{4} + \dfrac{1}{6} = \ldots\)
at least M1M1 (may go on to score 3 or 4 marks)
For the second A1ft, if the student gives a value for P(Lose), their P(Win) + their P(Lose) must equal 1 However, allow a comparison to \(\dfrac{1}{2}\) unless it is clearly an incorrect value for P(Lose)
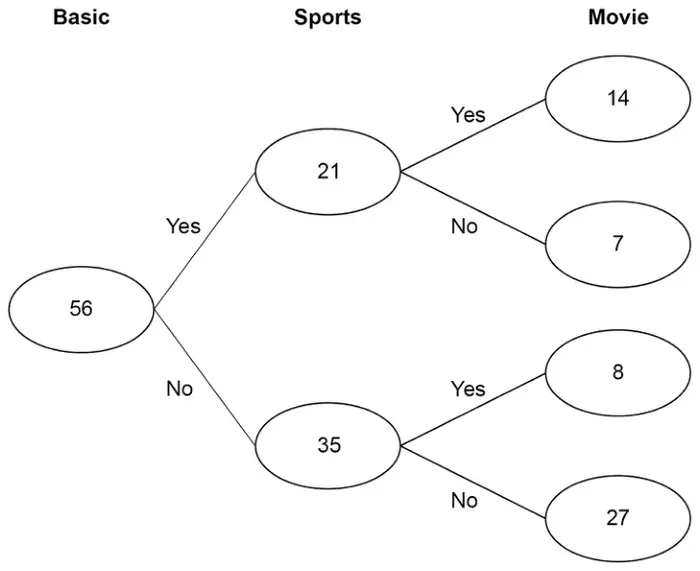
They all have the Basic package for £24.50 per month.
Some also have
the Sports package for £27.50 extra per month the Movie package for £18 extra per month.
The frequency tree shows the number of customers with each package.
In total, how much per month do the 56 customers pay? [4 marks]
Mark scheme
Answer
Mark
Comments
Alternative method 1
\(56 \times 24.5\) or 1372 or \(21 \times 27.5\) or 577.5 or \((14 + 8) \times 18\) or \(22 \times 18\) or \(14 \times 18 + 8 \times 18\) or \(252 + 144\) or 396
M1
amount for basic or amount for sports or amount for movies
oe
Any two of \(56 \times 24.5\) or 1372 or \(21 \times 27.5\) or 577.5 or \((14 + 8) \times 18\) or \(22 \times 18\) or \(14 \times 18 + 8 \times 18\) or \(252 + 144\) or 396
M1dep
any two of the above implies M2
\(56 \times 24.5\) \(+\) \(21 \times 27.5\) \(+\) \((14 + 8) \times 18\) or \(22 \times 18\) or \(14 \times 18 + 8 \times 18\) or \(252 + 144\) or \(1372 + 577.5 + 396\) or 2345.5
M1dep
full method that would lead to 2345.5 if evaluated correctly implies M3
2345.50
A1
Alternative method 2
\(14 \times (24.5 + 27.5 + 18)\) or \(14 \times 70\) or 980 or \(7 \times (24.5 + 27.5)\) or \(7 \times 52\) or 364 or \(8 \times (24.5 + 18)\) or \(8 \times 42.5\) or 340 or \(27 \times 24.5\) or 661.5
M1
amount for all 3 packages or amount for basic + sports or amount for basic + movies or amount for basic only
Any two of \(14 \times (24.5 + 27.5 + 18)\) or \(14 \times 70\) or 980 or \(7 \times (24.5 + 27.5)\) or \(7 \times 52\) or 364 or \(8 \times (24.5 + 18)\) or \(8 \times 42.5\) or 340 or \(27 \times 24.5\) or 661.5
M1dep
any two of the above implies M2
\(14 \times (24.5 + 27.5 + 18)\) or \(14 \times 70\) \(+\) \(7 \times (24.5 + 27.5)\) or \(7 \times 52\) \(+\) \(8 \times (24.5 + 18)\) or \(8 \times 42.5\) \(+\) \(27 \times 24.5\) or \(980 + 364 + 340 + 661.5\) or 2345.5
M1dep
full method that would lead to 2345.5 if evaluated correctly implies M3
2345.50
A1
Alternative method 3
\(56 \times (24.5 + 27.5 + 18)\) or \(56 \times 70\) or 3920 or \(35 \times 27.5\) or 962.5 or \((27 + 7) \times 18\) or \(34 \times 18\) or \(27 \times 18 + 7 \times 18\) or \(486 + 126\) or 612
M1
amount if everyone has all 3 packages or amount for not having sports or amount for not having movies
Any two of \(56 \times (24.5 + 27.5 + 18)\) or \(56 \times 70\) or 3920 or \(35 \times 27.5\) or 962.5 or \((27 + 7) \times 18\) or \(34 \times 18\) or \(27 \times 18 + 7 \times 18\) or \(486 + 126\) or 612
M1dep
any two of the above implies M2
\(56 \times (24.5 + 27.5 + 18)\) or \(56 \times 70\) or 3920 \(-\) \(35 \times 27.5\) or 962.5 \(-\) \((27 + 7) \times 18\) or \(34 \times 18\) or \(27 \times 18 + 7 \times 18\) or \(486 + 126\) or 612 or \(3920 - 962.5 - 612\) or 2345.5
M1dep
full method that would lead to 2345.5 if evaluated correctly implies M3
2345.50
A1
Additional guidance
2345.50(p)
M1M1M1A1
2345.5
M1M1M1A0
Working may be seen on the diagram
Allow all decimal values to be seen as equivalent fractions eg \(\dfrac{1155}{2}\) for 577.5 for the M marks
A ‘correct’ calculation does not have to be evaluated correctly
Division or multiplication by 12 or division by 56 at the end will only lose the A mark eg \(2345.50 \div 56 = 41.88\) per person
M1M1M1A0
For the first two marks use the scheme that awards the most credit and do not apply the rules of choice
If she rolls 1 she wins. If she rolls 2 or 3 she loses. If she rolls 4, 5 or 6 she rolls again.
When she has to roll again,
if she rolls an odd number she wins if she rolls an even number she loses.
(a) Complete the tree diagram with the four missing probabilities. [2 marks]
(b) Is Anna more likely to win or to lose?
You must work out the probability that she wins. [4 marks]
Mark scheme (a)
Answer
Mark
Comments
\(\dfrac{1}{6}\) on ‘1’ and \(\dfrac{1}{3}\) or \(\dfrac{2}{6}\) on ‘2 or 3’ and \(\dfrac{1}{2}\) on each of ‘Odd’ and ‘Even’
B2
oe fraction, decimal or percentage B1 \(\dfrac{1}{6}\) on ‘1’ and \(\dfrac{1}{3}\) or \(\dfrac{2}{6}\) on ‘2 or 3’ or \(\dfrac{1}{2}\) on each of ‘Odd’ and ‘Even’ or all correct unsimplified probabilities with one or more simplification errors eg \(\dfrac{3}{6}\) on ‘Odd’ simplified to \(\dfrac{1}{3}\)
Additional guidance
Accept decimals or percentages rounded or truncated correctly to at least 2 significant figures
Only withhold a mark for simplification errors if B2 would otherwise be awarded
Ignore extra branches added
Ignore attempts to work out combined probabilities to the right of the tree diagram
If an answer line is blank, the student may have written their answer elsewhere on the branch
Mark scheme (b)
Answer
Mark
Comments
Alternative method 1: P(1) + P(4, 5 or 6) × P(Odd)
\(\dfrac{1}{2}\) \(\times\) their \(\dfrac{1}{2}\) or \(\dfrac{1}{4}\)
M1
oe
their \(\dfrac{1}{4}\) + their \(\dfrac{1}{6}\)
M1dep
oe
(P(win) =) \(\dfrac{10}{24}\) or \(\dfrac{5}{12}\)
A1ft
oe ft their tree diagram
Lose (and P(Lose) = \(\dfrac{14}{24}\) or \(\dfrac{7}{12}\) oe)
A1ft
ft correct decision for their \(\dfrac{5}{12}\) (and their \(\dfrac{7}{12}\)) with M2 scored
Alternative method 2: 1 – P(2 or 3) – P(4, 5 or 6) × P(Even)
\(\dfrac{1}{2}\) \(\times\) their \(\dfrac{1}{2}\) or \(\dfrac{1}{4}\)
M1
oe
their \(\dfrac{1}{4}\) + their \(\dfrac{1}{3}\) or P(lose) = \(\dfrac{7}{12}\)
M1dep
oe ft their tree diagram
(P(win) =) \(\dfrac{10}{24}\) or \(\dfrac{5}{12}\)
A1ft
oe ft their tree diagram
Lose (and P(Lose) = \(\dfrac{14}{24}\) or \(\dfrac{7}{12}\) oe)
A1ft
ft correct decision for their \(\dfrac{5}{12}\) (and their \(\dfrac{7}{12}\)) with M2 scored
Additional guidance
Check the tree diagram for working
Any ‘their’ or ft probability must be \(> 0\) and \(< 1\) for marks to be awarded
For the second A1ft, the ft can be from an incorrect tree (which may score 4 marks) or an arithmetic error (which scores 3 marks, M1M1A0A1ft)
Accept equivalent fractions or decimals within calculations and equivalent fractions, decimals or percentages for final probabilities
Accept decimals or percentages rounded or truncated correctly to at least 2 significant figures
Condone \(\dfrac{1}{2}\) \(\times\) their \(\dfrac{1}{2}\) as part of a longer, incorrect multiplication eg \(\dfrac{1}{2} \times \dfrac{1}{2} \times \dfrac{1}{6}\)
M1M0A0A0
Condone decimals used within fractions eg P(Win) \(= \dfrac{2.5}{6}\)
at least M1M1A1
For the method marks, condone incorrect mathematical notation eg \(\dfrac{1}{2} \times \dfrac{1}{2} = \dfrac{1}{4} + \dfrac{1}{6} = \ldots\)
at least M1M1 (may go on to score 3 or 4 marks)
For the second A1ft, if the student gives a value for P(Lose), their P(Win) + their P(Lose) must equal 1 However, allow a comparison to \(\dfrac{1}{2}\) unless it is clearly an incorrect value for P(Lose)
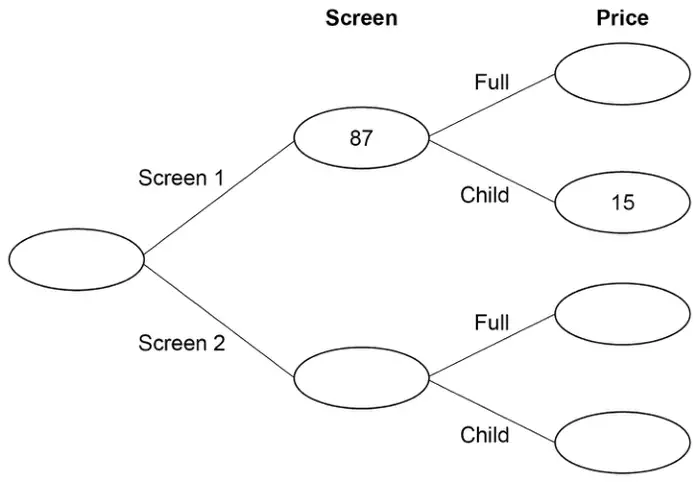
8 At a cinema, films are shown on Screen 1 and Screen 2
Customers pay full price or child price.
There are three times as many customers in Screen 2 as Screen 1 68 customers paid child price.
Complete the frequency tree. [5 marks]
Mark scheme
Answer
Mark
Comments
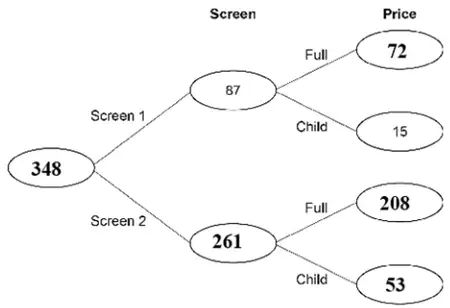
Total for Screen 2 is 261
B1
Total is 348
B1ft
ft 87 + their 261
Full price for Screen 1 is 72
B1
Child price for Screen 2 is 53
B1
Full price for Screen 2 is 208
B1ft
ft if their full price value for Screen 2 and their child price value for Screen 2 sum to their total for Screen 2 or their two full price values and their two child price values sum to their overall total
Additional guidance
Mark the diagram, but if diagram completely blank, accept answers in working only if absolutely clear which entry is being referenced
Example of final B1ft: Screen 2 Child Price recorded as 68, leads to 193 as Screen 2 full price
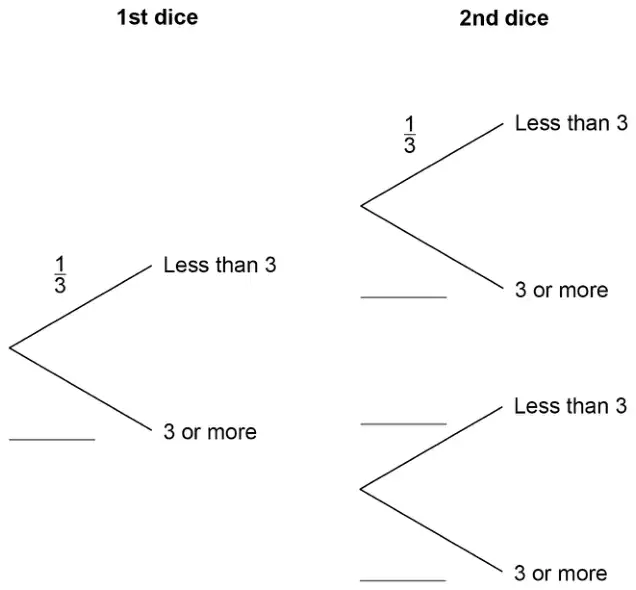
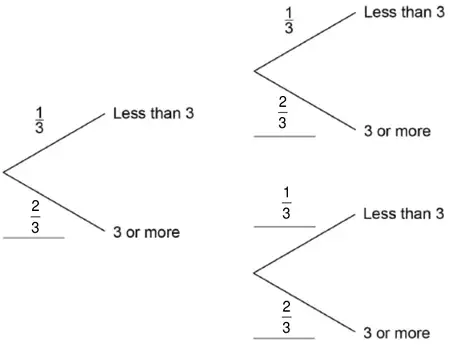
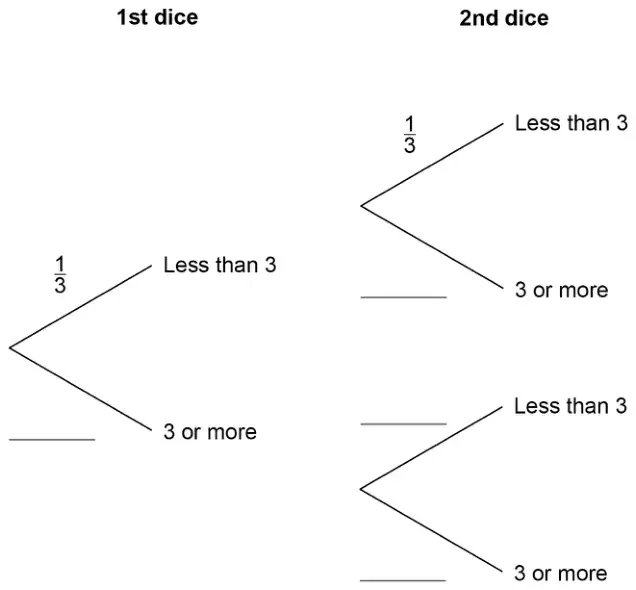
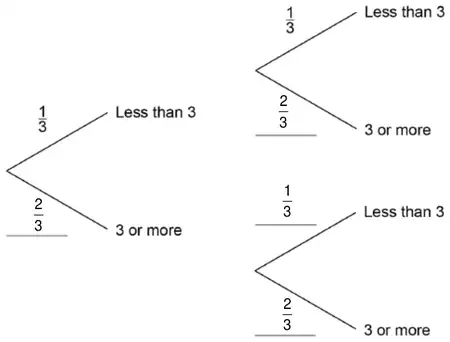
(b) Work out the probability that both dice land on a number less than 3 [1 mark]
Mark scheme (a)
Answer
Mark
Comments
\(\dfrac{1}{3}\) or \(\dfrac{2}{6}\) or 0.33… or 33.(…)% on each top branch and \(\dfrac{2}{3}\) or \(\dfrac{4}{6}\) or 0.66… or 0.67 or 66.(…)% or 67% on each bottom branch
B1
accept any equivalent fraction, decimal or percentage
Additional guidance
Decimals must have at least 2 decimal places so do not accept 0.3 or 0.6 or 0.7
Only accept the percentages shown, do not accept 30% or 60%
Ignore working around the edge of the diagram
B1
Mark scheme (b)
Answer
Mark
Comments
\(\dfrac{1}{9}\) or 0.11… or 11.(…)%
B1
Additional guidance
Ignore probability words such as ‘unlikely’ or ‘evens’
(b) Work out the probability that both dice land on a number less than 3 [1 mark]
(c) Work out the probability that exactly one of the dice lands on a number less than 3 [2 marks]
Mark scheme (a)
Answer
Mark
Comments
\(\dfrac{1}{3}\) or \(\dfrac{2}{6}\) or 0.33… or 33.(…)% on each top branch and \(\dfrac{2}{3}\) or \(\dfrac{4}{6}\) or 0.66… or 0.67 or 66.(…)% or 67% on each bottom branch
B1
accept any equivalent fraction, decimal or percentage
Additional guidance
Decimals must have at least 2 decimal places so do not accept 0.3 or 0.6 or 0.7
Only accept the percentages shown, do not accept 30% or 60%
Ignore working around the edge of the diagram
B1
Mark scheme (b)
Answer
Mark
Comments
\(\dfrac{1}{9}\) or 0.11… or 11.(…)%
B1
Additional guidance
Ignore probability words such as ‘unlikely’ or ‘evens’
oe accept 0.33… for \(\dfrac{1}{3}\) accept 0.66… or 0.67 for \(\dfrac{2}{3}\)
\(\dfrac{4}{9}\) or 0.44… or 44.(…)%
A1
Alternative method 3 Probabilities on branches in (a) not all correct
\(\dfrac{1}{3} \times\) their \(\dfrac{2}{3}\) where their \(\dfrac{2}{3}\) must be for 2nd dice 3 or more or their \(\dfrac{2}{3} \times\) their \(\dfrac{1}{3}\) where their \(\dfrac{2}{3}\) must be for 1st dice 3 or more and their \(\dfrac{1}{3}\) must be for 2nd dice less than 3
M1
oe accept 0.33… for \(\dfrac{1}{3}\) accept 0.66… or 0.67 for \(\dfrac{2}{3}\) their fractions must be between 0 and 1
\(\dfrac{4}{9}\) or 0.44… or 44.(…)%
A1ft
ft their fractions
Alternative method 4 Probabilities on branches in (a) not all correct
\(1 - \left(\dfrac{1}{3} \times \dfrac{1}{3}\right) - \left(\text{their } \dfrac{2}{3} \times \text{their } \dfrac{2}{3}\right)\) where their \(\dfrac{2}{3}\) must be for 1st dice 3 or more and their \(\dfrac{2}{3}\) must be for 2nd dice 3 or more
M1
accept 0.33… for \(\dfrac{1}{3}\) accept 0.66… or 0.67 for \(\dfrac{2}{3}\) their fractions must be between 0 and 1
\(\dfrac{4}{9}\) or 0.44… or 44.(…)%
A1ft
ft their fractions
Additional guidance
If probabilities on branches in (a) are all \(\dfrac{1}{3}\)
M0A0
Decimals must have at least 2 decimal places so do not accept 0.3 or 0.6 or 0.7
Ignore any incorrect cancelling or change of form (fraction, decimal or percentage)
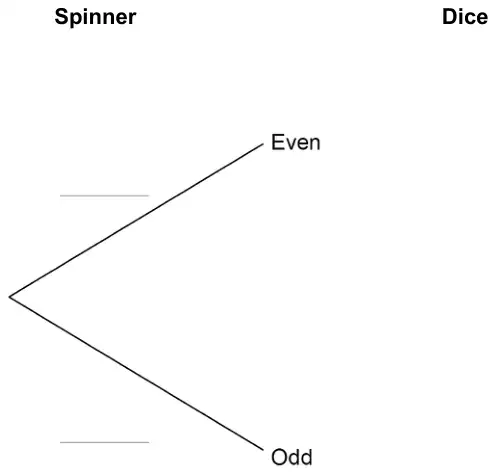
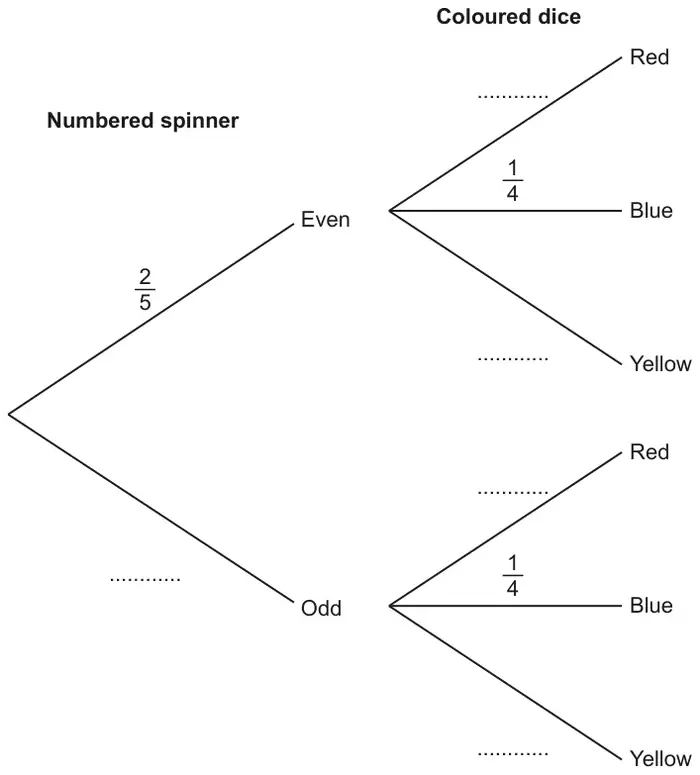
16 A fair spinner has five equal sections numbered 1, 2, 3, 4 and 5
A fair six-sided dice has five red faces and one green face.
The spinner is spun.
If the spinner shows an even number, the dice is thrown.
(a) Complete the tree diagram for the spinner and the dice. [2 marks]
(b) Work out the probability of getting an even number and the colour green. [2 marks]
Mark scheme (a)
Answer
Mark
Comments
\(\dfrac{2}{5}\) Even and \(\dfrac{3}{5}\) Odd
B1
oe fractions, decimals or percentages
Two branches from Even labelled Red \(\dfrac{5}{6}\) \(\qquad\) Green \(\dfrac{1}{6}\)
B1
oe fractions, decimals or percentages Branches from Odd is B0 Allow equivalent labelling eg R and G Green and Not Green
Additional guidance
In decimals, allow for \(\dfrac{5}{6}\) and \(\dfrac{1}{6}\) 0.83 and 0.17 or 0.833 and 0.167 or 0.834 and 0.166 or 0.84 and 0.16 or better truncation or rounding (sum of pair must equal 1) In percentages, allow for \(\dfrac{5}{6}\) and \(\dfrac{1}{6}\) 83% and 17% or 83.3% and 16.7% or 83.4% and 16.6% or 84% and 16% or better truncation or rounding (sum of pair must equal 100%)
Ignore any attempts to combine probabilities to the right of the tree diagram
Mark scheme (b)
Answer
Mark
Comments
their \(\dfrac{2}{5} \times\) their \(\dfrac{1}{6}\)
M1
their P(Even) \(\times\) their P(Green) ft from (a) if \(0 \lt\) both probabilities \(\lt 1\)
\(\dfrac{2}{30}\) or \(\dfrac{1}{15}\)
A1ft
oe fraction or decimal ft from (a) if \(0 \lt\) both probabilities \(\lt 1\)
Additional guidance
Allow 0.06 or 6% or better truncation or rounding or 0.07 or 7% for \(\dfrac{2}{30}\)
If the dice branches are not labelled there is no ft from (a)
If (a) has no attempt or an incorrect answer full marks can still be gained here for correct working (and answer)
Ignore further attempts to simplify or convert to a decimal or percentage after a correct fraction is seen eg \(\;\dfrac{2}{30} = \dfrac{1}{10}\) or \(\dfrac{4}{60} = 0.165\)
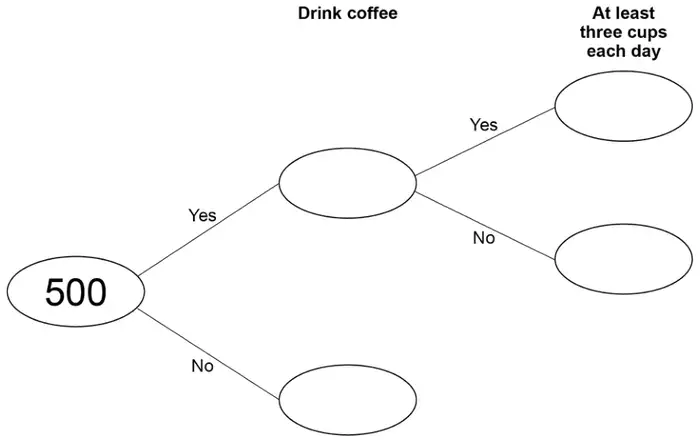
20% of the people who say Yes drink at least three cups each day.
(a) Complete the frequency tree. [4 marks]
(b) What fraction of the 500 people drink at least three cups of coffee each day?
Give your answer in its simplest form. [2 marks]
Mark scheme (a)
Answer
Mark
Comments
450 in Drink coffee Yes
B1
50 in Drink coffee No
B1ft
ft 500 \(-\) their 450
90 in At least three cups Yes
B1ft
ft their 450 \(\div\) 5
360 in At least three cups No
B1ft
ft their 450 \(-\) their 90
Additional guidance
for 90 ft, their 450 ÷ 5 must be truncated or rounded up to the nearest whole number
for 360 ft, their 450 \(-\) their 90 must give a positive integer
Accept unambiguous values elsewhere but diagram values take precedence
Correct relative frequencies seen, withhold first B1 that would have been awarded. eg \(\dfrac{400}{500}, \dfrac{100}{500}, \dfrac{80}{400}, \dfrac{320}{400}\) eg \(\dfrac{400}{500}, \dfrac{100}{500}, \dfrac{80}{500}, \dfrac{320}{500}\)
B0 B0ft B1ft B1ft B0 B0ft B0ft B0ft
Do not accept probabilities eg \(\dfrac{9}{10}, \dfrac{1}{10}, \dfrac{4}{5}, \dfrac{1}{5}\) eg 0.9, 0.1, 0.8, 0.2
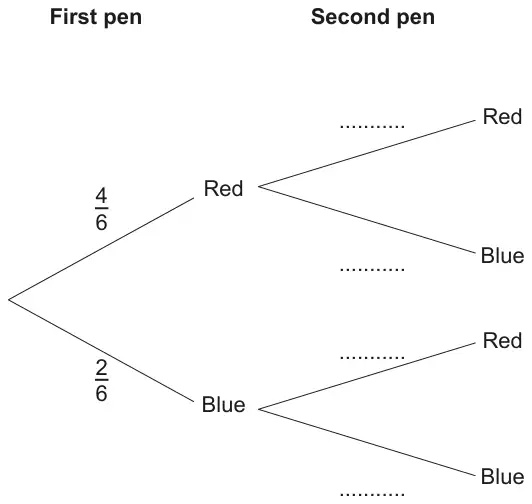
15 A packet of 6 pens contains 4 red pens and 2 blue pens.
A pen is taken at random from the packet and is not replaced. A second pen is then taken at random from the packet.
(a) Complete the tree diagram. [2]
(b) Find the probability of taking two pens of the same colour. [3]
Mark scheme (a)
Answer
Marks
Part marks and guidance
\(\frac{3}{5}\) and \(\frac{2}{5}\) oe correct on top branch
1
\(\frac{4}{5}\) and \(\frac{1}{5}\) oe correct on second branch
1
Mark scheme (b)
Answer
Marks
Part marks and guidance
\(\frac{7}{15}\) oe or 0.466 to 0.467
3
M2FT for \(\left(\frac{4}{6} \times \frac{3}{5}\right) + \left(\frac{2}{6} \times \frac{1}{5}\right)\) oe or better
or
M1FT for \(\left(\frac{4}{6} \times \frac{3}{5}\right)\) oe or \(\left(\frac{2}{6} \times \frac{1}{5}\right)\) oe may be implied by \(\frac{12}{30}\) oe or by \(\frac{2}{30}\) oe
FT their probabilities from (a) Working may be seen next to diagram If answers to products seen, then + may be implied by final answer
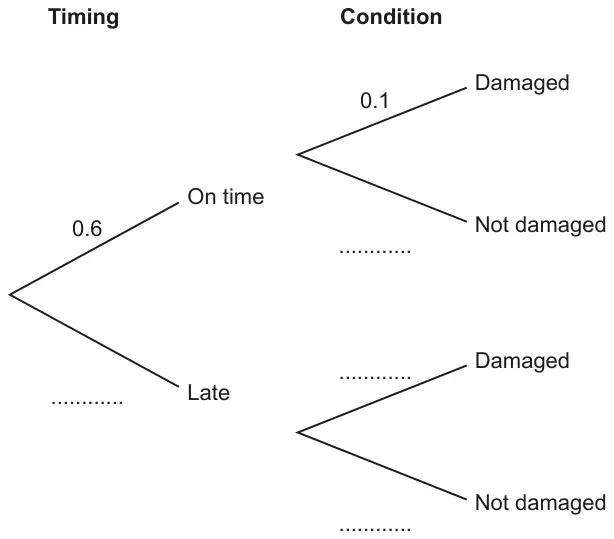
17 An online company is tracking the timing and condition of its deliveries.
The probability that a parcel arrives on time is 0.6. When the parcel arrives on time, the probability that it is damaged is 0.1. When the parcel arrives late, the probability that it is damaged is 0.3.
(a) Use the information to complete the tree diagram. [3]
(b) Given that a parcel arrives damaged, find the probability that it also arrived on time. [4]
Mark scheme (a)
Answer
Marks
Part marks and guidance
Fully correct diagram
3
B1 0.4 and 0.9 correctly placed
B2 0.3 and 0.7 correctly placed or B1 for 0.3 correctly placed or for 0.3 and 0.7 switched
Mark scheme (b)
Answer
Marks
Part marks and guidance
\(\frac{1}{3}\)
4
M3 for \(\frac{0.6 \times 0.1}{0.6 \times 0.1 + \textit{their}(0.4 \times 0.3)}\) oe or M2 for \(0.6 \times 0.1 + \textit{their}(0.4 \times 0.3)\) or better implied by 0.18 or M1 for \(0.6 \times 0.1\) implied by 0.06 or for \(\textit{their}(0.4 \times 0.3)\) implied by 0.12
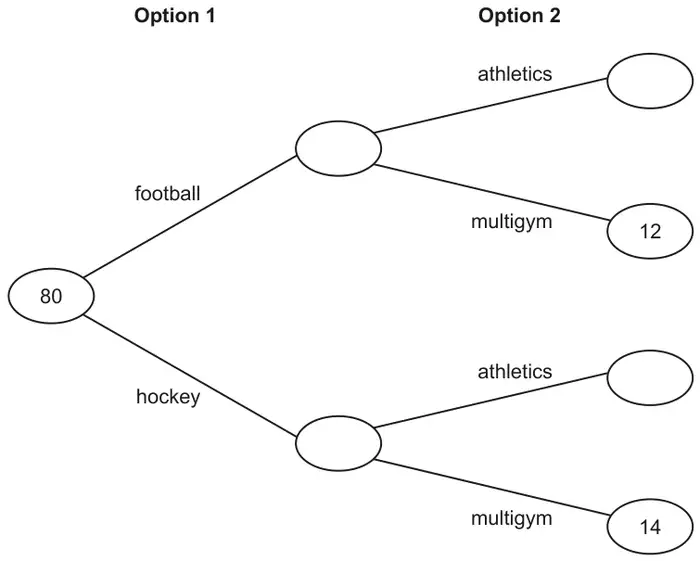
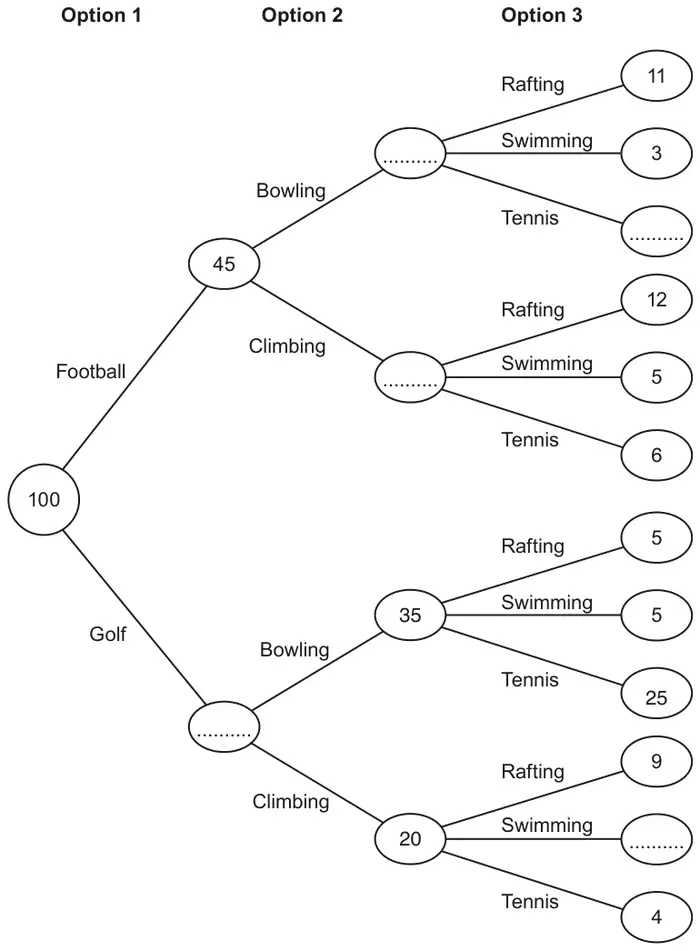
Tennis and [R =] 37 or \(11 + 12 + 5 + 9\) [S =] 20 or \(3 + 5 + 5 +\) their 7 [T =] 43 or their \(8 + 6 + 25 + 4\)
3
FTtheir (a) even if NR
M2 for two from [R =] 37 or \(11 + 12 + 5 + 9\) [S =] 20 or \(3 + 5 + 5 +\) their 7 [T =] 43 or their \(8 + 6 + 25 + 4\) or M1 for one from [R =] 37 or \(11 + 12 + 5 + 9\) [S =] 20 or \(3 + 5 + 5 +\) their 7 [T =] 43 or their \(8 + 6 + 25 + 4\)
If 0 or 1 scored, instead award SC2 for Tennis = 43 which is 6 more than R and 23 more than S
Accept their most popular with strict FT from their three correct totals for these sports
Sums must be correctly evaluated May be on diagram Accept labelled or in correct order
Check \(13 +\) their 7 Check \(35 +\) their 8
If (a) is NR, FT all marks. The values will be: [R =] \(11 + 12 + 5 + 9\) or 37 [S =] \(3 + 5 + 5\) or 13 [T =] \(6 + 25 + 4\) or 35 and the answer R[afting] and the sums or totals seen
Mark scheme (c)
Answer
Marks
Part marks and guidance
\(\dfrac{57}{100}\) oe
2
FTtheir 22 or \(11 + 3 +\) their 8
B1 for their \(22 + 35\) correctly evaluated or 57 seen
If (a) is NR, award SC1 for answer \(\frac{35}{100}\) oe or answer \(\frac{1}{35}\)
Ignore attempts to change form
Accept fraction, decimal (e.g. 0.57) and percentage (e.g. 57%) but not ratio nor in words
For B1, condone \(\frac{1}{57}\) as 57 seen
Mark scheme (d)
Answer
Marks
Part marks and guidance
[That] these [100] children are representative of all children [who attend the adventure park] oe
1
See Appendix
Representative sample
Appendix
Appendix Question 12d
Assumption
Mark
Reason
All children choose in the same way as these children
1
Has the idea of a representative sample
Every group of 100 will chose the same options every time
1
BOD does not say “in the same proportion” but implies representative sample
45% of children that weren’t in the 100 would choose football
1
Indicates representative sample
That every child that turns up for the adventure park will choose the same options as the 100
1
BOD. Does not say “in the same way as the 100” but indicates representative sample
The same proportions apply to all other children coming to the park
1
Representative sample
Because 45 is 45% of every 100 children that come to the park
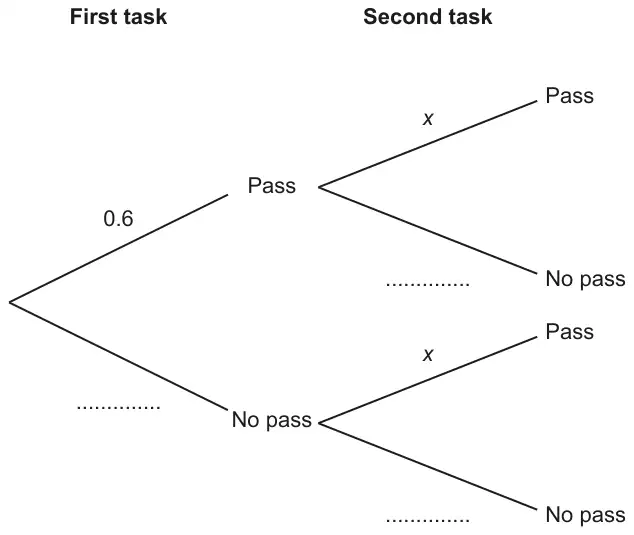
11 A student attempts two tasks. The result of each task is either “Pass” or “No pass”.
The probability of the student passing the first task is 0.6. The probability of the student passing the second task is \(x\).
(a) Complete the tree diagram. [2]
(b) Write down the mathematical assumption that has been made about the two tasks. [1]
(c) The probability of the student passing just one of these two tasks is 0.528.
Work out the value of \(x\). [4]
Mark scheme (a)
Answer
Marks
Part marks and guidance
Correct tree diagram
2
B1 for 0.4 on missing branch in task 1 B1 for \(1 - x\) on both missing branches in task 2
If there is more than one answer on any branch, choose the one on the dotted line first
Mark scheme (b)
Answer
Marks
Part marks and guidance
They are independent oe
1
Pick the best comment, see appendix
Appendix: exemplar responses for Q11(b)
Response
Mark
The pass before does not affect the results after
1
They are independent
1
The first task results do not affect the second
1
Passing first task does not affect the second task
1
Passing the second does not rely on passing the first
1
They are not linked
1
Same probability to pass second on both times
0
The probabilities of the tests do not change
0
The probability of passing will always stay the same
0
Both second tests are the same
0
Mark scheme (c)
Answer
Marks
Part marks and guidance
0.36
4
M2 for \(0.6(1 - x) + 0.4x = 0.528\) or better or M1 for \(0.6(1 - x) + 0.4x\) or better M1 for rearranging their linear equation, \(kx + a = b\), to make \(kx\) the subject (\(0 \lt k\))
e.g. M2 for \(0.6 - 0.2x = 0.528\) e.g. M1 for \(0.6 - 0.2x\) e.g. \(0.6 - 0.528 = 0.2x\) or better allow similar equations involving 1–0.528 e.g \(0.6x + 0.4(1 - x) = 0.472\)
OR M2 for \(1 - 0.6x - 0.4(1 - x) = 0.528\) or better or M1 for \(1 - 0.6x - 0.4(1 - x)\) or better M1 for rearranging their linear equation, \(kx + a = b\), to make \(kx\) the subject (\(0 \lt k\))
e.g. \(0.6 - 0.528 = 0.2x\) or better
OR FTtheir(a) if not correct for up to 3 marks e.g. if in (a) \(1 - x\) is replaced with e.g. 0.4 then M2 for \(0.6 \times 0.4 + 0.4x = 0.528\) or better or M1 for \(0.6 \times 0.4 + 0.4x\) or better M1 for rearranging their linear equation, \(kx + a = b\), to make \(kx\) the subject (\(0 \lt k\))
e.g. \(0.4x = 0.528 - 0.6 \times 0.4\) or better
alternative method using trials M1 for each correct trial up to M3 and the correct answer from trials scores 4 marks, see appendix
If 0 scored SC1 for any 2 branches correctly written down and added e.g. \(0.6(1 - x) + 0.4(1 - x)\)
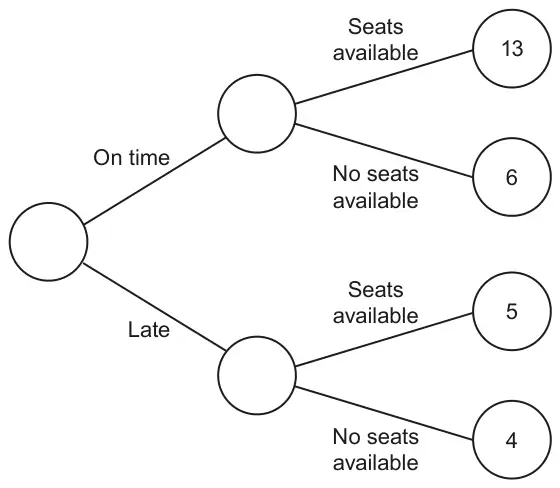
Jack’s results are shown on this partly completed frequency tree.
(a) Find the relative frequency of there being no seats available on Jack’s train journey. [2]
(b) Jack says
If the train is late, travellers are less likely to find seats available than if the train was on time.
Does Jack’s data suggest he is correct? Show how you decide. [3]
Mark scheme (a)
Answer
Marks
Part marks and guidance
\(\frac{10}{28}\) oe
2
M1 for \(\frac{10}{k}\) with \(k \gt 10\) or \(\frac{m}{28}\) with \(0 \lt m \lt 28\) or for \(\frac{4 + 6}{13 + 6 + 5 + 4}\)
If 0 scored, SC1 for answer 10 : 28 or 5 : 14
Accept 0.357 to 0.36
Mark scheme (b)
Answer
Marks
Part marks and guidance
Eg. P(seats given late) = \(\frac{5}{9}\)
P(seats given on time) = \(\frac{13}{19}\)
0.55[5…] to 0.56 and 0.68 to 0.68[4…] or 0.6 and 0.7 or \(\frac{95}{171}\) and \(\frac{117}{171}\) AND Yes/correct [because] oe
3
M1 for P(seats given late) = \(\frac{5}{9}\) oe
M1 for P(seats given on time) = \(\frac{13}{19}\) oe
Condone lack of labelling; mark to candidate’s benefit. Condone wrong labelling for M marks only Include working on the diagram
Allocate similar marks if working with probabilities for “no seats”: \(\frac{4}{9}\) \(\frac{6}{19}\) 0.4[4…] and 0.3[1] to 0.32 \(\frac{76}{171}\) and \(\frac{54}{171}\)
For full marks must convert both to a comparable form and give a correct conclusion Comparable form may be decimal, percentage or fractions with common denominator or numerator
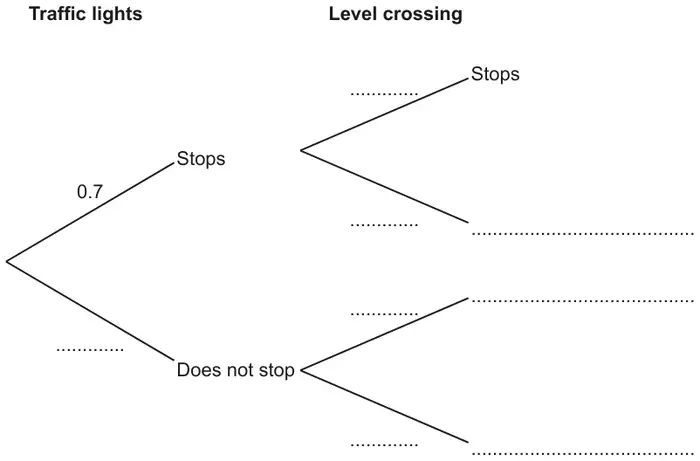
22 On a bus route there is a set of traffic lights and a level crossing. The probability that the bus stops at the traffic lights is 0.7. The probability that the bus stops at the level crossing is 0.2.
(a) Use the information to complete the tree diagram.
[3]
(b) Find the probability that the bus stops at either the traffic lights or at the level crossing but not both. [3]
Mark scheme (a)
Answer
Marks
Part marks and guidance
0.3
1
Accept fractions or percentages
0.2, 0.8, 0.2, 0.8 or 0.2, 0.8, 0.8, 0.2
1
Does not stop, stops, does not stop
1
Diagram must be fully correct for 3 marks
Mark scheme (b)
Answer
Marks
Part marks and guidance
0.62
3
M2 for \(0.7 \times 0.8 + 0.3 \times 0.2\) or better or for \(1 - (0.7 \times 0.2 + 0.3 \times 0.8)\) or better or M1 for one correct product shown or implied
FT for M1 and M2 and 3their 0.8, 0.2 and their 0.3 (must be less than 1)
eg \(0.7 \times 0.8\) or \(0.3 \times 0.2\) or \(0.7 \times 0.2\) or \(0.3 \times 0.8\) soi by 0.56, 0.06, 0.14 or 0.24
12 In a computer game the player can either win or lose. A student thinks the ratio of the probability of winning to the probability of losing is 2 : 3. The student plays two games.
(a) Use the information to complete the tree diagram.
[3]
(b) Find the probability that the student wins at least one of the two games. [3]
(c) The student now thinks the ratio of the probability of winning to the probability of losing has changed to 2 : 5.
Explain the effect this change will have on your answer to part (b). [1]
Mark scheme (a)
Answer
Marks
Part marks and guidance
0.4 and 0.6 oe on the correct branches
3
B1 for 0.4 or 0.6 oe M1 for 0.4 and 0.6 on first branch or on all second branches in the correct places If 0 scored SC1 for two probabilities consistently placed and adding to 1
Accept equivalent fractions \(\frac{2}{5}\) and \(\frac{3}{5}\)
Mark scheme (b)
Answer
Marks
Part marks and guidance
0.64 or \(\frac{16}{25}\) oe
3
FT for M1 and M2 and 3 from their 0.6 and their 0.4 throughout providing their 0.6 + their 0.4 = 1 M2 for correct method e.g. 1 – their 0.6 × their 0.6 oe or M1 for one correct branch e.g. their 0.6 × their 0.6 or their 0.4 × their 0.6
Accept 64% for 3 marks
e.g. M2 for their \(\frac{2}{5}\) + their \(\frac{3}{5}\) × their \(\frac{2}{5}\)
for one correct branch condone just P(win) e.g. their \(\frac{2}{5}\)
Mark scheme (c)
Answer
Marks
Part marks and guidance
any correct reason e.g. the answer will be smaller
1
Their answer should explain the effect on the answer to part (b), ignore calculations, see appendix
Appendix: exemplar responses for Q12(c)
Response
Mark
[the answer] it will be smaller
1
the probability of winning will decrease
1bod
The probability of losing will increase
1 bod
They win less games
0
the answer will change because the probabilities have changed
19 A box contains 25 discs. The discs are either blue or yellow in the ratio 4 : 1. Two discs are chosen at random from the box without replacement.
Find the probability that the two discs are different colours. You must show your working. [5]
Mark scheme
Answer
Marks
Part marks and guidance
\(\frac{1}{3}\) oe with correct working
5
M1 for blue = 20 and yellow = 5
M3 for \(\frac{5}{25} \times \frac{20}{24} + \frac{20}{25} \times \frac{5}{24}\) oe or M2 for \(\frac{5}{25} \times \frac{20}{24}\) oe
or M1 for correct tree diagram or sample space or for \(\frac{5}{25}\) and \(\frac{20}{24}\) or \(\frac{20}{25}\) and \(\frac{5}{24}\) oe seen
If 0 scored, SC1 for correct answer with no or insufficient working or for P(B) = \(\frac{4}{5}\) oe and P(Y) = \(\frac{1}{5}\) oe
Correct working” requires evidence of M1 and M3 or convincing alternate approach
M1 implied from e.g. \(\frac{20}{25}\) and \(\frac{5}{25}\), [B : Y =] 20: 5 Do not award this mark if they then go on to e.g. use 4 and 1 in working on the tree diagram in both stages for the probabilities but allow the FT method marks for the products or probabilities
For M3, M2 allow evaluated products e.g. for M3 allow \(\frac{100}{600} + \frac{100}{600}\) oe provided tree diagram given with individual probabilities shown. M2 not awarded if part of a larger product of probabilities
For M3, M2, M1 FT their blue and yellow e.g. blue 4 and yellow 1 M3 for \(\frac{4}{5} \times \frac{1}{4} + \frac{1}{5} \times \frac{4}{4}\) [answer \(\frac{2}{5}\) oe] M2 for \(\frac{4}{5} \times \frac{1}{4}\) or \(\frac{1}{5} \times \frac{4}{4}\) M1 for \(\frac{4}{5}\) and \(\frac{1}{4}\)
16 If it rains on a given day the probability that it will rain the next day is 0.65. If it does not rain on a given day the probability that it will rain the next day is 0.3. It rained on Monday.
(a) Complete the tree diagram.[2]
(b) Find the probability that it rains on Wednesday. [3]
Mark scheme (a)
Answer
Marks
Part marks and guidance
Tuesday [0].65 oe and [0].35 oe in the correct places and Wednesday [0].65 oe with [0].35 oe and [0].3 oe with [0].7 oe in the correct places
2
B1 for one pair of probabilities correct in one branch e.g Tuesday or one of the Wednesday branches
Mark scheme (b)
Answer
Marks
Part marks and guidance
[0].5275 or [0].528 or 0.53 or \(\frac{211}{400}\) oe nfww
3
M2 for [0].65 × [0].65 + [0].35 × [0].3 oe or M1 for [0].65 × [0].65 or [0].35 × [0].3 oe implied by .4225 or .105 or \(\frac{169}{400}\) or \(\frac{21}{200}\) oe
If (a) is not correct FTtheir tree for 3 marks,M2 and M1 Allow 52.75%, 52.8% 53% for 3 marks
24 Alex has a bag containing 3 blue beads and 5 green beads.
There are no other beads in the bag.
Alex takes a bead at random from the bag, puts it back, and then takes another bead.
Alex says
The probability that the two beads are the same colour is less than 50%.
Is Alex correct? Show how you decide. You may use this tree diagram if you wish.
.................... because ........................................ [5]
Mark scheme
Answer
Marks
Part marks and guidance
No oe and \(\dfrac{34}{64}\) oe
5
M4 for \(\dfrac{3}{8} \times \dfrac{3}{8} + \dfrac{5}{8} \times \dfrac{5}{8}\) oe or M3 for \(\dfrac{3}{8} \times \dfrac{3}{8}\) or \(\dfrac{5}{8} \times \dfrac{5}{8}\) oe or B2 for \(\dfrac{3}{8}\) and \(\dfrac{5}{8}\) oe or B1 for \(\dfrac{3}{8}\) oe or \(\dfrac{5}{8}\) oe
M3, B2 or B1 may be seen on the diagram or in working. Diagram does not need to be labelled.
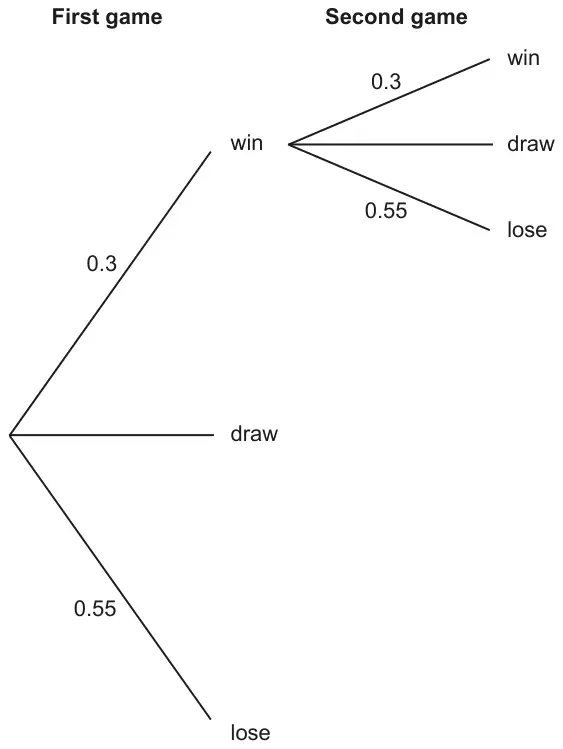
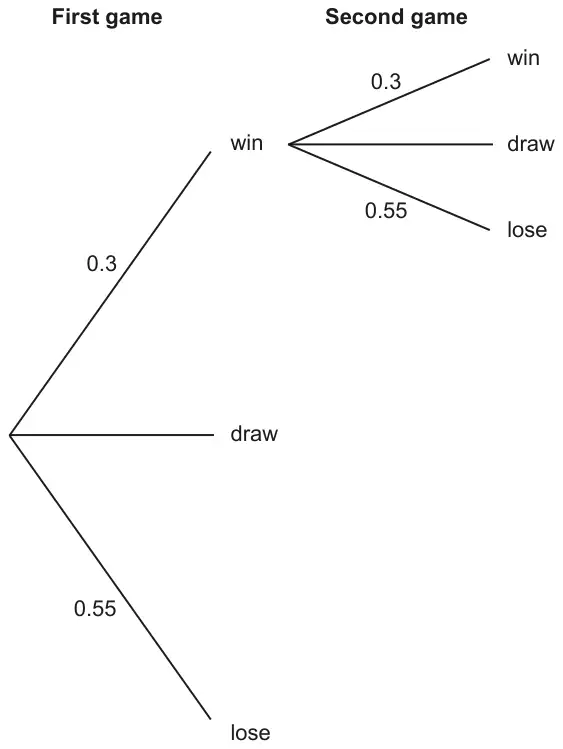
23 Sam and Taylor are playing a game against a computer. They can win, draw or lose the game.
Sam says
I think the probability of us winning the game is 0.3.
Taylor says
I think the probability of us losing the game is 0.75.
(a) Explain why Sam and Taylor cannot both be correct. [1]
(b) Sam is correct. The probability of them winning the game is 0.3. Taylor is not correct. The probability of them losing the game is actually 0.55.
Complete this partly drawn tree diagram to show all the possible outcomes of playing the game twice.
[3]
(c) Find the probability of them winning the first game and losing the second game. [2]
Mark scheme (a)
Answer
Marks
Part marks and guidance
0.3 + 0.75 [= 1.05] is greater than 1
1
Condone additional statements that do not contradict See appendix Condone 100% for 1
Appendix
Question 23a
Comment
Mark
Reason
0.3 + 0.75 add to greater than 1
They add to greater than 1
1
Allow “they” or “the probabilities” etc for 0.3 and 0.75 (1.05 does not need to be seen)
0.3 + 0.75 = 1.05 which is more than 1. The probability of winning + losing should equal 1.
1
Winning + losing should \(\leqslant 1\) but does not contradict required evidence
Probabilities add up to 1 and 0.3 + 0.75 = 1.05 which is beyond 1
1
First vague words do not contradict required evidence
0.3 + 0.75 = 1.05 and probability only goes to 1
1
BOD “only goes to” as meaning “cannot be greater than”
The probabilities should add to 1 but instead 1.05 which isn’t possible
0
“Which isn’t possible” not enough without > 1
0.3 + 0.75 = 1.05 so they cannot both be correct
0
True but doesn’t say why they cannot both be correct (0.3 + 0.75 > 1)
Probabilities must add to 1 or less
0
True general statement but not related it to this context
They must add up to less than 1
0
Incorrect, they could also add up to 1 but have not mentioned adding to > 1
They must add up to 1
0
Incorrect, they could also add up to less than 1 but have not mentioned adding to > 1
0.3 + 0.75 = 1.05 and it needs to be a whole number
0
Sum is correct but reason does not say more than 1
They cannot be right because probabilities must add to 1 which they don’t
0
Probabilities do not always add to 1 and the required evidence is not given
Mark scheme (b)
Answer
Marks
Part marks and guidance
Correct tree diagram
3
B1 for P(draw) = 0.15 B1 for two correctly placed sets of three branches with win/draw/lose labels B1 for 0.3, their 0.15 and 0.55 correctly placed on all required branches
May be on diagram or in a calculation e.g. 0.3+0.55+0.15 = 1 oe Ignore probabilities. Accept e.g. W/D/L as labels Condone omission of their 0.15 on printed branches
Mark scheme (c)
Answer
Marks
Part marks and guidance
[0].165 oe
2
M1 for \([0].3 \times [0].55\)
oe may be \(\dfrac{33}{200}\) or equivalent fraction or 16.5%
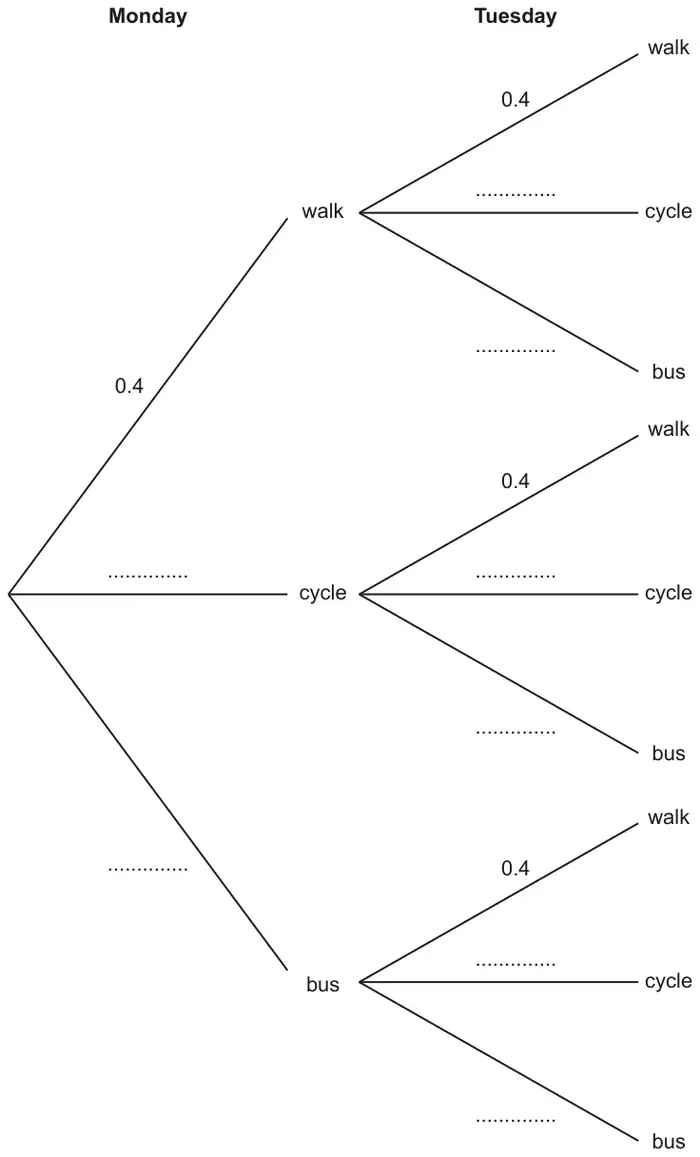
20 Reece travels to school by either walking, cycling or using a bus. The probability that Reece walks is always 0.4. The probability that Reece cycles is always 0.55.
(a) Complete the tree diagram for Monday and Tuesday.
[3]
(b) Show that the probability that Reece travels to school by the same method on Monday and Tuesday is 0.465. [3]
Mark scheme (a)
Answer
Marks
Part marks and guidance
All branches completed with 0.55 and 0.05 in correct places
3
B1 for 0.55 correctly placed at least once B1 for 0.05 correctly placed at least once
M2 for \(0.4 \times 0.4\), \(0.55 \times 0.55\) and \(0.05 \times 0.05\) may be 0.16, 0.3025, 0.0025 or M1 for \(0.4 \times 0.4\) or \(0.55 \times 0.55\) or \(0.05 \times 0.05\) may be 0.16, 0.3025, 0.0025
Answer given: for 3 marks products and additions must be explicitly seen Accept e.g. \((0.4)^2\) for \(0.4 \times 0.4\) Values may be seen on diagram in (a) If all values shown on ends of tree, must select 3 values to use for M2 and 1 value for M1 Equivalent fractions are OK but, for 3 marks must convert to the decimal
17 There are 15 sweets in a bag. 10 of the sweets are toffee and 5 are mint. Reece takes two of the sweets at random.
Work out the probability that Reece takes one of each type of sweet. [4]
Mark scheme
Answer
Marks
Part marks and guidance
\(\frac{100}{210}\) oe
4
B1 for \(\frac{9}{14}\) or \(\frac{5}{14}\) or \(\frac{10}{14}\) or \(\frac{4}{14}\)
May be on a diagram or in a calculation
M1 for \(\frac{10}{15} \times \frac{5}{14}\) or \(\frac{5}{15} \times \frac{10}{14}\) or \(\frac{50}{210}\) oe
M1 for 2 × their \(\frac{50}{210}\) oe (must be 2× a product)
Common equivalents for 4 marks include \(\frac{10}{21}\) or 0.476… or 47.6…%, condone 0.48 with evidence of some correct working
Alt. method B1 as in mark scheme M1 for \(\frac{10}{15} \times \frac{9}{14} + \frac{5}{15} \times \frac{4}{14}\) or \(\frac{110}{210}\) oe M1 for \(1 - \frac{110}{210}\) oe
If 0 scored allow SC2 for answer \(\frac{100}{225}\) oe or SC1 for answer \(\frac{50}{225}\) oe
equivs. e.g. \(\frac{20}{45}\), \(\frac{4}{9}\), 0.444.., 44.4..% equivs. e.g. \(\frac{10}{45}\), \(\frac{2}{9}\), 0.222.., 22.2..%
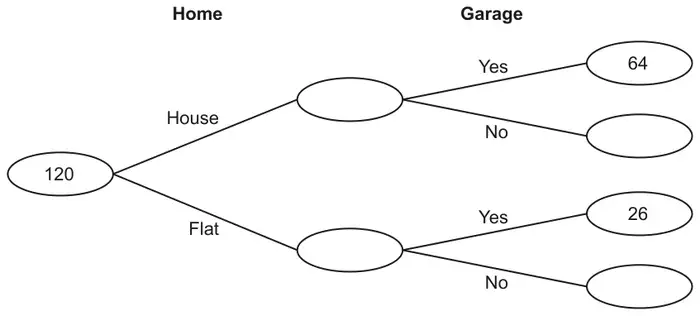
11 120 new homes are built in a village. Each home is either a house or a flat. Each home either has a garage or does not have a garage. 64 of the houses have a garage and 26 of the flats have a garage.
This frequency tree shows the above information.
(a) \(\dfrac{5}{8}\) of the homes are houses.
Complete the frequency tree. [4]
(b) Show that 75% of the homes have a garage. [2]
Mark scheme (a)
Answer
Marks
Part marks and guidance
75 11
45 19
4
B1 each correct OR B1 for 75 B1 FT for 45 B1 FT for 11 and 19
Mark to candidate’s advantage, ie B1 each correct or part marks including possible FT
Negative numbers will not score. Values must be integers.
Mark scheme (b)
Answer
Marks
Part marks and guidance
\(64 + 26 = 90\) and \(\dfrac{90}{120} = 75\%\) nfww OR
\(120 \times 0.75 = 90\) and \(64 + 26 = 90\) oe
2
M1 for \(64 + 26 = 90\) OR M1 for \(120 \times 0.75 = 90\) OR M1 for \(\dfrac{90}{120} = 75\%\) nfww
Accept \(\dfrac{3}{4}\) for 75%
Allow equivalent methods using 25% or \(\dfrac{1}{4}\) for M1 or 2 If using 25% for 2 marks they must also show 100% – 25% = 75% oe
Breakdown methods must be complete and correct
Do not accept e.g. 0.75 of 120 Do not accept e.g. 75% \(\times\) 120 Do not accept 75% for 0.75 or \(\dfrac{75}{100}\) as this is a show that question
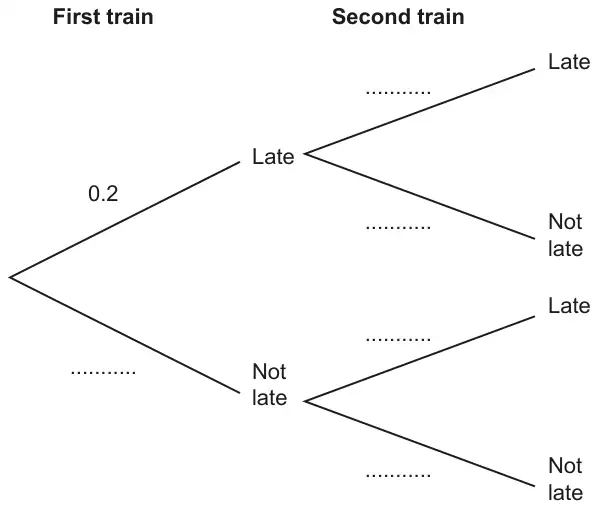
(a) Over a long period of time, it is found that the probability of a train from Bewford to London being late is 0.2.
(i) One morning there are two trains from Bewford to London. Use the information to complete the tree diagram.
[2]
(ii) Work out the probability that both trains are not late. [2]
(iii) Give a reason why the probabilities used in the tree diagram for the second train may not be reliable. [1]
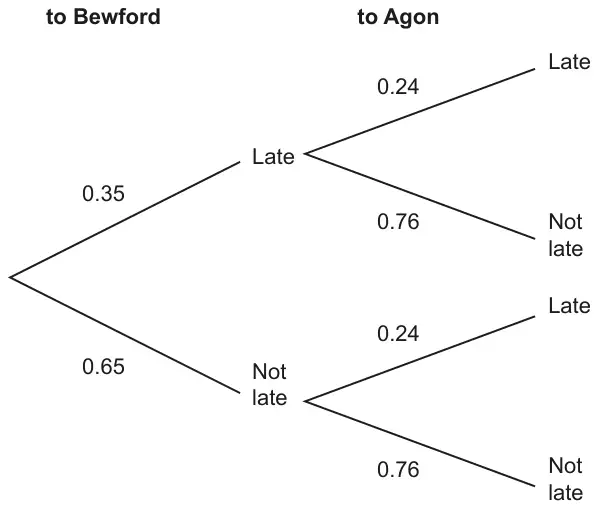
(b) Morgan takes a train from London to Bewford and then another train to Agon. The tree diagram shows the probabilities of Morgan’s trains being late or not late.
Morgan will not catch the train to Agon if the train to Bewford is late and the train to Agon is not late.
Work out the probability that Morgan will catch the train to Agon. [3]
Mark scheme (a)
Answer
Marks
Part marks and guidance
(i) 0.2 and 0.8 in all the correct places
2
B1 for first branch correct or second branches correct
Accept equivalent fractions and percentages (need % sign)
(ii) 0.64 or \(\dfrac{16}{25}\) oe or 64%
2
FTtheir tree for 1 or 2 marks (their values \(\lt 1\)) M1 for \(0.8 \times 0.8\) oe
Allow long method: e.g. \(1 - (0.04 + 0.16 + 0.16)\)
(iii) Suggestion of dependence between the trains
or unexpected events
or data may not be applicable
1
Accept any correct reason, e.g. if first train is late second train may be held up e.g. unexpected delays can occur e.g. changed schedule that day (implies data not applicable)
Mark scheme (b)
Answer
Marks
Part marks and guidance
0.73[4] or \(\dfrac{734}{1000}\) oe or 73.4%
3
M2 for \(1 - 0.35 \times 0.76\) or \(0.35 \times 0.24 + 0.65 \times 0.24 + 0.65 \times 0.76\) oe or M1 for two correct products or \(0.35 \times 0.76\)
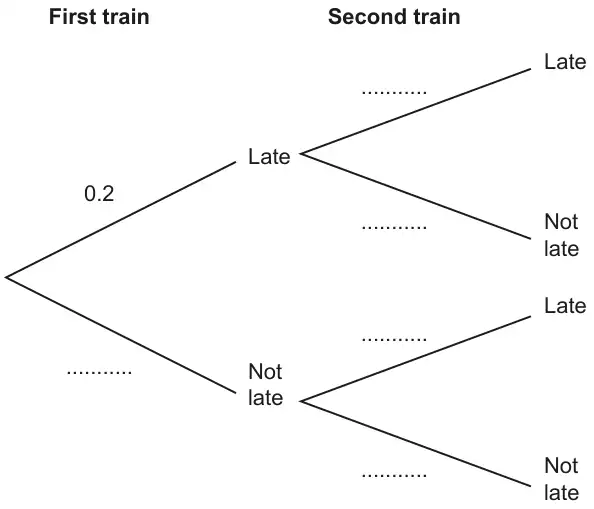
(a) Over a long period of time, it is found that the probability of a train from Bewford to London being late is 0.2.
(i) One morning there are two trains from Bewford to London. Use the information to complete the tree diagram.
[2]
(ii) Work out the probability that both trains are not late. [2]
(iii) Give a reason why the probabilities used in the tree diagram for the second train may not be reliable. [1]
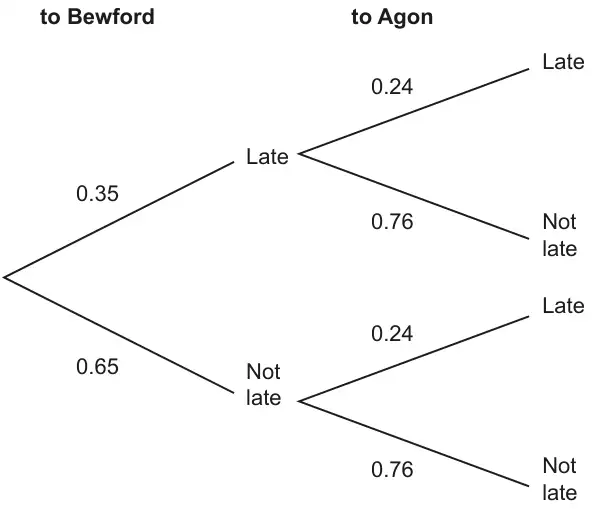
(b) Morgan takes a train from London to Bewford and then another train to Agon. The tree diagram shows the probabilities of Morgan’s trains being late or not late.
Morgan will not catch the train to Agon if the train to Bewford is late and the train to Agon is not late.
Work out the probability that Morgan will catch the train to Agon. [3]
Mark scheme (a)
Answer
Marks
Part marks and guidance
(i) 0.2 and 0.8 in all the correct places
2
B1 for first branch correct or second branches correct
Accept equivalent fractions and percentages (need % sign)
(ii) 0.64 or \(\frac{16}{25}\) oe or 64%
2
FTtheir tree for 1 or 2 marks ( their values < 1) M1 for 0.8 × 0.8 oe
Allow long method : e.g. 1 – (0.04 + 0.16 + 0.16)
(iii) Suggestion of dependence between the trains
or unexpected events
or data may not be applicable
1
Accept any correct reason, e.g. if first train is late second train may be held up e.g. unexpected delays can occur e.g. changed schedule that day (implies data not applicable)
Mark scheme (b)
Answer
Marks
Part marks and guidance
0.73[4] or \(\frac{734}{1000}\) oe or 73.4%
3
M2 for 1 – 0.35 × 0.76 or 0.35 × 0.24 + 0.65 × 0.24 + 0.65 × 0.76 oe or M1 for two correct products or 0.35 × 0.76
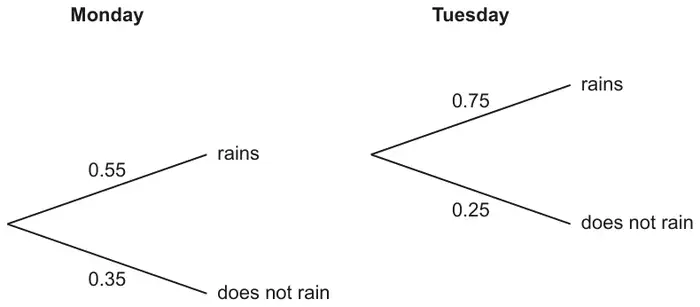
the probability that it will rain on Monday is 0.55
and
the probability that it will rain on Tuesday is 0.25.
Ella draws a tree diagram to show this information.
Write down three errors that Ella has made with her tree diagram. [3]
Mark scheme
Answer
Marks
Part marks and guidance
For Monday, does not rain should be 1 – 0.55 oe
For Tuesday, 0.25 is incorrectly placed on the does not rain branch oe
A pair of branches is missing for Tuesday after does not rain on Monday oe
3
B1 for each
After each correct statement isw eg 0.55 + 0.35 does not equal 1 Monday not rain should be 0.45
eg For Tuesday the probabilities are placed the wrong way around 0.25 should be on the rain branch
eg There should be two more branches for Tuesday
See AG
Exemplar responses
Mark clear intention and condone slips in language provided intention is clear. e.g. accept tree for branches
Exemplar responses for Q22
Response
Mark
0.35 needs to be 0.45
1
She didn’t subtract the 0.55 probability that it rain from 1 to get the probability that it doesn’t rain (0.45 seen on the diagram and 0.35 crossed out)
1
The (0.35) they did not show it, how did they get that number, because it’s wrong (error identified)
1
Don’t add to 100 on Monday (condone lack of % sign)
1 BOD
They do not add up to 1 (but if 0.55 and 0.35 shown then this would score)
0
A probability tree always adds up to 1 (but if ref to 0.55 and 0.35 then this would score)
0
0.55 + 0.35 = 90, meaning she’s not taking it from 1 (statement incorrect)
0
For Tuesday it should be 0.25 for rain and 0.75 for not rain (if stated as separate reasons this is just 1 mark)
1
She says probability that it rains on Tuesday is 0.75 but it is 0.25
1
She has said that the probability it doesn’t rain on Tuesday is 0.25. (points out the error)
1
On Tuesday the chance of rain is 0.25 (just restating the stem needs further explanation)
0
For Tuesday the probability it will rain is plotted wrong (not specific enough)
0
In the second tree diagram, she has the wrong number for rain (not specific enough)
0
She wrote the probability “0.25” that it rains on Tuesday in the wrong section on the diagram (not specific enough)
0
There would be another tree diagram ( with two more branches correctly drawn on the diagram )
1
She only drew 2 trees, she should have shown the probability of it raining and not raining on each end of the tree
1
She has put Tuesday branch following on from Monday it rains and has not done the Monday it does not rain tree
1
There is no tree for Tuesday it does not rain (BOD with position indicated)
1
She needs a second tree diagram for it does not rain (or for Tuesday)
1
There is no second branch for Tuesday, (or there is not a Tuesday for it does not rain)
1
She’s not continued the does not rain section (BOD gives some indication of position)
1
There should be another branch (Needs to indicate where)
0
She doesn’t have all the branches that are needed
0
She hasn’t completed the whole tree diagram with all the outcomes
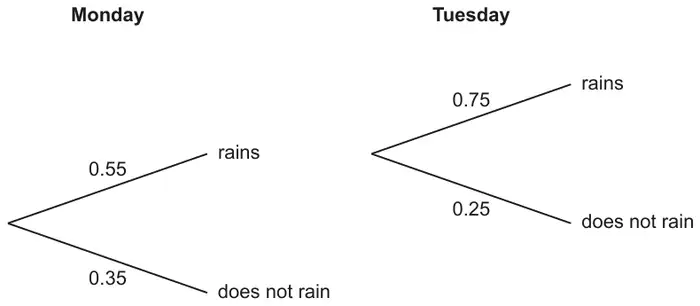
the probability that it will rain on Monday is 0.55
and
the probability that it will rain on Tuesday is 0.25.
Ella draws a tree diagram to show this information.
Write down three errors that Ella has made with her tree diagram. [3]
Mark scheme
Answer
Marks
Part marks and guidance
For Monday, does not rain should be 1 – 0.55 oe
For Tuesday, 0.25 is incorrectly placed on the does not rain branch oe
A pair of branches is missing for Tuesday after does not rain on Monday oe
3
B1 for each
After each correct statement isw eg 0.55 + 0.35 does not equal 1 Monday not rain should be 0.45
eg For Tuesday the probabilities are placed the wrong way around 0.25 should be on the rain branch
eg There should be two more branches for Tuesday
See AG
Appendix: Exemplar responses Q8
Mark clear intention and condone slips in language provided intention is clear. e.g. accept tree for branches
Response
Mark
0.35 needs to be 0.45
1
She didn’t subtract the 0.55 probability that it rains from 1 to get the probability that it doesn’t rain (0.45 seen on the diagram and 0.35 crossed out)
1
The (0.35) they did not show it, how did they get that number, because it’s wrong (error identified)
1
Don’t add to 100 on Monday (Condone lack of % sign)
1 BOD
They do not add up to 1 (but if 0.55 and 0.35 shown then this would score)
0
A probability tree always adds up to 1 (but if ref to 0.55 and 0.35 then this would score)
0
0.55 + 0.35 = 90, meaning she’s not taking it from 1 (statement incorrect)
0
For Tuesday it should be 0.25 for rain and 0.75 for not rain (if stated as separate reasons this is just 1 mark)
1
She says probability that it rains on Tuesday is 0.75 but it is 0.25
1
She has said that the probability it doesn’t rain on Tuesday is 0.25. (points out the error)
1
On Tuesday the chance of rain is 0.25 (just restating the stem needs further explanation)
0
For Tuesday the probability it will rain is plotted wrong (not specific enough)
0
In the second tree diagram, she has the wrong number for rain (not specific enough)
0
She wrote the probability “0.25” that it rains on Tuesday in the wrong section on the diagram (not specific enough)
0
There would be another tree diagram ( with two more branches correctly drawn on the diagram )
1
She only drew 2 trees, she should have shown the probability of it raining and not raining on each end of the tree
1
She has put Tuesday branch following on from Monday it rains and has not done the Monday it does not rain tree
1
There is no tree for Tuesday it does not rain (BOD with position indicated)
1
She needs a second tree diagram for it does not rain (or for Tuesday)
1
There is no second branch for Tuesday, (or there is not a Tuesday for it does not rain)
1
She’s not continued the does not rain section (BOD gives some indication of position)
1
There should be another branch (Needs to indicate where)
0
She doesn’t have all the branches that are needed
0
She hasn’t completed the whole tree diagram with all the outcomes
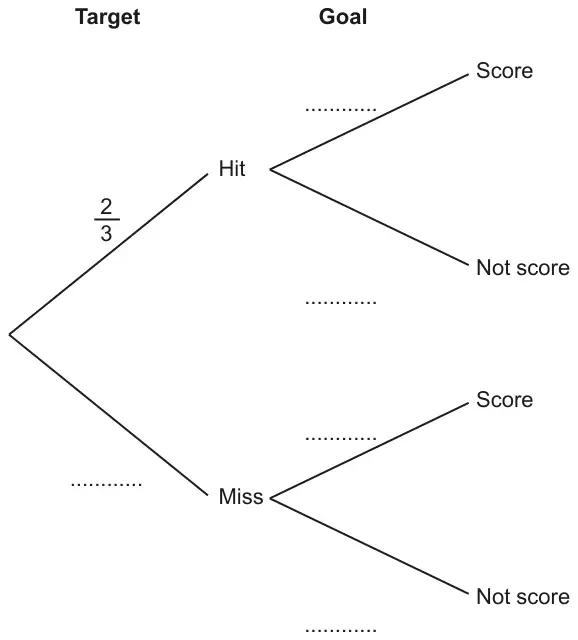
15 Ryan shoots an arrow at a target. He then kicks a ball at a goal.
The probability that Ryan hits the target is \(\dfrac{2}{3}\).
The probability that Ryan scores a goal is \(\dfrac{3}{5}\).
(a) Complete the tree diagram.
[2]
(b) Find the probability that Ryan
(i) misses the target and does not score a goal, [2]
(ii) either hits the target or scores a goal or both. [2]
Mark scheme (a)
Answer
Marks
Part marks and guidance
Correct tree diagram
2
B1 for \(\dfrac{1}{3}\) correctly placed on first branch B1 for \(\dfrac{3}{5}\) and \(\dfrac{2}{5}\) correctly placed on both sets of second branches
Accept equivalent fractions and decimals with \(\dfrac{1}{3}\) at least 0.33
Mark scheme (b)
Answer
Marks
Part marks and guidance
(i) \(\dfrac{2}{15}\) oe nfww
2
FTtheir (a) M1 for their \(\dfrac{1}{3}\) × their \(\dfrac{2}{5}\)
FT their fractions < 1 Ignore attempts to cancel or change to decimal or percentage once correct answer seen Do not accept words or ratios Accept 0.13[3...] or 13[.3...]% If no working seen answer must be correct
(ii) \(\dfrac{13}{15}\) oe nfww
2
FTtheir (i) M1 for 1 – their \(\dfrac{2}{15}\)
ALTERNATIVE with each of their fractions < 1 M1 for \(\dfrac{2}{3} \times \dfrac{3}{5} + \dfrac{2}{3} \times \dfrac{2}{5} + \dfrac{1}{3} \times \dfrac{3}{5}\) or \(\dfrac{2}{3} + \dfrac{1}{3} \times \dfrac{3}{5}\)
FT their fractions < 1 Do not accept words or ratios Accept 0.86 to 0.87 or 86% to 87% If no working seen answer must be correct Ignore attempts to cancel or change to decimal or percentage once correct answer seen
May be implied by \(\dfrac{6}{15} + \dfrac{4}{15} + \dfrac{3}{15}\) or \(\dfrac{2}{3} + \dfrac{3}{15}\)
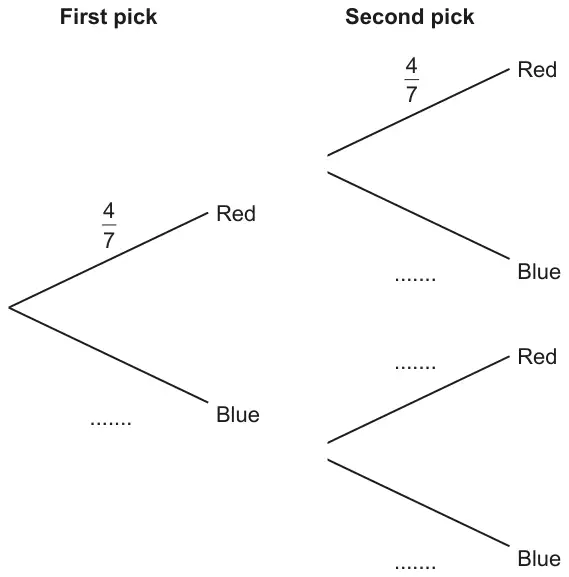
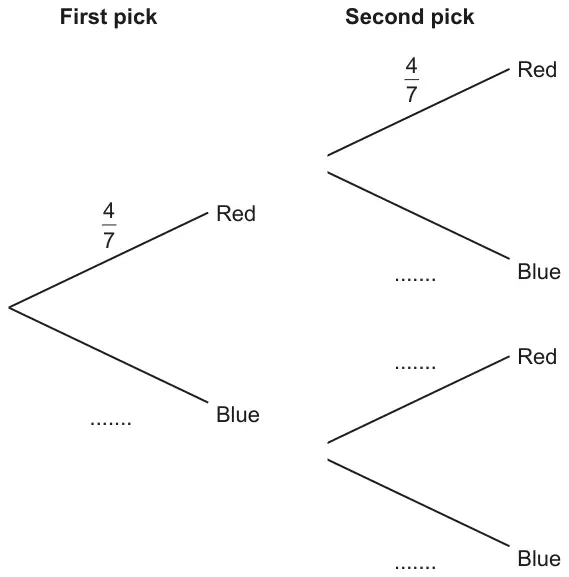
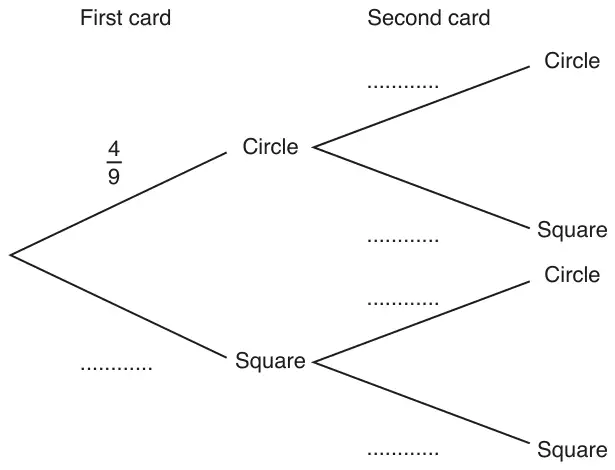
17 A bag contains 4 red counters and 3 blue counters only. Jack picks a counter at random and then replaces it. Jack then picks a second counter at random.
(a) Complete the tree diagram.
[2]
(b) Work out the probability that Jack picks two red counters. [2]
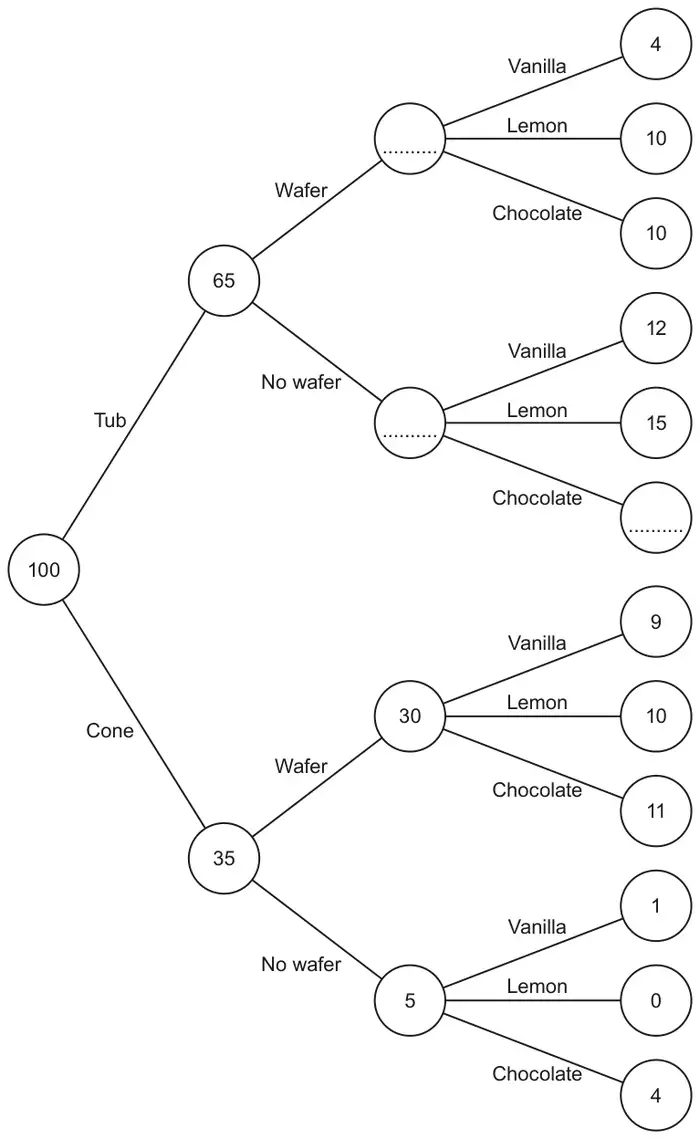
11 Megan’s Cafe sells ice cream. Customers choose to have a tub or a cone, and a wafer or no wafer. They can choose vanilla, lemon or chocolate ice cream.
This frequency tree shows the number of people making some of the choices.
(a) Anaya buys an ice cream.
One choice she can make is
a cone, no wafer and vanilla.
How many different choices can she make? [1]
(b) Complete the frequency tree. [2]
(c) Which flavour of ice cream was most popular? Show how you decide. [3]
Mark scheme (a)
Answer
Marks
Part marks and guidance
12
1
Mark scheme (b)
Answer
Marks
Part marks and guidance
24 41 14
2
B1 for one or two correct
No FT from wrong 41 as this can be achieved from final totals
Mark scheme (c)
Answer
Marks
Part marks and guidance
(V) 4 + 12 + 9 + 1 soi 26 (L) 10 + 15 + 10 [+ 0] soi 35 (C) 10 + their 14 + 11 + 4 soi 39
M2
or M1 for one correct sum or two correct totals
A sum is eg 4 + 12 + 9 + 1 May be seen as 35 out of 100 oe Their 14 must match diagram For (C) allow 100 – their V – their L
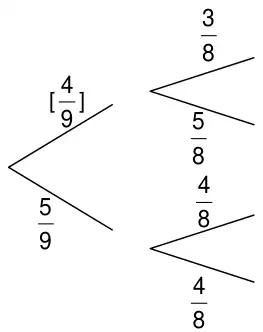
6 A bag contains 4 red counters and 3 blue counters only. Jack picks a counter at random and then replaces it. Jack then picks a second counter at random.
(a) Complete the tree diagram.
[2]
(b) Work out the probability that Jack picks two red counters. [2]
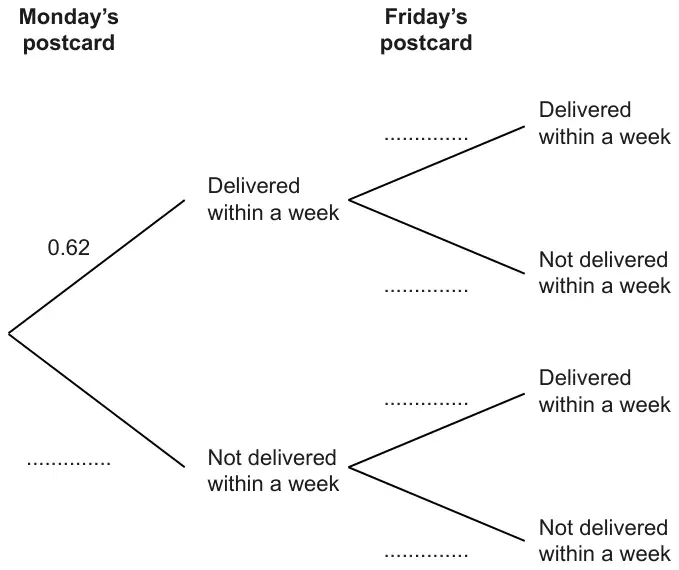
7 The probability that any postcard posted in Portugal on Monday is delivered to the UK within a week is 0.62. The probability that any postcard posted in Portugal on Friday is delivered to the UK within a week is 0.41.
(a) Anna is on holiday in Portugal. She posts 15 postcards to the UK on Monday.
How many of her postcards can she expect to be delivered within a week? [2]
(b) Sergio is in Portugal. He posts one postcard to the UK on Monday. He posts another postcard to the UK on Friday.
(i) Complete the probability tree to show the possible outcomes for the postcards.[2]
(ii) Calculate the probability that only one of Sergio’s postcards is delivered within a week. [3]
Mark scheme (a)
Answer
Marks
Part marks and guidance
9
2
M1 for 15 × 0.62, possibly soi by 9.3
If 0 scored, then SC1 for 15 × 0.41 leading to 6 as final answer
Condone “9 or 10” as final answer for 2 marks if correct working is shown.
Mark scheme (b)
Answer
Marks
Part marks and guidance
(i) Monday: Not delivered within a week 0.38 Friday (on both pairs of branches): Delivered within a week 0.41, Not delivered within a week 0.59
2
B1 for 0.38 and at least one 0.59 seen on correct branches
(ii) 0.5216 or \(\dfrac{326}{625}\)
3
M2FT for (0.62 × their 0.59) + (their 0.38 × 0.41) oe or M1FT for (0.62 × their 0.59) soi by 0.3658 oe or (their 0.38 × 0.41) soi by 0.1558 oe
Condone 0.52 or 0.522 as final answer provided nfww
14 Adam has 10 sweets in a bag. 5 are cherry sweets, 4 are lemon sweets and 1 is an orange sweet.
Adam chooses a sweet at random from the bag and eats it. He then takes another sweet at random from the bag and eats it.
(a) Adam says
The probability that I choose two cherry sweets is \(\dfrac{25}{100}\).
He is incorrect. Explain his error. [2]
(b) Find the probability that the two sweets he chooses have different flavours. [4]
Mark scheme (a)
Answer
Marks
Part marks and guidance
It should have been \(\dfrac{5}{10} \times \dfrac{4}{9}\) oe isw
2
M1 for showing \(\dfrac{5}{10} \times \dfrac{5}{10}\) or \(\dfrac{1}{2} \times \dfrac{1}{2}\) or for explaining that he did not take account that there was one less sweet for the second choice oe
11 Reuben is playing a matching game with these cards.
He turns the cards over and shuffles them. Reuben takes a card and keeps it. He then takes a second card. If the cards are different, he wins the game.
(a) Complete this tree diagram to show the probabilities for each card picked in the game.[2]
(b) What is the probability that Reuben wins the game? [3]
Mark scheme (a)
Answer
Marks
Part marks and guidance
2
B1 for \(\dfrac{5}{9}\) and at least one fraction with denominator 8 for second card
Mark scheme (b)
Answer
Marks
Part marks and guidance
\(\dfrac{5}{9}\) oe
3
M2FT for \(\left(\dfrac{4}{9} \times \dfrac{5}{8}\right) + \left(\dfrac{5}{9} \times \dfrac{4}{8}\right)\) oe OR M1FT for \(\left(\dfrac{4}{9} \times \dfrac{5}{8}\right)\) or \(\left(\dfrac{5}{9} \times \dfrac{4}{8}\right)\) oe soi by \(\dfrac{20}{72}\) oe
(a) A hotel manager asked some people to choose their favourite breakfast fruit juice. They each chose one from Orange, Apple or Grapefruit.
20 men chose Orange
Equal numbers of men chose Apple and Grapefruit.
10 women chose Orange
Twice as many women chose Apple as Grapefruit.
Use this information to complete the frequency tree.
[4]
(b) In one week 200 men have breakfast at the hotel.
(i) How many men may be expected to drink Orange? [1]
(ii) Give one reason why the number of men who drink Orange in this week may be different to your answer to part (b)(i). [1]
Mark scheme (a)
Answer
Marks
Part marks and guidance
[total] 90 [men] Apple 15, Grapefruit 15 [women] Apple 20, Grapefruit 10
4
B3 for 4 correct or B2 for 3 correct or B1 for 2 correct
If 0 scored SC1 for their apple = 2 \(\times\) their grapefruit
Mark scheme (b)
Answer
Marks
Part marks and guidance
(i) 80
1
(ii) Orange juice might have run out or 50 is a small sample oe [so may not be representative] These are different men so may make different choices oe Scaling may not produce the exact number
1
Any valid practical reason. Eg running out, (others) being promoted.
Any valid statistical reason Eg Choices may be in different proportion [in this group]. Expectation so may be different
Do not accept any suggestion that men may have changed their mind.
Mark the best part of the statement and ignore any non-contradictory parts
19 Kirsty either travels by bus or walks when she visits the shops. The probability that she catches the bus to the shops is 0.3. The probability that she catches the bus from the shops is 0.8.
(a) Complete the tree diagram. [2]
(b) Show that the probability that Kirsty walks at least one way is 0.76. [2]
Mark scheme (a)
Answer
Marks
Part marks and guidance
0.7
1
0.8, 0.2, 0.8, 0.2
1
Mark scheme (b)
Answer
Marks
Part marks and guidance
0.76 with a complete correct method
2
M1 for one correct product from their probabilities
e.g \(1 - 0.24 = 0.76\) or \(0.06 + 0.56 + 0.14 = 0.76\) Marks may be awarded for work on the diagram
13 Rashid drives his car along a road passing through two sets of traffic lights. The tree diagram shows the probabilities of the lights being red when he reaches them.
(a) Complete the tree diagram. [1]
(b) Write down the probability that the first set is not red. [1]
(c) Given that the first set is red, write down the probability that the second set is not red. [1]
(d) Work out the probability that both sets are not red. [2]
(e) Work out the probability that at least one set is not red. [3]
Mark scheme (a)
Answer
Marks
Part marks and guidance
[0].4, [0].3 and [0].8 oe in the correct places
1
Accept equivalent fractions or percentages with % sign in each part and FT their tree diagram only if (a) scores 0 marks
Mark scheme (b)
Answer
Marks
Part marks and guidance
[0].4 or \(\frac{2}{5}\) oe
1
FTtheir tree diagram
accept 40%: condone \(\frac{.4}{1}\), penalise wrong form once eg 4 : 10, 4 in 10
Mark scheme (c)
Answer
Marks
Part marks and guidance
[0].7 or \(\frac{7}{10}\) oe
1
accept 70%
Mark scheme (d)
Answer
Marks
Part marks and guidance
[0].08 or \(\frac{2}{25}\) oe
2
FT their tree diagram for 2 marks M1 for their[0].4 × [0].2
accept 8% and working may be in the tree
Mark scheme (e)
Answer
Marks
Part marks and guidance
[0].82 or \(\frac{41}{50}\) oe
3
FT their tree diagram for 3 marks
accept any correct method and working may be in tree
M2 for 1 – [0].6 × their [0].3 or [0].6 × [0].7 + their [0].4 × their [0].8 + their [0].4 × [0].2 oe soi
implied by 1 - [0].18 implied by [0].42 + [0].32 + [0].08
or
M1 for [0].6 × their [0].3 or two of [0].6 × [0].7, their [0].4 × their [0].8, their [0].4 × [0].2 oe soi
implied by [0].18 implied by two of [0].42, [0].32, [0].08
FT ‘their \(\dfrac{1}{5}\) and \(\dfrac{4}{5}\)’ provided they add to 1 M1 for sight of \(\frac{9}{10} \times \frac{4}{5}\) or \(\frac{1}{10} \times \frac{1}{5}\) oe
FT ‘their \(\frac{1}{5}\) and \(\frac{4}{5}\)’ provided they add to 1 M1 for sight of \(\frac{9}{10}\times\frac{4}{5}\) or \(\frac{1}{10}\times\frac{1}{5}\) oe
19. For her lunch, Gina sometimes eats a salad and sometimes drinks a coffee. The probability she eats a salad for lunch on a given day is 0·4. The probability she drinks a coffee on a given day is 0·25. Eating a salad for lunch and drinking a coffee are independent.
(a) Complete the following tree diagram. [2]
(b) Calculate the probability that, on a given day, Gina does not eat a salad for lunch but does drink a coffee. [2]
Mark scheme (a)
Scheme
Marks
Comments
Correctly completing the tree diagram 0.6, 0.75, 0.25, 0.75 oe
B2
B1 for a correct pair of branches (total 1)
Mark scheme (b)
Scheme
Marks
Comments
0.6 × 0.25
M1
FT their tree diagram provided their values are between 0 and 1
= 0.15 oe
A1
FT Ignore incorrect conversion of ‘their 0.15’ to another form if the correct answer seen. Do not ignore further calculations.
4. For her lunch, Gina sometimes eats a salad and sometimes drinks a coffee. The probability she eats a salad for lunch on a given day is 0·4. The probability she drinks a coffee on a given day is 0·25. Eating a salad for lunch and drinking a coffee are independent.
(a) Complete the following tree diagram. [2]
(b) Calculate the probability that, on a given day, Gina does not eat a salad for lunch but does drink a coffee. [2]
Mark scheme (a)
Scheme
Marks
Comments
Correctly completing the tree diagram 0.6, 0.75, 0.25, 0.75 oe
B2
B1 for a correct pair of branches (total 1)
Mark scheme (b)
Scheme
Marks
Comments
\(0.6\times0.25\)
M1
FT their tree diagram provided their values are between 0 and 1
= 0.15 oe.
A1
FT Ignore incorrect conversion of ‘their 0.15’ to another form if the correct answer seen. Do not ignore further calculations.
23. The probability that Kathy cycles to work on Monday is 0·6. If she cycles to work on Monday, the probability that she cycles to work on Tuesday is 0·3. If she does not cycle to work on Monday, the probability that she does not cycle to work on Tuesday is 0·1.
(a) Complete the tree diagram. [1]
(b) Calculate the probability that Kathy cycles to work on both Monday and Tuesday. [2]
(c) Calculate the probability that Kathy does not cycle to work on either day. [2]
Mark scheme (a)
Scheme
Marks
Comments
0.7 AND 0.9 correctly placed
B1
Mark scheme (b)
Scheme
Marks
Comments
0.6 × 0.3 oe
M1
0.18 oe
A1
ignore attempts to convert to a different form; ignore embellishments such as unlikely, even if incorrect
Mark scheme (c)
Scheme
Marks
Comments
0.4 × 0.1 oe
M1
0.04 oe
A1
ignore attempts to convert to a different form; ignore embellishments such as unlikely, even if incorrect
5. The probability that Kathy cycles to work on Monday is 0·6. If she cycles to work on Monday, the probability that she cycles to work on Tuesday is 0·3. If she does not cycle to work on Monday, the probability that she does not cycle to work on Tuesday is 0·1.
(a) Complete the tree diagram. [1]
(b) Calculate the probability that Kathy cycles to work on both Monday and Tuesday. [2]
(c) Calculate the probability that Kathy does not cycle to work on either day. [2]
Mark scheme (a)
Scheme
Marks
Comments
0.7 AND 0.9 correctly placed
B1
Mark scheme (b)
Scheme
Marks
Comments
0.6 × 0.3 oe
M1
0.18 oe
A1
ignore attempts to convert to a different form; ignore embellishments such as unlikely, even if incorrect
Mark scheme (c)
Scheme
Marks
Comments
0.4 × 0.1 oe
M1
0.04 oe
A1
ignore attempts to convert to a different form; ignore embellishments such as unlikely, even if incorrect
(a) Rita has a box containing 12 buttons, 5 are white (W) and the rest are blue (B). Rita takes 2 buttons from the box at random, without replacement.
Complete the tree diagram. [3]
(b) Calculate the probability that at least one of the buttons Rita takes from the box is white. [2]
(c) Rita puts the 2 buttons back into the box. She then takes 3 buttons from the box at random, without replacement.
What is the probability that the second and the third buttons she takes are both blue? [3]
Mark scheme (a)
Scheme
Marks
Comments
Correct tree diagram e.g.
B3
B1 for left hand branches correct FT ‘their \(\dfrac{5}{12}\) or \(\dfrac{7}{12}\)’ B1 FT for top right branches correct B1 FT for bottom right branches correct
Allow equivalent fractions in all cases.
If rounded decimals used here e.g. 0.42, 0.58, 0.36, 0.64, 0.45 and 0.55 award B1 here and FT in (b) and (c) for M marks only.
FT ‘their probabilities’ providing at least B1 awarded in (a)
\(\dfrac{90}{132}\) or \(\dfrac{15}{22}\) oe
A1
FT ‘their tree diagram’
If no marks award SC1 for the correct sum of two of the required products e.g for: \(\frac{5}{12} \times \frac{7}{11} + \frac{7}{12} \times \frac{5}{11} = \)\(\frac{70}{132}\) oe
Corrected by Westie's Workshop
The board's mark scheme printed “\(\frac{70}{108}\)”. Changed to “\(\frac{70}{132}\)” because \(\frac{5}{12} \times \frac{7}{11} + \frac{7}{12} \times \frac{5}{11} = \frac{35}{132} + \frac{35}{132} = \frac{70}{132}\).
Original: see the board's mark scheme PDF (link above).
15. Vera has a pot containing 4 red grapes and 6 green grapes. She takes a grape at random and eats it. She then takes another grape at random and eats it.
(a) Complete the probability tree to show this information. [3]
(b) Work out the probability that the second grape Vera eats is green. [3]
Mark scheme (a)
Scheme
Marks
Comments
Correct tree diagram
B3
B1 for left hand branches correct B1 for top right branches correct B1 for bottom right branches correct
Allow equivalent fractions or exact decimals in all cases.
If no marks then SC1 for two correct probabilities
CAO; Ignore any attempts to cancel or decimalise after a correct answer seen \(\dfrac{54}{90}\) implies 3 marks but an answer of \(\dfrac{6}{10}\) or \(\dfrac{3}{5}\) without working earns 3 marks only if a correct tree seen in part (a).
12. In November 2018, a survey was completed by all the students in Year 11 at Thomas Bees Academy. Students were asked their age and whether they had any part-time work. Some of this information is shown in the frequency tree below.
(a) How many of the students were aged 15 in November 2018? [1]
(b) In total, how many of the students do not have any part-time work? [2]
(c) The same survey was repeated in April 2019. No students had joined or left Year 11. The number of students aged 15 who had part-time work was only 23. Explain why this change may have happened. [1]
Mark scheme (a)
Scheme
Marks
Comments
120
B1
Mark scheme (b)
Scheme
Marks
Comments
(40 – 13 + 85) = 112
B2
B1 for sight of 27 or the total of ‘their 40 – 13’ + 85
Mark scheme (c)
Scheme
Marks
Comments
A valid explanation e.g. ‘more of the students are aged 16’ or ‘students are not working as they are revising’
(a) Albert sells bird food in 28·8 kg sacks. The bird food is a mix of millet, peanuts and sunflower seeds. It contains, by mass, the millet, peanuts and sunflower seeds in the ratio 4 : 5 : 7.
To make the bird food mix, Albert pays
95p per kg for millet,
£1.04 per kg for peanuts, and
75p per kg for sunflower seeds.
On Friday, Albert sold twelve 28·8 kg sacks of bird food for £29.99 each.
How much profit did Albert make from selling the bird food on Friday? [5]
(b) Nicole and Arthur share a house with a garden.
The probability that Nicole feeds the birds on a Saturday is 0·65. When Nicole does not feed the birds, the probability that Arthur feeds the birds is 0·72.
Arthur says to Nicole,
‘The probability that the birds are not fed in our garden on a Saturday is less than 10%.’
Show that Arthur is correct. You must show all your working. [4]
Mark scheme (a)
Scheme
Marks
Comments
4 × 95(p) + 5 × (£)1.04 + 7 × 75(p)
M1
Irrespective of place value (= £3.80 + £5.20 + £5.25 = £14.25)
\(\times\ 28.8 \div (4+5+7)\)
m1
(£)25.65
A1
If units are given they must be correct
(Profit =) ((£)29.99 − (£)25.65) × 12
m1
(=£4.34 × 12) FT use of ‘their £25.65’ provided at least M1 previously awarded
15. At breakfast, the probability that Stefan has a bowl of cereal is 0·7. The probability of Stefan having a slice of toast for breakfast is independent of him having a bowl of cereal. The probability that Stefan has a bowl of cereal and a slice of toast is 0·28.
(a) Complete the tree diagram. [4]
(b) Find the probability that Stefan has neither cereal nor toast for breakfast. [2]
Mark scheme (a)
Scheme
Marks
Comments
0.3 indicated for no cereal
B1
In working or on tree
Idea \(0.7 \times \ldots = 0.28\)
M1
P(toast) = 0.4
A1
In working or on tree
Second branches 0.4 0.6 0.4 0.6
B1
FT from their P(toast) provided M1 awarded
Mark scheme (b)
Scheme
Marks
Comments
\(0.3 \times 0.6\)
M1
FT ‘their 0.3’ × ‘their 0.6’ from their lowest branches in (a)
19. A bag contains 5 red balls and 4 blue balls. Megan chooses a ball from the bag at random. She replaces the ball in the bag. Then she chooses a second ball from the bag at random.
(a) Complete the tree diagram below. [2]
(b) Find the probability that Megan chooses two balls of the same colour. [3]
Mark scheme (a)
Scheme
Marks
Comments
Complete diagram
B2
Award B1 for any one of the following:
\(\frac{4}{9}\) or equivalent on ‘Blue’ Ball 1 branch
2 out of the 3 correct Ball 2 branches.
Mark scheme (b)
Scheme
Marks
Comments
Sight of \(\frac{5}{9} \times \frac{5}{9}\) (= 0.308(6..)) OR \(\frac{4}{9} \times \frac{4}{9}\) (= 0.197(5..)) or equivalent
B1
Check diagram for answers. 0·55(5…) × 0·55(5…) OR 0·44(4…) × 0·44(4…) Award B1 for an appropriate sight of any one of the following:
\(\frac{25}{81}\) or 0·308(6..) or 0·31 or 0·3
\(\frac{16}{81}\) or 0·197(5..) or 0·2
FT ‘their \(\frac{4}{9}\)’ from Blue Ball 1 branch, only if between 0 and 1. FT ‘their \(\frac{4}{9}\)’ from Blue Ball 2 branch, only if between 0 and 1.
\(\frac{5}{9} \times \frac{5}{9} + \frac{4}{9} \times \frac{4}{9}\) or equivalent
M1
0·55(5…) × 0·55(5…) + 0·44(4…) × 0·44(4…) Award M1 for sight of \(\frac{25}{81} + \frac{16}{81}\). FT ‘their \(\frac{5}{9} \times \frac{5}{9}\)’ + ‘their \(\frac{4}{9} \times \frac{4}{9}\)‘, provided both less than 1.
The addition of both single fractions (or products) can be implied by an appropriate sight of \(\frac{\text{sum of numerators}}{\text{sum of denominators}}\).
\(\frac{41}{81}\) ISW or 0·506(…) or equivalent
A1
CAO for ‘their tree diagram’. Allow answers in the range 0·505 to 0·507 inclusive or equivalent. Allow an answer of 0·51 or equivalent. Only allow 0·5 provided a more accurate answer has been seen (e.g. \(\frac{41}{81}\) , 0·506(…)).
Only FT provided answer is less than 1.
19.(b) Alternative method
Scheme
Marks
Comments
1 – \(\left[\frac{5}{9} \times \frac{4}{9} + \frac{4}{9} \times \frac{5}{9}\right]\) or 1 – \(\left[2 \times \frac{5}{9} \times \frac{4}{9}\right]\) or equivalent
M2
Check diagram for answers. (= 1 – \(\left[\frac{20}{81} + \frac{20}{81}\right] = 1 - \frac{40}{81}\) or equivalent)
FT ‘their \(\frac{4}{9}\)’ from Blue Ball 1 branch, only if between 0 and 1. FT ‘their \(\frac{4}{9}\)’ from Blue Ball 2 branch, only if between 0 and 1.
CAO for ‘their tree diagram’. Allow answers in the range 0·505 to 0·507 inclusive or equivalent. Allow an answer of 0·51 or equivalent. Only allow 0·5 provided a more accurate answer has been seen (e.g. \(\frac{41}{81}\) , 0·506(…)). Only FT provided answer is less than 1.
8. A bag contains 5 red balls and 4 blue balls. Megan chooses a ball from the bag at random. She replaces the ball in the bag. Then she chooses a second ball from the bag at random.
(a) Complete the tree diagram below. [2]
(b) Find the probability that Megan chooses two balls of the same colour. [3]
Mark scheme (a)
Scheme
Marks
Comments
Complete diagram
B2
Award B1 for any one of the following:
\(\dfrac{4}{9}\) or equivalent on ‘Blue’ Ball 1 branch
2 out of the 3 correct Ball 2 branches.
Mark scheme (b)
Scheme
Marks
Comments
Sight of \(\dfrac{5}{9}\) × \(\dfrac{5}{9}\) (= 0.308(6..)) OR \(\dfrac{4}{9}\) × \(\dfrac{4}{9}\) (= 0.197(5..)) or equivalent
B1
Check diagram for answers. 0·55(5…) × 0·55(5…) OR 0·44(4…) × 0·44(4…) Award B1 for an appropriate sight of any one of the following:
\(\dfrac{25}{81}\) or 0·308(6..) or 0·31 or 0·3
\(\dfrac{16}{81}\) or 0·197(5..) or 0·2
FT ‘their \(\dfrac{4}{9}\)’ from Blue Ball 1 branch, only if between 0 and 1. FT ‘their \(\dfrac{4}{9}\)’ from Blue Ball 2 branch, only if between 0 and 1.
\(\dfrac{5}{9}\) × \(\dfrac{5}{9}\) + \(\dfrac{4}{9}\) × \(\dfrac{4}{9}\) or equivalent
M1
0·55(5…) × 0·55(5…) + 0·44(4…) × 0·44(4…) Award M1 for sight of \(\dfrac{25}{81}\) + \(\dfrac{16}{81}\). FT ‘their \(\dfrac{5}{9}\) × \(\dfrac{5}{9}\)’ + ‘their \(\dfrac{4}{9}\) × \(\dfrac{4}{9}\)’, provided both less than 1.
The addition of both single fractions (or products) can be implied by an appropriate sight of \(\dfrac{\textit{sum of numerators}}{\textit{sum of denominators}}\).
\(\dfrac{41}{81}\) ISW or 0·506(…) or equivalent
A1
CAO for ‘their tree diagram’. Allow answers in the range 0·505 to 0·507 inclusive or equivalent. Allow an answer of 0·51 or equivalent. Only allow 0·5 provided a more accurate answer has been seen (e.g. \(\dfrac{41}{81}\), 0·506(…)).
Only FT provided answer is less than 1.
Alternative method
Scheme
Marks
Comments
1 – [\(\dfrac{5}{9}\) × \(\dfrac{4}{9}\) + \(\dfrac{4}{9}\) × \(\dfrac{5}{9}\)] or 1 – [2 × \(\dfrac{5}{9}\) × \(\dfrac{4}{9}\)] or equivalent
M2
Check diagram for answers. (= 1 – [\(\dfrac{20}{81}\) + \(\dfrac{20}{81}\)] = 1 – \(\dfrac{40}{81}\) or equivalent)
FT ‘their \(\dfrac{4}{9}\)’ from Blue Ball 1 branch, only if between 0 and 1. FT ‘their \(\dfrac{4}{9}\)’ from Blue Ball 2 branch, only if between 0 and 1.
CAO for ‘their tree diagram’. Allow answers in the range 0·505 to 0·507 inclusive or equivalent. Allow an answer of 0·51 or equivalent. Only allow 0·5 provided a more accurate answer has been seen (e.g. \(\dfrac{41}{81}\), 0·506(…)). Only FT provided answer is less than 1.
15. Evan and Jane each shoot one arrow at a target. The probability that Evan hits the centre of the target is 0·4. The probability that Jane hits the centre of the target is 0·45.
(a) Complete the tree diagram below. [3]
(b) Find the probability that Evan and Jane both hit the centre of the target. [2]
Mark scheme (a)
Scheme
Marks
Comments
0·6 or equivalent on correct Evan branch.
B1
0·45 and 0·55 or equivalent correctly shown on both pairs for Jane.
B2
Award B1 for one of the following:
0·45 and 0·55 or equivalent correctly shown on one pair of Jane’s branches only
0·45 and 0·55 or equivalent consistently reversed on all Jane branches.
Notes
The answers on the tree diagram were printed in red in the original; they are shown in black here.
Mark scheme (b)
Scheme
Marks
Comments
0·4 × 0·45 or equivalent
M1
FT 0·4 × ‘Jane’s probability of hitting the centre’ provided less than 1.
6. Evan and Jane each shoot one arrow at a target. The probability that Evan hits the centre of the target is 0·4. The probability that Jane hits the centre of the target is 0·45.
(a) Complete the tree diagram below. [3]
(b) Find the probability that Evan and Jane both hit the centre of the target. [2]
Mark scheme (a)
Scheme
Marks
Comments
0·6 or equivalent on correct Evan branch.
B1
0·45 and 0·55 or equivalent correctly shown on both pairs for Jane.
B2
Award B1 for one of the following:
0·45 and 0·55 or equivalent correctly shown on one pair of Jane’s branches only
0·45 and 0·55 or equivalent consistently reversed on all Jane branches.
Mark scheme (b)
Scheme
Marks
Comments
0·4 × 0·45 or equivalent
M1
FT 0·4 × ‘Jane’s probability of hitting the centre’ provided less than 1
15. A group of people hired two buses, Bus A and Bus B, to take them home from a party. Bus A left the party at 11:00 p.m. Bus B left the party at midnight.
A person from the group is chosen at random. The probability that this person left the party on Bus A is \(\dfrac{3}{8}\).
The probability that this person sat on the left-hand side of the bus is equal to the probability that this person sat on the right-hand side.
(a) Complete the following tree diagram. [2]
(b) What is the probability that this person sat on the right-hand side of the bus that left at midnight? [2]
Mark scheme (a)
Scheme
Marks
Comments
\(\dfrac{5}{8}\) on ‘Bus B’ branch.
B1
Numerator and denominator must be integers. Allow any equivalent to \(\dfrac{5}{8}\) e.g. 0·625. Do not allow 0·63.
\(\dfrac{1}{2}\) or \(\dfrac{4}{8}\) or 0·5 on all ‘seat branches’
B1
Allow any equivalent to \(\dfrac{1}{2}\).
Mark scheme (b)
Scheme
Marks
Comments
\(\dfrac{5}{8} \times \dfrac{1}{2}\) or equivalent
M1
FT ‘their \(\dfrac{5}{8}\)’ × ‘their \(\dfrac{1}{2}\)’ provided both values < 1.
\(= \dfrac{5}{16}\) or \(\dfrac{20}{64}\) or \(\dfrac{25}{80}\) or equivalent ISW
A1
Do not allow rounded or truncated answers if decimal given. Numerator and denominator must be integers.
6. A group of people hired two buses, Bus A and Bus B, to take them home from a party. Bus A left the party at 11:00 p.m. Bus B left the party at midnight.
A person from the group is chosen at random. The probability that this person left the party on Bus A is \(\dfrac{3}{8}\).
The probability that this person sat on the left-hand side of the bus is equal to the probability that this person sat on the right-hand side.
(a) Complete the following tree diagram. [2]
(b) What is the probability that this person sat on the right-hand side of the bus that left at midnight? [2]
Mark scheme (a)
Scheme
Marks
Comments
\(\dfrac{5}{8}\) on ‘Bus B’ branch.
B1
Numerator and denominator must be integers. Allow any equivalent to \(\dfrac{5}{8}\) e.g. 0·625. Do not allow 0·63.
\(\dfrac{1}{2}\) or \(\dfrac{4}{8}\) or 0·5 on all ‘seat branches’.
B1
Allow any equivalent to \(\dfrac{1}{2}\).
Mark scheme (b)
Scheme
Marks
Comments
\(\dfrac{5}{8} \times \dfrac{1}{2}\) or equivalent
M1
FT ‘their \(\dfrac{5}{8}\)’ × ‘their \(\dfrac{1}{2}\)’ provided both values < 1.
= \(\dfrac{5}{16}\) or \(\dfrac{20}{64}\) or \(\dfrac{25}{80}\) or equivalent. ISW
A1
Do not allow rounded or truncated answers if decimal given. Numerator and denominator must be integers.
8. Beti walks her dog to a local park and back home every day. She can either walk along a footpath or along a pavement at the side of a road.
The probability that Beti walks to the park along the footpath is \(\dfrac{3}{5}\).
The probability that Beti walks home from the park along the road is \(\dfrac{2}{7}\).
Her decisions on which routes to walk to and from the park are independent of each other.
(a) Complete the tree diagram below. [2]
(b) Find the probability that Beti walks to and from the park along the footpath. [2]
Mark scheme (a)
Scheme
Marks
Comments
Complete diagram
B2
If B2 not awarded, award B1 for one of the following:
2/5 or equivalent on Road to the park branch
5/7 on a Footpath from the park branch.
Mark scheme (b)
Scheme
Marks
Comments
\(\dfrac{3}{5} \times \dfrac{5}{7}\) or equivalent
M1
FT \(\dfrac{3}{5}\) × ‘their \(\dfrac{5}{7}\)’ (on ‘uppermost footpath home branch’) provided less than 1.
\(\dfrac{15}{35}\) or equivalent ISW
A1
Corrected by Westie's Workshop
The board's mark scheme printed “FT \(\dfrac{3}{7}\) × ‘their \(\dfrac{5}{7}\)’”. Changed to “FT \(\dfrac{3}{5}\) × ‘their \(\dfrac{5}{7}\)’” because the probability of walking to the park along the footpath is \(\dfrac{3}{5}\), and only the second fraction (‘their \(\dfrac{5}{7}\)’) can be followed through.
Original: see the board's mark scheme PDF (link above).
16. A group of people have put their names forward to carry the Welsh flag at a sporting event. Each person lives in North Wales, Mid Wales or South Wales.
One person from the group is chosen at random. The probability of choosing a person who lives in North Wales is 0·3. The probability of choosing a person who lives in Mid Wales is 0·25.
The probability of choosing a person who is under 18 years old is 0·2.
The people’s ages are independent of where they live.
(a) Complete the tree diagram shown below. [3]
(b) What is the probability of choosing a person who lives in South Wales and is under 18 years old? [2]
Mark scheme (a)
Scheme
Marks
Comments
P(South Wales = ) 1 − 0·3 − 0·25 = 0·45 AND shown on relevant branch.
M1 A1
0·2 and 0·8 shown on all relevant branches.
B1
Mark scheme (b)
Scheme
Marks
Comments
0·45 × 0·2 or equivalent = 0·09 or equivalent
M1 A1
FT ‘their completed tree diagram’ for values 0<p<1.
7. A group of people have put their names forward to carry the Welsh flag at a sporting event. Each person lives in North Wales, Mid Wales or South Wales.
One person from the group is chosen at random. The probability of choosing a person who lives in North Wales is 0·3. The probability of choosing a person who lives in Mid Wales is 0·25.
The probability of choosing a person who is under 18 years old is 0·2.
The people’s ages are independent of where they live.
(a) Complete the tree diagram shown below. [3]
(b) What is the probability of choosing a person who lives in South Wales and is under 18 years old? [2]
Mark scheme (a)
Scheme
Marks
Comments
P(South Wales = ) \(1 - 0{\cdot}3 - 0{\cdot}25\) \(= 0{\cdot}45\) AND shown on relevant branch.
M1 A1
0·2 and 0·8 shown on all relevant branches.
B1
Mark scheme (b)
Scheme
Marks
Comments
\(0{\cdot}45 \times 0{\cdot}2\) or equivalent \(= 0{\cdot}09\) or equivalent
M1 A1
FT ‘their completed tree diagram’ for values \(0<p<1\).
A working day is chosen at random. From keeping a record over the last year, Alice knows that, for this working day,
the probability that she travels to work by car is 0·7,
the probability that she arrives at work before 8:00 a.m. is 0·4,
her time of arrival is independent of how she travels to work.
(a) Using the above information, draw and fully label a complete tree diagram. You must include all probabilities. [4]
(b) What is the probability that, on the randomly-chosen working day, Alice travels to work by car and arrives before 8:00 a.m.? [2]
Mark scheme (a)
Scheme
Marks
Comments
Correct framework
B1
Suitable labelling on both 1st pair of branches AND on both of at least one pair of 2nd set of branches. e.g. ‘Car’, ‘No car’, ‘Before 8’, ‘After 8’. OR Titles of ‘Car’ and ‘Before 8’ with branch endings of ‘Yes’ and ‘No’.
B1
Accept any unambiguous wording.
Correct probabilities on first pair of branches 0·7 AND 0·3 (for ‘Car’, ‘No car’) OR 0·4 AND 0·6 (for ‘Before 8’, ‘After 8’)
B1
Must be consistent with their labelling. Allow this B1 if no headings given, unless contradicted by, or inconsistent with, further labelling.
Correct probabilities on second two sets of branches 0·4 AND 0·6 correctly placed (following 0·7 and 0·3) OR 0·7 AND 0·3 correctly placed (following 0·4 and 0·6)
B1
Allow this B1 if no headings given, unless contradicted by, or inconsistent with, further labelling.
Allow this B1 if only shown on one set of branches. Provided not contradicted on the other set of branches.
Mark scheme (b)
Scheme
Marks
Comments
0·7 × 0·4 or equivalent.
M1
No FT.
= 0·28 or equivalent.
A1
M1A0 for a final answer of 0·28%. Mark final answer.
17. Dylan is having a weekend break in Wrexham. The probability that he will visit Erddig Gardens is 0·7. The probability of Dylan going to the Bersham Heritage Centre is independent of him visiting Erddig Gardens.
The probability that he visits Erddig Gardensand goes to the Bersham Heritage Centre is 0·28.
(a) Complete the following tree diagram. [4]
(b) Calculate the probability that Dylan visits Erddig Gardens but does not go to the Bersham Heritage Centre. [2]
Mark scheme (a)
Scheme
Marks
Comments
0·3 shown for ‘Does not visit ‘Erddig Gardens’.
B1
Use of 0·7 × …… = 0·28
M1
Implied by sight of 0·4 (on ‘top branch’ of the four on the right.)
P(goes to ‘Bersham Heritage Centre’) = 0.4
A1
Second set of branches 0·4, 0·6, 0·4, 0·6
A1
FT ‘their 0·4’ BUT dependent on M1 gained. (i.e. M0A0A0 for 0·28 and 0·72 on branches.)
6. Dylan is having a weekend break in Wrexham. The probability that he will visit Erddig Gardens is 0·7. The probability of Dylan going to the Bersham Heritage Centre is independent of him visiting Erddig Gardens.
The probability that he visits Erddig Gardensand goes to the Bersham Heritage Centre is 0·28.
(a) Complete the following tree diagram. [4]
(b) Calculate the probability that Dylan visits Erddig Gardens but does not go to the Bersham Heritage Centre. [2]
Mark scheme (a)
Scheme
Marks
Comments
0·3 shown for Does not visit ‘Erddig Gardens’.
B1
Use of 0·7 × …… = 0·28
M1
Implied by sight of 0·4 (on ‘top branch’ of the four on the right)
P(goes to ‘Bersham Heritage Centre’) = 0.4
A1
Second set of branches 0·4, 0·6, 0·4, 0·6
A1
F.T. ‘their 0·4’ BUT dependent on M1 gained. (i.e. M0A0A0 for 0·28 and 0·72 on branches.)
Corrected by Westie's Workshop
The board's mark scheme printed “‘Does not visit ‘Erddig Gardens’.”. Changed to “Does not visit ‘Erddig Gardens’.” because the first opening quotation mark has no matching closing mark (only the place name is quoted).
Original: see the board's mark scheme PDF (link above).
Mark scheme (b)
Scheme
Marks
Comments
0·7 × 0·6
M1
F.T. 0·7 × ‘their 0·6’ only if 0 < ‘their 0·6’ < 1
18. Leah is visiting Cardiff. The probability that she will go on a tour bus is 0·3. The probability of Leah seeing a show at the Millennium Centre is independent of her going on a tour bus.
The probability that she goes on a tour bus and sees a show at the Millennium Centre is 0·24.
(a) Complete the following tree diagram. [4]
(b) Calculate the probability that Leah does not go on a tour bus and does not see a show at the Millennium Centre. [2]
Mark scheme (a)
Scheme
Marks
Comments
0·7 shown for ‘Does not go on tour bus’.
B1
Use of 0·3 × …… = 0·24
M1
P(sees show) = 0·8
A1
Allow M1A1 if 0·8 seen on one of the ‘sees show’ branches.
Second set of branches 0·8, 0·2, 0·8, 0·2
A1
FT ‘their 0·8’ only if M1 awarded. (0·24, 0·76, 0·24, 0·76 is M0A0A0)
8. Leah is visiting Cardiff. The probability that she will go on a tour bus is 0·3. The probability of Leah seeing a show at the Millennium Centre is independent of her going on a tour bus.
The probability that she goes on a tour bus and sees a show at the Millennium Centre is 0·24.
(a) Complete the following tree diagram. [4]
(b) Calculate the probability that Leah does not go on a tour bus and does not see a show at the Millennium Centre. [2]
Mark scheme (a)
Scheme
Marks
Comments
0·7 shown for ‘Does not go on tour bus’.
B1
Use of 0·3 × …… = 0·24
M1
P(sees show) = 0.8
A1
Allow M1A1 if 0·8 seen on one of the ‘sees show’ branches.
Second set of branches 0·8, 0·2, 0·8, 0·2
A1
FT ‘their 0·8’ only if M1 awarded. (0·24, 0·76, 0·24, 0·76 is M0A0A0)
17. Alwena regularly travels from Anglesey to Cardiff to attend meetings. For each meeting, she chooses one of three ways to travel: by plane, train or car.
The probability of a meeting being held on a Saturday is 0·08.
The probability that Alwena travels by plane to a meeting is 0·15. The probability that she travels by train is 0·45.
Her decision on how to travel is independent of the day on which the meeting is held.
(a) Complete the following tree diagram. [3]
(b) A meeting is chosen at random. Calculate the probability that the meeting is held on a Saturday and that Alwena travels by plane or by car. [3]
Mark scheme (a)
Scheme
Marks
Comments
0·92 written on the ‘Not a Saturday’ branch.
B1
Sight of 1 − 0·15 − 0·45 OR 0·4 or 0·40
B1
Allow this B1 if shown on working lines.
0·4(0) on both ‘car’ branches AND 0·15 AND 0·45 correctly shown on lower branches.
B1
Mark scheme (b)
Scheme
Marks
Comments
Sight of 0·08 × 0·15 OR 0·08 × 0·4 or equivalent.
B1
FT ‘their P(car)’ if <1.
(P(Sat and ‘plane or car’) =) 0·08 × 0·15 + 0·08 × 0·4 or equivalent
M1
0·08 × 0·55 implies previous B1.
= 0·044 or equivalent. ISW
A1
Alternative method
Scheme
Marks
Comments
(P(Sat and ‘plane or car’) =) 1 – (0·92 + 0·08 × 0·45) or equivalent
M2
FT ‘their 0·92’. M1 for intent P(Sat and ‘plane or car’) = 1 – P(‘not Saturday’) – P(‘Saturday and train’)
8. Alwena regularly travels from Anglesey to Cardiff to attend meetings. For each meeting, she chooses one of three ways to travel: by plane, train or car.
The probability of a meeting being held on a Saturday is 0·08.
The probability that Alwena travels by plane to a meeting is 0·15. The probability that she travels by train is 0·45.
Her decision on how to travel is independent of the day on which the meeting is held.
(a) Complete the following tree diagram. [3]
(b) A meeting is chosen at random. Calculate the probability that the meeting is held on a Saturday and that Alwena travels by plane or by car. [3]
Mark scheme (a)
Scheme
Marks
Comments
0·92 written on the ‘Not a Saturday’ branch.
B1
Sight of 1 − 0·15 − 0·45 OR 0·4 or 0·40
B1
Allow this B1 if shown on working lines.
0·4(0) on both ‘car’ branches AND 0·15 AND 0·45 correctly shown on lower branches.
B1
Mark scheme (b)
Scheme
Marks
Comments
Sight of 0·08 × 0·15 OR 0·08 × 0·4 or equivalent.
B1
FT ‘their P(car)’ if <1.
(P(Sat and ‘plane or car’) =) 0·08 × 0·15 + 0·08 × 0·4 or equivalent
M1
0·08 × 0·55 implies previous B1.
= 0·044 or equivalent. ISW
A1
Alternative method
Scheme
Marks
Comments
(P(Sat and ‘plane or car’) =) 1 – (0·92 + 0·08 × 0·45) or equivalent
M2
FT ‘their 0·92’. M1 for intent P(Sat and ‘plane or car’) = 1 – P(‘not Saturday’) – P(‘Saturday and train’)
16. Visitors to the top of Snowdon can either walk up the mountain or take the mountain railway from Llanberis. On a particular day, a visitor to the top of Snowdon is chosen at random. The probability that this person is female is 0·42. The probability that this person took the train is 0·35.
The decision to walk or take the train is independent of gender.
(a) Complete the tree diagram shown below. [3]
(b) The person chosen at random receives a gift voucher. What is the probability that this person is female and travelled up the mountain by train? [2]
Mark scheme (a)
Scheme
Marks
Comments
0·58 on ‘Male’ branch.
B1
0·65 and 0·35 correctly shown on both pairs of branches.
B2
B1 if correctly shown on one pair only. SC1 if 0·65 and 0·35 consistently reversed on all branches.
Mark scheme (b)
Scheme
Marks
Comments
0·42 × 0·35
M1
FT ‘their 0·35’ (on ‘uppermost train branch’) provided less than 1
6. Visitors to the top of Snowdon can either walk up the mountain or take the mountain railway from Llanberis. On a particular day, a visitor to the top of Snowdon is chosen at random. The probability that this person is female is 0·42. The probability that this person took the train is 0·35.
The decision to walk or take the train is independent of gender.
(a) Complete the tree diagram shown below. [3]
(b) The person chosen at random receives a gift voucher. What is the probability that this person is female and travelled up the mountain by train? [2]
Mark scheme (a)
Scheme
Marks
Comments
0·58 on ‘Male’ branch.
B1
0·65 and 0·35 correctly shown on both pairs of branches.
B2
B1 if correctly shown on one pair only. SC1 if 0·65 and 0·35 consistently reversed on all branches.
Mark scheme (b)
Scheme
Marks
Comments
0·42 × 0·35
M1
FT ‘their 0·35’ (on ‘uppermost train branch’) provided less than 1
16. All the members of a farming club visited the Royal Welsh Agricultural Show. They all travelled to the show either by bus or by car. None of them visited the show on more than one day. The decision to travel by car or by bus was independent of the day of the visit.
A member of the club was selected at random. The probability that this member travelled by bus was 0·87.
The probability that this member visited the show on the first day was \(\dfrac{2}{3}\).
(a) Complete the tree diagram shown below. [2]
(b) What is the probability that a member, chosen at random, was not one of those who travelled by bus on the first day of the show? [3]
8. All the members of a farming club visited the Royal Welsh Agricultural Show. They all travelled to the show either by bus or by car. None of them visited the show on more than one day. The decision to travel by car or by bus was independent of the day of the visit.
A member of the club was selected at random. The probability that this member travelled by bus was 0·87. The probability that this member visited the show on the first day was \(\dfrac{2}{3}\).
(a) Complete the tree diagram shown below. [2]
(b) What is the probability that a member, chosen at random, was not one of those who travelled by bus on the first day of the show? [3]
16. Alwyn often drives from Bangor to Cardiff. He always chooses one of two routes for these journeys. He either travels through Rhayader or through Hereford. The probability that he travels through Rhayader is 0·7.
Sometimes he decides to stop for a break during his journey. His decision is independent of the route he takes.
The probability that he travels through Rhayader and stops for a break is 0·42.
(a) Complete the following tree diagram. [4]
(b) Calculate the probability that Alwyn travels through Hereford but does not stop for a break. [2]
Mark scheme (a)
Scheme
Marks
Comments
Ribbon marking for 16(a) and 16(b). 0·3 on ‘Hereford’ branch.
B1
0·7 × P(Yes) = 0·42
M1
Allow their notation for P(Yes).
P(Yes) = 0·6
A1
0·6, 0·4, 0·6 and 0·4 correctly placed.
A1
F.T. ‘their P(Yes)’, if between 0 and 1 but not 0·5.
7. Alwyn often drives from Bangor to Cardiff. He always chooses one of two routes for these journeys. He either travels through Rhayader or through Hereford. The probability that he travels through Rhayader is 0·7.
Sometimes he decides to stop for a break during his journey. His decision is independent of the route he takes.
The probability that he travels through Rhayader and stops for a break is 0·42.
(a) Complete the following tree diagram. [4]
(b) Calculate the probability that Alwyn travels through Hereford but does not stop for a break. [2]
Mark scheme (a)
Scheme
Marks
Comments
0·3 on ‘Hereford’ branch.
B1
0·7 × P(Yes) = 0·42
M1
Allow their notation for P(Yes).
P(Yes) = 0·6
A1
0·6, 0·4, 0·6 and 0·4 correctly placed.
A1
F.T. ‘their P(Yes)’, if between 0 and 1 but not 0·5
We'd like to use Google Analytics cookies to count visits and see which pages help most. They're optional, and the site works exactly the same either way. Privacy policy