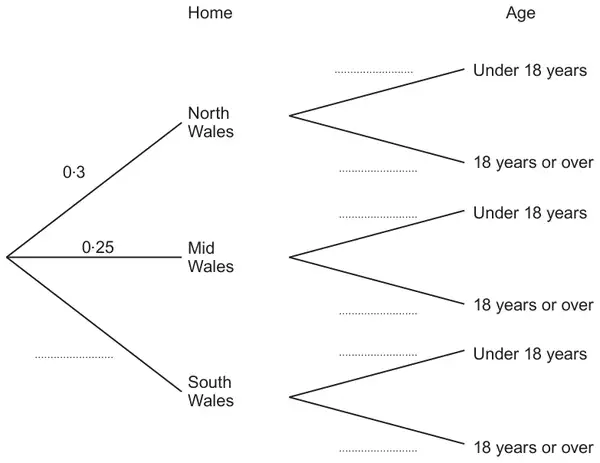
7. A group of people have put their names forward to carry the Welsh flag at a sporting event. Each person lives in North Wales, Mid Wales or South Wales.
One person from the group is chosen at random. The probability of choosing a person who lives in North Wales is 0·3. The probability of choosing a person who lives in Mid Wales is 0·25.
The probability of choosing a person who is under 18 years old is 0·2.
The people’s ages are independent of where they live.
(a) Complete the tree diagram shown below. [3]
(b) What is the probability of choosing a person who lives in South Wales and is under 18 years old? [2]
Mark scheme (a)
Scheme
Marks
Comments
P(South Wales = ) \(1 - 0{\cdot}3 - 0{\cdot}25\) \(= 0{\cdot}45\) AND shown on relevant branch.
M1 A1
0·2 and 0·8 shown on all relevant branches.
B1
Mark scheme (b)
Scheme
Marks
Comments
\(0{\cdot}45 \times 0{\cdot}2\) or equivalent \(= 0{\cdot}09\) or equivalent
M1 A1
FT ‘their completed tree diagram’ for values \(0<p<1\).
We'd like to use Google Analytics cookies to count visits and see which pages help most. They're optional, and the site works exactly the same either way. Privacy policy