B1: identifying that \(X\) can only take on the values 0, 1 and 2 (may be seen at end of tree diagram). If other values stated, they must be associated with a probability of 0.
M1: correct expression for \(\mathrm{P}(X = 0)\)
M1: correct expression for either \(\mathrm{P}(X = 1)\) or \(\mathrm{P}(X = 2)\)
A1: one correct probability Watch out for \(\dfrac{6}{8} \times \dfrac{5}{7} = \dfrac{15}{28}\) which is an incorrect attempt at \(\mathrm{P}(X = 0)\) and scores M0A0
A1: complete probability distribution, need not be in a table, but each value of \(x\) must be associated with its probability. Allow awrt 0.357, awrt 0.536, awrt 0.107
M1: identifying that the B(inomial) distribution with \(n = 10\) is appropriate here. If distribution not stated, may be implied by use of \((10\mathrm{C}r)p^r(1 - p)^{10 - r}\) or 0.981(57...)
M1: writing or using a correct probability statement
3. In an after-school club, students can choose to take part in Art, Music, both or neither.
There are 45 students that attend the after-school club. Of these
25 students take part in Art
12 students take part in both Art and Music
the number of students that take part in Music is \(x\)
(a) Find the range of possible values of \(x\) (2)
One of the 45 students is selected at random.
Event \(A\) is the event that the student selected takes part in Art.
Event \(M\) is the event that the student selected takes part in Music.
(b) Determine whether or not it is possible for the events \(A\) and \(M\) to be independent. (4)
Mark scheme (a)
Scheme
Marks
AO
45 – 25 = 20 or e.g. ‘\(25 \leqslant 13 + 12 + y \leqslant 45\)’
M1
2.1
\(12 \leqslant x \leqslant 32\)
A1
1.1b
(2)
Notes
M1: for attempting to find range for \(x\) or attempt to find the largest/smallest number of students that could study Music only. May be implied by one correct end point. Also may be implied with 20 given as an end point
A1: oe allow 12 – 32 or \(x \geqslant 12\) and \(x \leqslant 32\) \(12 \lt x \lt 32\) or \(x \geqslant 12\) or \(x \leqslant 32\) or \(x \geqslant 12, x \leqslant 32\) all score M1A0
Mark scheme (b)
Scheme
Marks
AO
To be independent \(\mathrm{P}(A) \times \mathrm{P}(M) = \mathrm{P}(A \text{ and } M)\)
M1
1.1a
\(\mathrm{P}(M) = \dfrac{\mathrm{P}(A \text{ and } M)}{\mathrm{P}(A)} = \dfrac{\frac{12}{45}}{\frac{25}{45}} = \dfrac{12}{25}\) or \(\dfrac{25}{45} \times \mathrm{P}(M) = \dfrac{12}{45}\)
or \(\dfrac{25}{45} \times \dfrac{x}{45} = \dfrac{12}{45}\) or \(\dfrac{25}{45} \times \dfrac{12 + y}{45} = \dfrac{12}{45}\)
A1
2.1
The number of students taking part in music would be \(\dfrac{12}{25} \times 45 = 21.6\) or The number of students taking part in music but not art would be \(y = 9.6\)
A1
1.1b
…so it is not possible for \(A\) and \(M\) to be independent (since it must be a whole number).
A1
2.2a
(4)
(6 marks)
Notes
M1: writing the definition of independence, must use \(A\) and \(M\) Allow any rearrangement Allow all three probabilities labelled followed by a correct equation/definition \(\mathrm{P}(A) = \dfrac{25}{45},\ \mathrm{P}(A \text{ and } M) = \dfrac{12}{45},\ \mathrm{P}(M) = \dfrac{x}{45}\) or \(\dfrac{12 + y}{45}\)
A1: \(\mathrm{P}(M) = 0.48\) oe or correct equation for \(\mathrm{P}(M)\), or \(x\) or \(y\) (allow any letter for \(y\)) Do not award this mark if working with numbers e.g. \(\mathrm{P}(A \text{ and } M) = 12\)
A1: (dependent on M1 only and does not imply first A1) 21.6 oe (also allow \(\dfrac{21.6}{45}\)) or 9.6 oe
A1: (dependent on all previous marks being scored) correct deduction from correct working. Ignore any reference to the range of values found in part (a).
SC: If M0 scored, allow access to 1st and 2nd A1 (to score maximum M0A1A1A0)
5. Manon has two biased spinners, one red and one green.
The random variable \(R\) represents the score when the red spinner is spun. The random variable \(G\) represents the score when the green spinner is spun.
The probability distributions for \(R\) and \(G\) are given below.
\(r\)
2
3
\(\mathrm{P}(R = r)\)
\(\dfrac{1}{4}\)
\(\dfrac{3}{4}\)
\(g\)
1
4
\(\mathrm{P}(G = g)\)
\(\dfrac{2}{3}\)
\(\dfrac{1}{3}\)
Manon spins each spinner once and adds the two scores.
(a) Find the probability that
(i) the sum of the two scores is 7
(ii) the sum of the two scores is less than 4 (3)
The random variable \(X = mR + nG\) where \(m\) and \(n\) are integers.
(b) Find the value of \(m\) and the value of \(n\) (5)
Mark scheme (a)
Scheme
Marks
AO
(i) Require \(R = 3\) and \(G = 4\) so probability is \(\dfrac{3}{4} \times \dfrac{1}{3}\)
M1
2.1
\(= \underline{\dfrac{1}{4}}\) or 0.25
A1
1.1b
(ii) [\(R\) must be 2 and \(G = 1\) so \(\dfrac{1}{4} \times \dfrac{2}{3}\)] \(= \underline{\dfrac{1}{6}}\)
A1
1.1b
(3)
Notes
(i) M1 for sight of \(\dfrac{3}{4} \times \dfrac{1}{3}\) or \(\dfrac{1}{4} \times \dfrac{2}{3}\) as a single product BUT allow e.g. \(\tfrac{3}{4}\times\tfrac{1}{3}+\tfrac{1}{3}\times\tfrac{3}{4}\) to score M1 However if the products are later added e.g. \(\tfrac{3}{4}\times\tfrac{1}{3}+\tfrac{1}{4}\times\tfrac{2}{3}\) it is M0 May be implied by one correct answer to (i) or (ii)
A1 for \(\dfrac{1}{4}\) or 0.25 or exact equivalent (allow 25%)
(ii) A1 for \(\dfrac{1}{6}\) or exact equivalent
Mark scheme (b)
Scheme
Marks
AO
\(\mathrm{P}(X = 50) = 0.25\) must mean \(R = 3\) and \(G = 4\) so \(3m + 4n = 50\)
M1 A1
3.1a 1.1b
\(\mathrm{P}(X = 20) = \tfrac{1}{6} \Rightarrow R = 2, G = 1\) so \(2m + n = 20\)
A1
2.1
Solving: \(3m + 4(20 - 2m) = 50\) (o.e.)
M1
1.1b
\(m = 6\) and \(n = 8\)
A1
3.2a
(5)
(8 marks)
Notes
For the 1st 4 marks condone incorrect labelling e.g. \(R\) for \(m\) or \(G\) for \(n\) if intention is clear
1st M1 for identifying either set of cases (\(R = 2, G = 1, X = 20\)) or (\(R = 3, G = 4, X = 50\)) Allow 1st M1 for \(\mathrm{P}(X = 20) = \tfrac{1}{4}\times\tfrac{2}{3}\) or \(\mathrm{P}(X = 50) = \tfrac{3}{4}\times\tfrac{1}{3}\) NOT just \(\mathrm{P}(X = 20) = \tfrac{1}{6}\) etc or \(\tfrac{1}{4}m + \tfrac{2}{3}n = 20\) or \(\tfrac{3}{4}m + \tfrac{1}{3}n = 50\) and might score 2nd M1 (answer is \(m = 64\), \(n = 6\)) or \(\tfrac{1}{4}m + \tfrac{2}{3}n = \tfrac{1}{6}\) or \(\tfrac{3}{4}m + \tfrac{1}{3}n = \tfrac{1}{4}\) and might score 2nd M1 (answer is \(m = \tfrac{4}{15}\), \(n = \tfrac{3}{20}\)) or \(2m + n = \tfrac{1}{6}\) or \(3m + 4n = \tfrac{1}{4}\) and might score 2nd M1 (answer is \(m = \tfrac{1}{12}\), \(n = 0\)) or \(2m + n = 50\) and \(3m + 4n = 20\) and might score 2nd M1 (answer is \(m = 36\), \(n = -22\))
1st A1 for one correct equation
2nd A1 for both correct equations and no incorrect equations, unless they attempt to solve the correct 2 equations only
2nd M1 for attempt to solve their two linear equations in \(m\) and \(n\) (reduce to an equation in one variable, condone one sign error). May be implied by \(m = 6\) and \(n = 8\).
Calc If they use one of the 4 sets of equations for 1st M1 and use a calculator to write down the answer, we will allow this mark for sight of the correct answers to those equations as given above.
3rd A1 \(m = 6\) and \(n = 8\) only (no incorrect labelling here) Correct answer by trial can score 5/5 if no incorrect working seen.
5. Two bags, A and B, each contain balls which are either red or yellow or green.
Bag A contains 4 red, 3 yellow and \(n\) green balls. Bag B contains 5 red, 3 yellow and 1 green ball.
A ball is selected at random from bag A and placed into bag B. A ball is then selected at random from bag B and placed into bag A.
The probability that bag A now contains an equal number of red, yellow and green balls is \(p\).
Given that \(p \gt 0\), find the possible values of \(n\) and \(p\). (5)
Mark scheme
Scheme
Marks
AO
Must end up with 3 of each colour or 4 of each colour
M1
3.1b
n = 2 requires 1st red and 2nd green or red from A and green from B
M1
2.2a
P(1st red and 2nd green) \(= \dfrac{4}{9} \times \dfrac{1}{10} = \dfrac{4}{90}\) or \(\dfrac{2}{45}\) p = \(\underline{\underline{\dfrac{2}{45}}}\)
A1
1.1b
n = 5 requires 1st green and 2nd yellow or green from A and yellow from B
M1
2.2a
P(1st green and 2nd yellow) \(= \dfrac{5}{12} \times \dfrac{3}{10} = \dfrac{15}{120}\) or \(\dfrac{1}{8}\) p = \(\underline{\underline{\dfrac{1}{8}}}\)
A1
1.1b
(5)
(5 marks)
Notes
1st M1 for an overall strategy realising there are 2 options. Award when evidence of both cases (3 of each colour or 4 of each colour) seen.
2nd M1 for \(n = 2\) and attempt at 1st red and 2nd green May be implied by e.g. \(\dfrac{4}{9} \times \dfrac{1}{9}\)
1st A1 for \(p = \dfrac{2}{45}\) or exact equivalent
3rd M1 for \(n = 5\) and attempt at 1st green and 2nd yellow May be implied by e.g. \(\dfrac{5}{12} \times \dfrac{3}{9}\)
2nd A1 for \(p = \dfrac{1}{8}\) or exact equivalent
NB If both correct values of \(p\) are found and then added ( get \(\dfrac{61}{360}\) ), deduct final A1 only (i.e. 4/5)
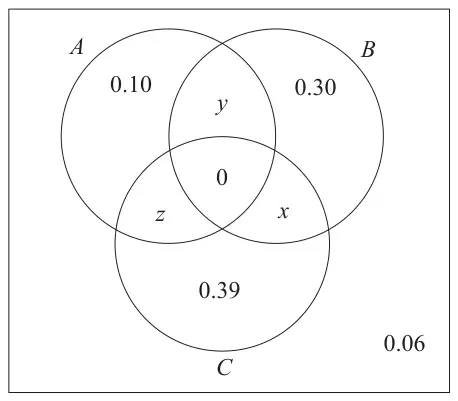
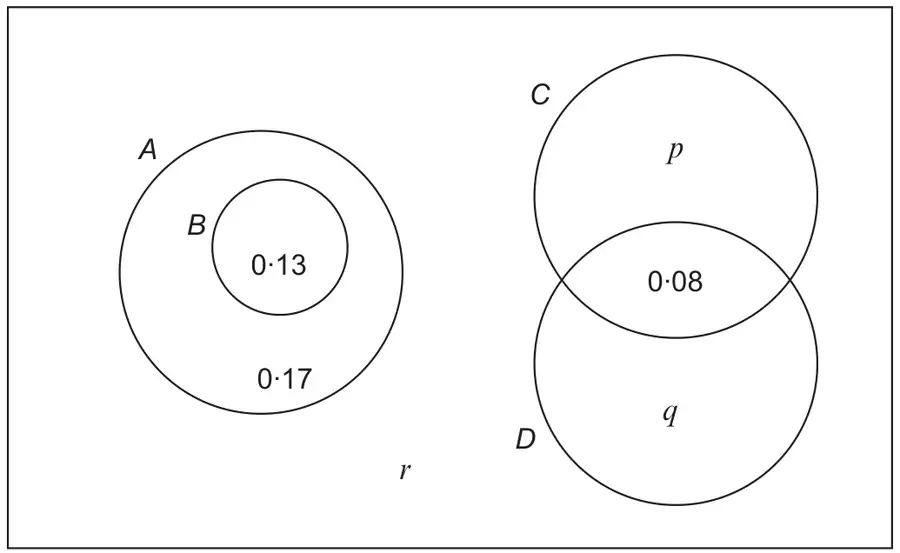
\(A\) and \(C\) are mutually exclusive. [ NOT \(\mathrm{P}(A)\) and \(\mathrm{P}(C)\) ]
B1
1.2
(1)
(2 marks)
Notes
B1 for \(A\) and \(C\) [NB \(A \cap C\) or \(A \cap C = \varnothing\) is B0 ] If more than one case given they must all be correct e.g. \(A \cap B\) and \(C\)
Solving (simultaneously) leading to \(\underline{z = 0.13}\quad \underline{y = 0.02}\)
A1
1.1b
(5 marks)
Notes
B1: for \(x = 0\), may be seen on Venn diagram
M1: Identifying the probabilities required for independence and at least 2 correct These must be labelled If there are no labels, then this may be implied by \(z = (0.1 + z + y)(0.39 + z\ [+x])\), allow one numerical slip
Allow e.g. \(\mathrm{P}(A^{\prime}) = 0.39 + 0.30 + 0.06[+x] \qquad \mathrm{P}(C) = 0.39 + z[+x] \qquad \mathrm{P}(A^{\prime} \text{ and } C) = 0.39\) [Not on spec. but you may see use of conditional probabilities]
M1: Use of independence equation with their labelled probabilities in terms \(y\), \(z\) [and \(x\)] All their probabilities must be substituted into a correct formula Sight of a correct equation e.g. \(z = (0.1 + z + y)(0.39 + z\ [+x])\) scores M1M1
M1: Using \(\Sigma p = 1\) Implied by \([x\ +]\ y + z = 0.15\) or their \(x + y + z = 0.15\) where \(x\), \(y\), and \(z\) are all probabilities or e.g. \(\mathrm{P}(A) = 0.25\)
2. A factory buys 10% of its components from supplier \(A\), 30% from supplier \(B\) and the rest from supplier \(C\). It is known that 6% of the components it buys are faulty.
Of the components bought from supplier \(A\), 9% are faulty and of the components bought from supplier \(B\), 3% are faulty.
(a) Find the percentage of components bought from supplier \(C\) that are faulty. (3)
A component is selected at random.
(b) Explain why the event “the component was bought from supplier \(B\)” is not statistically independent from the event “the component is faulty”. (1)
Mark scheme (a)
Scheme
Marks
AO
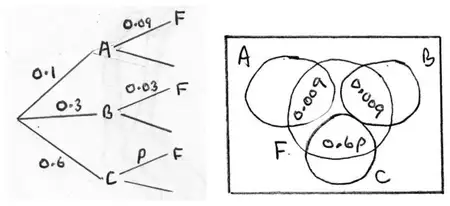
[Let \(p = \mathrm{P}(F \mid C)\)] Tree diagram or some other method to find an equation for \(p\) \(0.1 \times 0.09 + 0.3 \times 0.03 + 0.6 \times p = 0.06\)
M1 A1
2.1 1.1b
\(p = 0.07\) i.e. 7%
A1
1.1b
(3)
Notes
M1 for selecting a suitable method to find the missing probability e.g. sight of tree diagram with 0.1, 0.3, 0.6 and 0.09, 0.03, \(p\) suitably placed e.g. sight of VD with 0.009 for \(A \cap F\) and \(B \cap F\) and \(0.6p\) suitably placed or attempt an equation with at least one correct numerical and one “\(p\)” product (not necessarily correct) on LHS or for sight of \(0.06 - (0.009 + 0.009)\) (o.e. e.g. \(6 - 1.8 = 4.2\%\))
1st A1 for a correct equation for \(p\) (May be implied by a correct answer) or for the expression \(\dfrac{0.06 - (0.009 + 0.009)}{0.6}\) (o.e.)
2nd A1 for 7% (accept 0.07)
Correct Ans: Provided there is no incorrect working seen award 3/3 e.g. may just see tree diagram with 0.07 for \(p\) (probably from trial and improv’)
Mark scheme (b)
Scheme
Marks
AO
e.g. \(\mathrm{P}(B \text{ and } F) = 0.3 \times 0.03 = 0.009\) but \(\mathrm{P}(B) \times \mathrm{P}(F) = 0.3 \times 0.06 = 0.018\) These are not equal so not independent
B1
2.4
(1)
(4 marks)
Notes
B1 for a suitable explanation…may talk about 2nd branches on tree diagram and point out that \(0.03 \neq 0.06\) but need some supporting calculation/words Can condone incorrect use of set notation (it is not on AS spec) provided the rest of the calculations and words are correct.
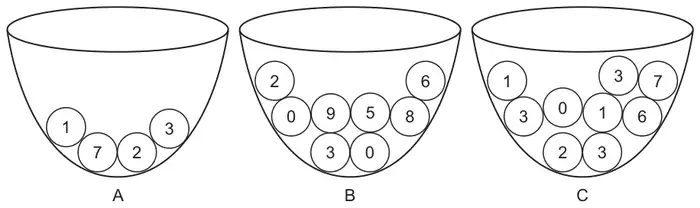
B1: using \(\mathrm{P}(10) = 0.2\ (p)\), \(\mathrm{P}(20) = 0.4\ (q)\) and \(\mathrm{P}(50) = 0.4\ (r)\) may be seen in calculations or implied by a correct probability.
B1: three correct medians and no extras.
P(Median 10): M1: allow if \((p + q + r) = 1\) and use \(p^3 + 3\times p^2\times q + 3\times p^2\times r\) or \(p^3 + 3\times p^2\times(q + r)\) look for \(\dfrac{1}{125} + \dfrac{6}{125} + \dfrac{6}{125}\)
P(Median 50): M1: allow if \((p + q + r) = 1\) and use \(r^3 + 3\times r^2\times p + 3\times r^2\times q\) or \(r^3 + 3\times r^2\times(p + q)\) Look for \(\dfrac{8}{125} + \dfrac{12}{125} + \dfrac{24}{125}\)
P(Median 20): M1: allow if \((p + q + r) = 1\) and use \(3\times p\times q^2 + 6\times p\times q\times r + q^3 + 3\times q^2\times r\) \(\dfrac{12}{125} + \dfrac{24}{125} + \dfrac{8}{125} + \dfrac{24}{125}\)
How to award the M marks – Allow the use of 1, 2 and 5 for the medians for the method marks M1 any correct calculation (implied by correct answer) for P(m = 10) or P(m = 20) or P(m = 50) M1 any 2 correct calculations (implied by 2 correct answers) P(m = 10) or P(m = 20) or P(m = 50) M1 any 3 correct calculations (implied by 3 correct answers) for P(m = 10) and P(m = 20) and P(m = 50) or 3 probabilities that add up to 1 providing it is 1 – their 2 other calculated probabilities. Do not allow \(\dfrac{1}{5}\ \dfrac{2}{5}\ \dfrac{2}{5}\) NB if they do not have a correct answer their working must be clear including the addition signs.
A1: awrt any 1 correct A2: awrt all 3 correct These do not need to be in a table as long as the correct probablity is with the correct median(10, 20 & 50) NB: Do Not allow the use of 1,2 and 5 for the medians for the A marks
2. A bag contains a large number of counters. Each counter has a single digit number on it and the mean of all the numbers in the bag is the unknown parameter \(\mu\). The number 2 is on 40% of the counters and the number 5 is on 25% of the counters. All the remaining counters have numbers greater than 5 on them.
A random sample of 10 counters is taken from the bag.
(a) State whether or not each of the following is a statistic
(i) \(S\) = the sum of the numbers on the counters in the sample,
(ii) \(D\) = the difference between the highest number in the sample and \(\mu\),
(iii) \(F\) = the number of counters in the sample with a number 5 on them. (3)
The random variable \(T\) represents the number of counters in a random sample of 10 with the number 2 on them.
(b) Specify the sampling distribution of \(T\). (2)
The counters are selected one by one.
(c) Find the probability that the third counter selected is the first counter with the number 2 on it. (2)
Mark scheme (a)
Scheme
Marks
(i) \(S\) is a statistic, (ii) \(D\) is not a statistic, (iii) \(F\) is a statistic
B1, B1, B1
(3)
Notes
B1 for each variable. Accept “yes, no, yes” o.e.
Mark scheme (b)
Scheme
Marks
\(T \sim \mathrm{B}(10, 0.4)\)
M1A1
(2)
Notes
M1 for binomial A1 for \(n = 10\) and \(p = 0.4\)
NB If they give 2 options then unless they select the correct one they gain M0A0
M1 for identifying the correct possibilities \(2^{\prime}\ 2^{\prime}\ 2\) or 5 5 2 and 5 >5 2 and >5 5 2 and >5 >5 2 or a correct probability statement. The possibilities must be in the correct order. Condone \(2\times\) (5 >5 2) or \(2\times\) (>5 5 2). Implied a correct answer.
A1 for 0.144 or exact equivalent e.g. \(\dfrac{18}{125}\)
A table showing all 25 cases can only score M1 in (g) if the correct cases are indicated.
M1 for using independence (so multiplying) and attempting \(\mathrm{P}(S_2 \leqslant 4)\) e.g. \(0.2\times(0.2 + 0.2 + 0.1 + 0.3)\) or \(0.04 + 0.04 + 0.02 + 0.06\) score M1 BUT \(\frac{4}{25}\) (not from \(0.2\times 0.8\)) is M0A0
A1cso for a fully correct explanation leading to 0.16. Must come from \(0.2\times 0.8\) not \(\frac{4}{25}\)
2nd B1 for all 8 cases. No incorrect extras – condone repeats. Allow (1, 5, 5) (x 3) and (1, 1, 5) (x 3) instead of writing all three cases down
Mark scheme (b)
Scheme
Marks
\(r\): 0 and 4
B1
\(\mathrm{P}(R = 0) = \dfrac{9}{27}\) or \(\dfrac{1}{3}\) \(\mathrm{P}(R = 4) = \dfrac{18}{27}\) or \(\dfrac{2}{3}\)
M1d A1
(3)
(5 marks)
Notes
B1 for both values of \(r\)
M1 d dependent on previous B1. For an attempt to evaluate one of the probabilities for \(r\) correctly e.g. for \(r = 0\); \(\left(\dfrac{2}{3}\right)^3 + \left(\dfrac{1}{3}\right)^3\) and for \(r = 4\); \(3 \times \left(\dfrac{1}{3}\right)^2 \times \left(\dfrac{2}{3}\right) + 3 \times \left(\dfrac{1}{3}\right) \times \left(\dfrac{2}{3}\right)^2\) Working must be shown.
A1 for both values of \(r\) and their correct corresponding probabilities. Allow awrt 0.333 and 0.667
NB Correct answer with no working will gain B1M0A0
B1 \(\left(\tfrac{3}{10}\right)^3\) or 0.027 oe. This can be a single term in a summation
M1 either “3” \(\times \tfrac{1}{2} \times \left(\tfrac{3}{10}\right)^2\) or “3” \(\times \tfrac{1}{5} \times \left(\tfrac{3}{10}\right)^2\) oe. May omit the \(3 \times\) or have another positive integer in place of the 3. These may be seen as a single term in a summation
1st M1 correct calculation for \(\mathrm{P}(M = 1)\) or \(\mathrm{P}(M = 2)\), working must be shown and not implied by a correct answer.
1st A1 either \(\mathrm{P}(M = 1)\) or \(\mathrm{P}(M = 2)\) correct
2nd M1 correct calculation for both \(\mathrm{P}(M = 1)\) and \(\mathrm{P}(M = 2)\), or their probabilities adding up to 1, but do not allow probabilities of 0.5, 0.2 and 0.3
2nd A1 both \(\mathrm{P}(M = 1)\) and \(\mathrm{P}(M = 2)\) correct
3rd A1dep on both M marks awarded. All three values written down with their correct probabilities. They must be in part (c) but they do not need to be in a table.
NB A fully correct table with no working will get M0 A0 M1 A1 A0.
6. A fair blue die has faces numbered 1, 1, 3, 3, 5 and 5. The random variable \(B\) represents the score when the blue die is rolled.
(a) Write down the probability distribution for \(B\). (2)
(b) State the name of this probability distribution. (1)
(c) Write down the value of \(\mathrm{E}(B)\). (1)
A second die is red and the random variable \(R\) represents the score when the red die is rolled.
The probability distribution of \(R\) is
\(r\)
2
4
6
\(\mathrm{P}(R = r)\)
\(\dfrac{2}{3}\)
\(\dfrac{1}{6}\)
\(\dfrac{1}{6}\)
(d) Find \(\mathrm{E}(R)\). (2)
(e) Find \(\mathrm{Var}(R)\). (3)
Tom invites Avisha to play a game with these dice.
Tom spins a fair coin with one side labelled 2 and the other side labelled 5. When Avisha sees the number showing on the coin she then chooses one of the dice and rolls it. If the number showing on the die is greater than the number showing on the coin, Avisha wins, otherwise Tom wins.
Avisha chooses the die which gives her the best chance of winning each time Tom spins the coin.
(f) Find the probability that Avisha wins the game, stating clearly which die she should use in each case. (4)
Mark scheme (a)
Scheme
Marks
\(b\)
1
3
5
\(\mathrm{P}(B = b)\)
\(\dfrac{1}{3}\)
\(\dfrac{1}{3}\)
\(\dfrac{1}{3}\)
Also allow \(b\) values 1,1,3,3,5,5 and probabilities all \(\frac{1}{6}\)
B1 B1
(2)
Notes
1st B1 for correctly identifying values of \(b\) as 1, 3, 5 or 1,1,3,3,5,5
2nd B1 for probabilities all \(= \frac{1}{3}\) or exact equivalent (or of course 6 cases of \(\frac{1}{6}\))
Any correct probability distribution or probability function is 2/2. Must be in part (a)
Mark scheme (b)
Scheme
Marks
Discrete Uniform {distribution}
B1
(1)
Notes
B1 for "Discrete Uniform". Both words required.
Mark scheme (c)
Scheme
Marks
\([\mathrm{E}(B) =]\ 3\) (by symmetry)
B1
(1)
Notes
B1 for answer of 3 o.e. Accept \(\mathrm{E}(X) = 3\)
\([\mathrm{Var}(R) =]\ \dfrac{34}{3} - 3^2 = \dfrac{7}{3}\) (or any exact equivalent. NB 2.33 is A0)
dM1, A1
(3)
Notes
1st M1 for a correct attempt at \(\mathrm{E}(R^2)\). At least 2 correct products seen. Condone \(\mathrm{Var}(R) =\) etc. May be implied by sight of \(\frac{34}{3}\) or 11.3 or better.
2nd dM1 Dep. on 1st M1 for clear attempt at \(\mathrm{E}(R^2) - [\mathrm{E}(R)]^2\). Must see their values used. NB \(\mathrm{Var}(R) = \mathrm{E}(R^2) - [\mathrm{E}(R)]^2 = \text{"}\tfrac{34}{3}\text{"} - \text{"}3\text{"}\) is M1M0A0 since do not use their \([\mathrm{E}(R)]^2\)
Mark scheme (f)
Scheme
Marks
Coin lands on 2, choose blue die; coin lands on 5 choose red die
B2/1/0 Both correct B1B1, one correct B1B0. Do not use B0B1[e.g. always red or RR is B1B0] NB Allow other descriptions of the die e.g. 1st or fair for blue, 2nd for red if they are clear.
M1 for evaluating correct probabilities i.e. only \(\frac{1}{3}, \frac{1}{12}\) seen or if incorrect choice made: M1 for an answer of : if choose RR (\(\frac{1}{4}\)), if choose BB (\(\frac{1}{3}\)), if choose RB (\(\frac{1}{6}\))
NB \(\frac{5}{12}\) as answer scores M1A1. Need to see choices of die stated for B marks.
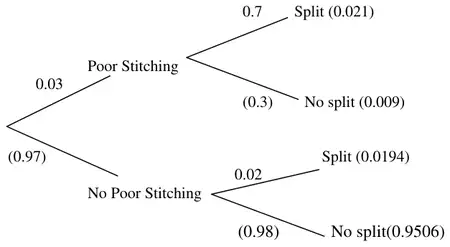
7. A manufacturer carried out a survey of the defects in their soft toys. It is found that the probability of a toy having poor stitching is 0.03 and that a toy with poor stitching has a probability of 0.7 of splitting open. A toy without poor stitching has a probability of 0.02 of splitting open.
(a) Draw a tree diagram to represent this information. (3)
(b) Find the probability that a randomly chosen soft toy has exactly one of the two defects, poor stitching or splitting open. (3)
The manufacturer also finds that soft toys can become faded with probability 0.05 and that this defect is independent of poor stitching or splitting open. A soft toy is chosen at random.
(c) Find the probability that the soft toy has none of these 3 defects. (2)
(d) Find the probability that the soft toy has exactly one of these 3 defects. (4)
Mark scheme (a)
Scheme
Marks
Shape B1 Labels & 0.03 B1 Labels & 0.7, 0.02 B1
(3)
Notes
Allow MR of 0.2 for 0.02 or 0.3 for 0.03 on tree diagram to score all M and A1ft marks only
1st B1 for 2 branch then 4 branch shape
2nd dB1 dep. on 1st B1 for labels showing stitching (accept letters) and 0.03 value correctly placed
3rd dB1 dep. on 1st B1 for labels showing splitting and 0.7 and 0.02 correctly placed
[probabilities shown in brackets are not required and any such values given can be ignored in (a)]
Mark scheme (b)
Scheme
Marks
P(Exactly one defect) \(= 0.03\times 0.3 + 0.97\times 0.02\) or \(\mathrm{P}(PS \cup Split) - 2\mathrm{P}(PS \cap Split)\)
M1A1ft
\(= [0.009 + 0.0194 =]\) 0.0284
A1 cao
(3)
Notes
M1 for \(0.03\times p + 0.02\times q\) where \(p\) and \(q\) follow from their tree diagram. Extra terms is M0
1st A1ft for a fully correct expression. Accept \(1 - 0.7\) for 0.3 and \(1 - 0.03\) for 0.97. Follow through 0.2 and 0.3 MR only
MR 0.2 for 0.02 \(\to\) 0.203 or 0.3 for 0.03 \(\to\) 0.104 or both \(\to\) 0.23 should score M1A1A0
2nd A1 cao for 0.0284 only (or exact equivalent such as \(\frac{71}{2500}\))
8. A spinner is designed so that the score \(S\) is given by the following probability distribution.
\(s\)
0
1
2
4
5
\(\mathrm{P}(S = s)\)
\(p\)
0.25
0.25
0.20
0.20
(a) Find the value of \(p\). (2)
(b) Find \(\mathrm{E}(S)\). (2)
(c) Show that \(\mathrm{E}(S^2) = 9.45\) (2)
(d) Find \(\mathrm{Var}(S)\). (2)
Tom and Jess play a game with this spinner. The spinner is spun repeatedly and \(S\) counters are awarded on the outcome of each spin. If \(S\) is even then Tom receives the counters and if \(S\) is odd then Jess receives them. The first player to collect 10 or more counters is the winner.
(e) Find the probability that Jess wins after 2 spins. (2)
(f) Find the probability that Tom wins after exactly 3 spins. (4)
(g) Find the probability that Jess wins after exactly 3 spins. (3)
Mark scheme (a)
Scheme
Marks
\(1 = p + (0.25 + 0.25 + 0.2 + 0.2),\ \Rightarrow p = \underline{\tfrac{1}{10} \text{ or } 0.1}\)
M1, A1
(2)
Notes
M1 for clear attempt to use sum of probabilities = 1 (fractions or decimals) Ans only 2/2
M1 for at least 3 correct, non-zero terms of the expression seen, allow decimals. A1cso for the full expression (with 9.45) seen. Must be cso but can ignore wrong \(p\).
M1 for a correct expression (9.45 seen), can ft their E(\(S\)). May see \(\sum (x - \text{"}2.55\text{"})^2 \times \mathrm{P}(X = x)\) A1 accept awrt 2.95 Answer only can score M1 for correct ft and A1 for awrt 2.95
Answer only in (e) and (f) is full marks, in (g) is no marks
Mark scheme (e)
Scheme
Marks
P(5 and 5 ) = \(\left(\tfrac{1}{5}\right)^2\), = \(\tfrac{1}{25}\) or 0.04
M1, A1
(2)
Notes
M1 for \(\left(\tfrac{1}{5}\right)^2\) Condone \(\mathrm{P}(5) \times \mathrm{P}(5) = 0.25 \times 0.25\). [Beware 0.4 is A0]
P(4, 4, 4) = \(\left(\tfrac{1}{5}\right)^3\) ( = 0.008 or \(\tfrac{1}{125}\))
B1
P(Tom wins in 3 spins) = 0.038
A1
(4)
Notes
1st M1 for \(\left(\tfrac{1}{5}\right)^2 \times \tfrac{1}{4}\) or 0.01 seen 2nd M1 for multiplying a \(p^2q\) probability by 3(\(p, q \in (0,1)\) ). B1 for \((0.2)^3\) or better seen
1st M1 for \(\tfrac{4}{5} \times \left(\tfrac{1}{5}\right)^2\) or all cases considered and correct attempt at probabilities. 2nd M1 for multiplying a \(p^2(1 - p)\) probability by 2. Beware \((0.4)^3\) = 0.064 is M0M0A0
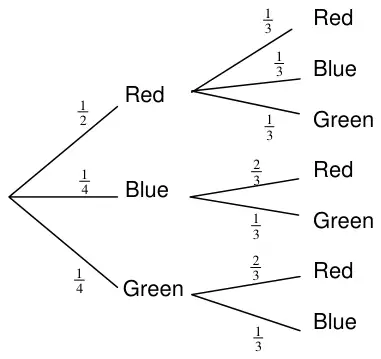
1. A jar contains 2 red, 1 blue and 1 green bead. Two beads are drawn at random from the jar without replacement.
(a) In the space below, draw a tree diagram to illustrate all the possible outcomes and associated probabilities. State your probabilities clearly. (3)
(b) Find the probability that a blue bead and a green bead are drawn from the jar. (2)
Mark scheme (a)
Scheme
Marks
M1 A1 A1
(3)
Notes
M1 for shape and labels: 3 branches followed by 3,2,2 with some \(R\), \(B\) and \(G\) seen Allow 3 branches followed by 3, 3, 3 if 0 probabilities are seen implying that 3, 2, 2 intended Allow blank branches if the other probabilities imply probability on blanks is zero Ignore further sets of branches
1st A1 for correct probabilities and correct labels on 1st set of branches. 2nd A1 for correct probabilities and correct labels on 2nd set of branches. (accept 0.33, 0.67 etc or better here)
Special Case
With Replacement (This oversimplifies so do not apply Mis-Read: max mark 2/5)
(a) B1 for 3 branches followed by 3, 3, 3 with correct labels and probabilities of \(\tfrac{1}{2}, \tfrac{1}{4}, \tfrac{1}{4}\) on each.
Mark scheme (b)
Scheme
Marks
P(Blue bead and a green bead) \(= \left(\dfrac{1}{4} \times \dfrac{1}{3}\right) + \left(\dfrac{1}{4} \times \dfrac{1}{3}\right) = \dfrac{1}{6}\) (or any exact equivalent)
M1 A1
(2)
(5 marks)
Notes
M1 for identifying the 2 cases \(BG\) and \(GB\) and adding 2 products of probabilities. These cases may be identified by their probabilities e.g. \(\left(\dfrac{1}{4} \times \dfrac{1}{3}\right) + \left(\dfrac{1}{4} \times \dfrac{1}{3}\right)\)
NB \(\tfrac{1}{6}\) (or exact equivalent) with no working scores 2/2
Special Case
With Replacement (This oversimplifies so do not apply Mis-Read: max mark 2/5)
(b) M1 for identifying 2, possibly correct cases and adding 2 products of probabilities but A0 for wrong answer \(\left[\left(\dfrac{1}{4} \times \dfrac{1}{4}\right) + \left(\dfrac{1}{4} \times \dfrac{1}{4}\right)\right]\) will be sufficient for M1A0 here but \(\dfrac{1}{4} \times \dfrac{1}{2} + \ldots\) would score M0
2. Sunita and Shelley talk to one another once a week on the telephone. Over many weeks they recorded, to the nearest minute, the number of minutes spent in conversation on each occasion. The following table summarises their results.
Time (to the nearest minute)
Number of Conversations
5–9
2
10–14
9
15–19
20
20–24
13
25–29
8
30–34
3
Two of the conversations were chosen at random.
(a) Find the probability that both of them were longer than 24.5 minutes. (2)
The mid-point of each class was represented by \(x\) and its corresponding frequency by \(f\), giving \(\Sigma fx = 1060\).
(b) Calculate an estimate of the mean time spent on their conversations. (2)
During the following 25 weeks they monitored their weekly conversations and found that at the end of the 80 weeks their overall mean length of conversation was 21 minutes.
(c) Find the mean time spent in conversation during these 25 weeks. (4)
(d) Comment on these two mean values. (2)
Mark scheme (a)
Scheme
Marks
\(\mathrm{P}(\text{both longer than } 24.5) = \dfrac{11}{55} \times \dfrac{10}{54} = \dfrac{1}{27}\) or \(0.\dot{0}3\dot{7}\) or 0.037
M1A1
(2)
Notes
M1 2 fracs × w/o rep.
A1 awrt 0.037
Mark scheme (b)
Scheme
Marks
Estimate of mean time spent on their conversations is \(\bar{x} = \dfrac{1060}{55} = 19\tfrac{3}{11}\) or \(19.\dot{2}\dot{7}\) or 19.3
M1A1
(2)
Notes
M1A1 1060/total, awrt 19.3 or 19mins 16s
Mark scheme (c)
Scheme
Marks
\(\dfrac{1060 + \sum fy}{80} = 21\)
B1
\(\sum fy = 620\)
M1
\(\therefore \bar{y} = \dfrac{620}{25} = 24.8\)
M1A1
(4)
Notes
B1 \(21 \times 80 = 1680\)
M1 Subtracting ‘their 1060’
M1A1 Dividing their 620 by 25
Mark scheme (d)
Scheme
Marks
Increase in mean value.
B1
Length of conversations increased considerably during 25 weeks relative to 55 weeks
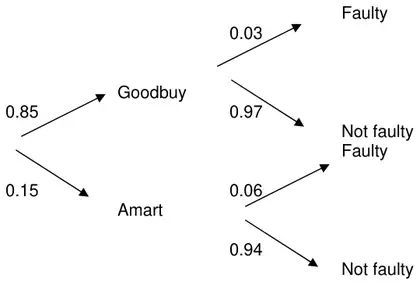
1. A company assembles drills using components from two sources. Goodbuy supplies 85% of the components and Amart supplies the rest. It is known that 3% of the components supplied by Goodbuy are faulty and 6% of those supplied by Amart are faulty.
(a) Represent this information on a tree diagram. (3)
An assembled drill is selected at random.
(b) Find the probability that it is not faulty. (3)
After each visit she chooses one item to eat from the gym’s cafe.
This could be an apple, a banana or a piece of cake.
She chooses the item independently each time.
The probability that Yingtai chooses each of these items on any visit is given by:\[\mathrm{P}(\text{Apple}) = 0.2\]\[\mathrm{P}(\text{Banana}) = 0.35\]\[\mathrm{P}(\text{Cake}) = 0.45\]
For any four randomly selected visits to the gym, find the probability that Yingtai chose:
(a) at least one banana. [2 marks]
(b) the same item each time. [2 marks]
(c) apple twice and cake twice. [3 marks]
Mark scheme (a)
Scheme
Marks
AO
Uses \(1 - \mathrm{P}(\text{no bananas})\) (at least \(1 - p^4\) for \(0 \lt p \lt 1\) seen) or Uses \(\mathrm{P}(1) + \mathrm{P}(2) + \mathrm{P}(3) + \mathrm{P}(4)\) Or Uses \(\mathrm{P}(x \geqslant 1)\) using \(\mathrm{B}(4, 0.35)\)
M1
3.1b
Obtains correct probability AWFW 0.821 to 0.822 Accept 0.82
17 The number of toilets in each of a random sample of 200 properties from a town was recorded.
Four types of properties were included: terraced, semi-detached, detached and apartment.
The data is summarised in the table below.
Number of toilets
One
Two
Three
Terraced
20
10
4
Semi-Detached
18
50
16
Detached
12
10
8
Apartment
22
30
0
One of the properties is selected at random.
\(A\) is the event ‘the property has exactly two toilets’.
\(B\) is the event ‘the property is detached’.
(a)
(i) Find \(\mathrm{P}(A)\). [1 mark]
(ii) Find \(\mathrm{P}(A' \cap B)\). [1 mark]
(iii) Find \(\mathrm{P}(A \cup B)\). [2 marks]
(b) Determine whether events \(A\) and \(B\) are independent.
Fully justify your answer. [2 marks]
(c) Using the table, write down two events, other than event \(\boldsymbol{A}\) and event \(\boldsymbol{B}\), which are mutually exclusive. [1 mark]
Mark scheme (a)
Scheme
Marks
AO
(i) States correct answer (ACF)
B1
1.1b
(1)
(ii) States correct answer (ACF)
B1
1.1b
(1)
(iii) Uses correct formula for \(\mathrm{P}(A \cup B)\) with ‘their’ \(\mathrm{P}(A)\), \(\mathrm{P}(B)\) and \(\mathrm{P}(A \cap B)\) (\(\neq 0\)) (PI by correct answer) Or Counting from the table\[\frac{12 + 8 + 10 + 50 + 30 + 10}{200}\]Condone double-counting the 10 for \(A \cap B\) for this mark.
M1
3.1a
Obtains correct answer. (ACF)
A1
1.1b
(2)
Typical solution
(i)
\[\mathrm{P}(A) = \frac{100}{200}\]\[= 0.5\]
(ii)
\[\text{Find } \mathrm{P}(A' \cap B) = \frac{20}{200} = 0.1\]
(iii)
\[\mathrm{P}(B) = \frac{30}{200} = 0.15\]\[\mathrm{P}(A \cap B) = \frac{10}{200} = 0.05\]\[\mathrm{P}(A \cup B) = \mathrm{P}(A) + \mathrm{P}(B) - \mathrm{P}(A \cap B)\]\[\mathrm{P}(A \cup B) = 0.5 + 0.15 - 0.05\]\[= 0.6\]
Mark scheme (b)
Scheme
Marks
AO
Calculates \(\mathrm{P}(A) \times \mathrm{P}(B)\) for ‘their’ \(\mathrm{P}(A)\) and \(\mathrm{P}(B)\)
M1
3.1a
Compares to ‘their’ \(\mathrm{P}(A \cap B)\) (providing \(\mathrm{P}(A \cap B) \neq 0\)) and deduces that the events are not independent
15 Two independent events, \(A\) and \(B\), are such that\[\mathrm{P}(A) = 0.2\]\[\mathrm{P}(A \cup B) = 0.8\]
(a)
(i) Find \(\mathrm{P}(B)\) [4 marks]
(ii) Find \(\mathrm{P}(A \cap B)\) [1 mark]
(b) State, with a reason, whether or not the events \(A\) and \(B\) are mutually exclusive. [1 mark]
Mark scheme (a)
Scheme
Marks
AO
(i) Uses the formula \(P(A \cup B) = P(A) + P(B) - P(A \cap B)\) PI by \(0.8 = 0.2 + P(B) -\) stated term/value or States \(P(A' \cap B') = 0.2\) and \(P(A') = 0.8\) OE
M1
3.1a
Uses the formula \(P(A \cap B) = P(A) \times P(B)\) or \(P(A' \cap B') = P(A') \times P(B')\) OE
M1
3.1a
Obtains correct equation in \(P(B)\) or \(P(B')\) only PI
A1
1.1a
Finds correct value of \(P(B)\)
A1
1.1b
(4)
(ii) Finds ‘their’ correct value of \(P(A \cap B)\) provided P(B) lies between 0 and 0.8
Deduces not mutually exclusive and states a correct reason
Other reasons: Not mutually exclusive, since \(P(A \cap B) \neq 0\) or Shows \(P(A \cup B) \neq P(A) + P(B)\) or Not mutually exclusive as they can both occur at the same time
R1
2.2a
(1)
(6 marks)
Typical solution
A and B are not mutually exclusive since independent events cannot be mutually exclusive
11 A spinner has sides numbered 1, 2, 3, 4. When the spinner is spun the score is given by the number of the side on which it lands. The spinner is biased, as shown in the table.
Score
1
2
3
4
Probability
\(\dfrac{1}{8}\)
\(\dfrac{3}{8}\)
\(\dfrac{1}{6}\)
\(\dfrac{1}{3}\)
In a fairground game, each player has two spins. They win a prize if the total of the scores on the two spins is greater than 5.
Zayn says, “If I play, it’s more likely that I’ll win a prize than I won’t win a prize.”
M2: M2 for all 20 products M1 for 8 correct products
Mark scheme (b)
Scheme
Marks
AO
Basic scheme: Must refer to some aspect of the model that makes \(\approx 3\) goals per match unlikely Must mention or imply \(\approx 3\) goals per match EG: Current model seems to underestimate probabilities of higher numbers of goals
Or about 3 goals per match, but mean in the model is \(\lt 3\) Or about 3 goals per match, but mean \(= 2\) or median \(= 2\) Or model suggests more matches \(\lt\) than 3 than \(\gt 3\) Or model suggests \(\lt 3\) goals per match
B1
3.5a
[1]
Notes
oe. Or eg \(\mathrm{P}(X \gt 4)\) should be more than 0 or model suggests impossible to score more than 4 goals or model says P(3 or more) \(= 0.36\) which is small
NOT \(\approx 3\) goals per match, but \(\mathrm{P}(X = 3) = \frac{7}{25}\), too small. NOT \(\approx 3\) goals per match, but \(\left(\frac{7}{25}\right)^{10}\) is tiny NOT \(\approx 3\) goals per match unlikely given this model NOT 3 is not the most likely number of goals NOT Highest probability is 2
10 Jane conducted a survey. She chose a sample of people from three towns, A, B and C. She noted the following information.
400 people were chosen. 230 people were adults. 55 adults were from town A. 65 children were from town A. 35 children were from town B. 150 people were from town B.
(a) Complete the two-way frequency table below. [2]
Town
A
B
C
Total
adult
child
Total
(b) One of the people is chosen at random.
(i) Find the probability that this person is an adult from town A. [1]
(ii) Given that the person is from town A, find the probability that the person is an adult. [1]
For another survey, Jane wanted to choose a random sample from the 820 students living in a particular hostel. She numbered the students from 1 to 820 and then generated some random numbers on her calculator.
The random numbers were 0.114 287 562 and 0.081 859 817.
Jane’s friend Kareem used these figures to write down the following sample of five student numbers.
114, 142, 428, 287 and 756
Jane used the same figures to write down the following sample of five student numbers.
114, 287, 562, 81 and 817
(c)
(i) State, with a reason, which one of these samples is not random. [1]
(ii) Explain why Jane omitted the number 859 from her sample. [1]
Mark scheme (a)
Scheme
Marks
(55)
115
(60)
(230)
(65)
(35)
70
170
120
(150)
130
(400)
B1 B1
[2]
Notes
B1 for 10 correct numbers
(corrected from the printed mark scheme: the part total is printed as [1]; the paper and the two B1 marks give [2])
Mark scheme (b)
Scheme
Marks
(i) \(\frac{55}{400}\) ISW or \(\frac{11}{80}\) or 0.1375 or 0.138 (3 sf)
B1
[1]
(ii) \(\frac{55}{120}\) ISW or \(\frac{11}{24}\) or 0.458 (3 sf)
B1
[1]
Notes
(i): NB If figures for A in the table are correct, but those for B and C are wrong, correct answers to parts (b)(i), (ii) can be obtained correctly.
Mark scheme (c)
Scheme
Marks
(i) Kareem because, eg the 2nd digit of each no. is the same as the 1st digit of the next
B1
[1]
(ii) Only 820 students or \(859 \gt 820\)
B1
[1]
Notes
(i): oe. Allow Kareem because the numbers are not independent.
(ii): oe
(corrected from the printed mark scheme: “850 > 820” is printed; the number in the question is 859)
11In this question you must show detailed reasoning.
A biased four-sided spinner has edges numbered 1, 2, 3, 4. When the spinner is spun, the probability that it will land on the edge numbered \(X\) is given by
M1 M1: One of the following expressions seen: M1. Another seen: M1 \(\dfrac{25}{100} \times \dfrac{\cdots}{99}\) or \(\dfrac{3}{100} \times \dfrac{\cdots}{99}\) or \(\dfrac{15}{100} \times \dfrac{\cdots}{99}\) or \(\left(\dfrac{8}{100} \times \dfrac{\cdots}{99} + \dfrac{7}{100} \times \dfrac{\cdots}{99}\right)\)
or \(\dfrac{18}{100} \times \dfrac{\cdots}{99}\) M2 or \(\dfrac{43}{100}\left(\dfrac{25}{43} \times \dfrac{\cdots}{99}\right)\) M1 or \(\dfrac{43}{100}\left(\dfrac{18}{43} \times \dfrac{\cdots}{99}\right)\) M2
M1: Can score this mark for the intention to calculate p(odd, odd) + p(even, even) – may be stated, or partial cases listed, or with a tree diagram with correct pathways or with a statement of ‘odd, odd’ and ‘even, even’ and an attempt to add.
A1: allow \(0.\dot{5}\) correct to 3 dp or better so 0.555… or 0.555 but not 0.55 however isw once \(\frac{5}{9}\) o.e. seen. Condone 0.556
Alternative 1
Scheme
Marks
AO
Sample space:
1
3
4
5
6
7
1
2
4
5
6
7
8
3
4
6
7
8
9
10
4
5
7
8
9
10
11
5
6
8
9
10
11
12
6
7
9
10
11
12
13
7
8
10
11
12
13
14
M1
A1
3.1a
2.1
\(\frac{5}{9}\) o.e. \(\frac{20}{36}\) etc
A1
1.1
M1: Complete sample space diagram with maximum two errors
A1: Extraction of even outcomes – may circle or underline etc.
A1: allow \(0.\dot{5}\) correct to 3 dp or better so 0.555… or 0.555 but not 0.55 however isw once \(\frac{5}{9}\) o.e. seen. Condone 0.556
5 A company needs to appoint 3 new assistants. 8 candidates are invited for interview; each candidate has a different surname. The candidates are to be interviewed one after another. The personnel officer randomly selects the order in which the candidates are to be interviewed by drawing their names out of a hat. One of the candidates is called Mr Browne and another is called Mrs Green.
(a) Calculate the probability that Mr Browne is interviewed first and Mrs Green is interviewed last. [2]
5 of the 8 candidates invited for interview are women and the other 3 are men. The chief executive can’t make up his mind who to appoint so he randomly selects 3 candidates by drawing their names out of a hat.
(b) Determine the probability that more women than men are selected. [4]
Mark scheme (a)
Scheme
Marks
AO
\(\dfrac{1}{8} \times \dfrac{1}{7}\)
M1
1.1a
\(\dfrac{1}{56}\)
A1
1.1
[2]
Notes
M1: or \(\dfrac{6!}{8!}\) oe
A1: CAO accept 0.0179
0.017857142
Mark scheme (b)
Scheme
Marks
AO
\({}^5\mathrm{C}_3\) or \({}^5\mathrm{C}_2 \times {}^3\mathrm{C}_1\) seen [10, 30]
M1
1.1a
\({}^8\mathrm{C}_3\) is denominator [56] {equiv to \({}^8\mathrm{C}_5\)}
B1
1.1
P(3, 0) + P(2, 1) attempted
M1
2.1
\(\dfrac{5}{7}\)
A1
1.1
[4]
Notes
OR 3W 10 ways 2W1M 10x3 = 30 ways 1W2M 5x3 = 15 ways 3M 1 way So \(\dfrac{10 + 30}{10 + 30 + 15 + 1} = \dfrac{5}{7}\)
Allow M1 if the 2 cases are identified and added, whatever the calculation.
Allow method by subtraction from 1.
This question can be done by tree diagram, with similar working.
Alternative solution
Scheme
Marks
AO
alternatively \(\frac{5}{8} \times \frac{4}{7} \times \frac{3}{6}\) or \(3 \times \frac{5}{8} \times \frac{4}{7} \times \frac{3}{6}\) seen
M1
1.1a
both correct including \(\times 3\)
A1
1.1
P(3, 0) + P(2, 1) attempted
M1
2.1
\(\dfrac{5}{7}\)
A1
1.1
M1: \(\dfrac{60}{336}\) or \(\dfrac{5}{28}\) or \(\dfrac{180}{336}\) or \(\dfrac{15}{28}\)
M1: Allow even if \(\times 3\) missing
Allow both M marks for all denoms 8 – eg \(\frac{5}{8} \times \frac{4}{8} \times \frac{3}{8} = \frac{60}{512}\) etc leading to \(\frac{15}{32}\)
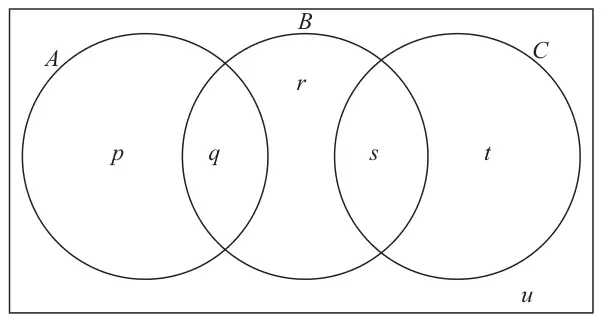
3. The following Venn diagram shows the participation of 100 students in three activities, \(A\), \(B\), and \(C\), which represent athletics, baseball and climbing respectively.
For these 100 students, participation in athletics and participation in climbing are independent events.
(a) Show that \(x=10\) and find the value of \(y\). [5]
(b) Two students are selected at random, one after the other without replacement. Find the probability that the first student does athletics and the second student does only climbing. [3]
Attempt to use \(\text{P}(A\cap C)=\text{P}(A)\times\text{P}(C)\) in terms of \(x\) to form an equation in \(x\). Equation must involve at least one fraction.
\(x^2-30x+200=0\)
A1
oe A1 for arriving at correct quadratic.
\(x=10\) or \(x=20\) *ag is 10
m1
Solving their 3-term quadratic to obtain real solutions. FT their quadratic provided M1 awarded
Reject \(x=20\) and reason, e.g.
because \(x=20\) would lead to a total greater than 100
\(y\) would be negative
Therefore, \(x=10\). *ag
A1
Must follow from \(x=10\) or \(x=20\)
\(y=8\)
B1
Not dependent on any of the above marks SC2 for verification that \(x=10\) [note: can still earn B1] e.g. \(\text{P}(A)\times\text{P}(C)=\frac{30}{100}\times\frac{60}{100}=\frac{18}{100}\) and \(\text{P}(A\cap C)=\frac{18}{100}\), so \(x=10\).
[5]
Mark scheme (b)
Scheme
Marks
Comments
P(first Athletics and second only climbing) \(=\dfrac{30}{100}\times\dfrac{15}{99}\)
M2
M2 for correct method. M1 for either correct fraction in a product of 2 fractions Allow 0.152 or better in place of \(15/99\) for M2
\(=\frac{1}{22}\) or \(0.0\dot{4}\dot{5}\)
A1
cao Condone 0.045 or better from correct working. Condone 0.0454. NOTE: the exact answer of 0.045 is obtained from \(\frac{30}{100}\times\frac{15}{100}\), which earns M1 only.
Sight of \(\frac{30}{100}\) and \(\frac{15}{99}\) not in a product earns M0.
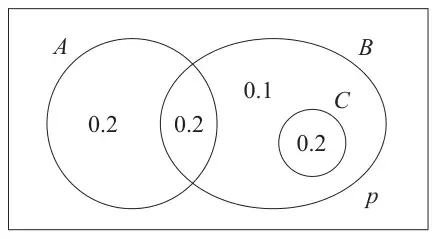
1. The events \(A\) and \(B\) are such that \(\text{P}(A)=0{\cdot}3\), \(\text{P}(B)=0{\cdot}2\) and \(\text{P}(A\cap B)=0{\cdot}1\).
(a) Find \(\text{P}(A\cup B)\). [2]
The event \(C\) is such that \(\text{P}(C)=0{\cdot}45\). The events \(B\) and \(C\) are independent.
(b) Find \(\text{P}(B\cap C)\). [2]
The events \(A\) and \(C\) are mutually exclusive.
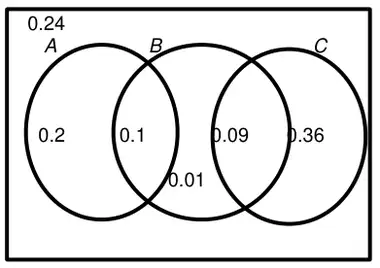
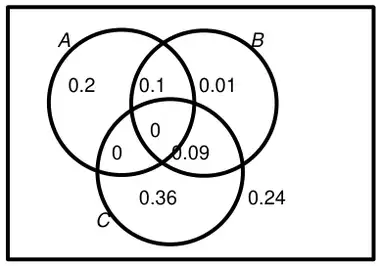
(c) Draw a Venn diagram to show the events \(A\), \(B\) and \(C\). Include the probability for each distinct region on your diagram. [4]
(d) Find \(\text{P}\big((B\cup C)'\big)\). [2]
Mark scheme (a)
Scheme
Marks
Comments
\(\text{P}(A\cup B)=0.3+0.2-0.1\)
M1
Use of addition formula \(\text{P}(A\cup B)=\text{P}(A)+\text{P}(B)-\text{P}(A\cap B)\)
\(\text{P}(A\cup B)=0.4\)
A1
Condone missing labels
Mark scheme (b)
Scheme
Marks
Comments
\(\text{P}(B\cap C)=0.2\times 0.45\)
M1
Use of \(P(B\cap C)=P(B)P(C)\)
\(\text{P}(B\cap C)=0.09\)
A1
Condone missing labels
Mark scheme (c)
Scheme
Marks
Comments
B1
B1
B1
B1
FT their 0.09 for possible B1B1B1B1 (provided all valid probabilities) B1 for three overlapping circles with A, B and C labelled with A&B and B&C intersecting and NOT A&C, or \(\text{P}(A\cap C)=0\) (condone box omitted) B1 for 0.1 and 0.09 seen within a valid Venn diagram. B1 for any two of 0.24, 0.2, 0.01, 0.36 Allow written with correct notation: \(P(A'\cap B'\cap C')=0.24,\) \(P(A\cap B'\cap C')=0.2\) \(P(A'\cap B\cap C')=0.01\) \(P(A'\cap B'\cap C)=0.36\) B1 for all of 0.24, 0.2, 0.01 and 0.36 within a fully valid Venn diagram inclusive of box.
Alternative (Method 2)
Scheme
Marks
Comments
OR may see
(B1)
(B1)
(B1) (B1)
B1 for three overlapping circles with A, B and C labelled with \(\text{P}(A\cap B\cap C)=0\) and \(P(A\cap B'\cap C)=0\) (condone box omitted) B0 if these are blank (must contain 0) B1 for 0.1 and 0.09 seen within a valid Venn diagram. B1 for any two of 0.24, 0.2, 0.01, 0.36 B1 for all of 0.24, 0.2, 0.01 and 0.36 within a fully valid Venn diagram inclusive of box.
Mark scheme (d)
Scheme
Marks
Comments
Use of Venn diagram to find \(P\big((B\cup C)'\big)\) directly. \(\text{P}\big((B\cup C)'\big)=0.2+0.24\)
M1
\(\text{P}(B\cup C')\) is M0A0 FT their “0.2” and “0.24” provided two valid probabilities added to give an answer between 0 and 1.
\(\text{P}\big((B\cup C)'\big)=0.44\)
A1
FT (c) provided valid probability.
Total [10]
Alternative (OR use of Venn diagram to find \(P(B\cup C)\))
Scheme
Marks
Comments
Use of \(1-\text{P}(B\cup C)=1-(0.1+0.01+0.09+0.36)\)
(M1)
FT their "\(0.09\)" provided valid prob with attempt to subtract from 1. Final answer between 0 and 1 to earn M1.
\(\text{P}\big((B\cup C)'\big)=1-0.56=0.44\)
(A1)
Alternative (OR use of addition formula to find \(P(B\cup C)\))
Scheme
Marks
Comments
Use of \(1-P(B\cup C)=1-(0.2+0.45-0.09)\)
(M1)
FT their “\(0.09\)” provided valid prob with attempt to subtract from 1. Final answer between 0 and 1 to earn M1.
Reminder: Sufficient working must be shown to demonstrate the mathematical method employed.
1. Three events \(A\), \(B\), \(C\) are such that \(\text{P}(B)=\dfrac{1}{5}\), \(\text{P}(C)=\dfrac{1}{6}\), \(\text{P}(A\cup B)=\dfrac{3}{4}\), \(\text{P}(A\cup C)=\dfrac{5}{6}\).
The events \(A\) and \(B\) are independent.
(a) Find \(\text{P}(A)\). [3]
(b) Determine whether or not \(A\) and \(C\) are independent. [3]
(c) What can be said about the events \(B\) and \(C\) if \(B\cap C=\varnothing\)? [1]
Mark scheme (a)
Scheme
Marks
Comments
Correct use of \(P(A\cup B)=P(A)+P(B)-P(A\cap B)\)
M1
Use of addition formula with at least \(P(A\cup B)\) and \(P(B)\) correct.
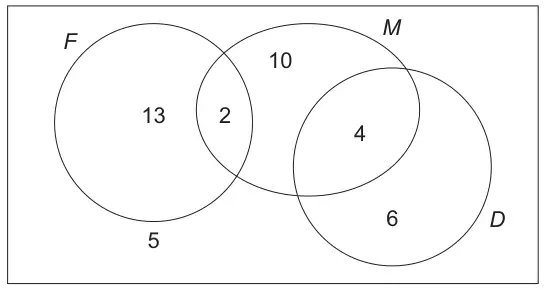
2. The Venn diagram shows the subjects studied by 40 sixth form students. \(F\) represents the set of students who study French, \(M\) represents the set of students who study Mathematics and \(D\) represents the set of students who study Drama. The diagram shows the number of students in each set.
(a) Explain what \(M\cap D'\) means in this context. [1]
(b) One of these students is chosen at random. Find the probability that this student studies
(i) exactly two of these subjects,
(ii) Mathematics or French or both. [3]
(c) Determine whether studying Mathematics and studying Drama are statistically independent for these students. [3]
Mark scheme (a)
Scheme
Marks
Comments
(The set of) students who study Mathematics and not Drama.
E1
Do not accept reference to ‘number of students’ or ‘probability’
Mark scheme (b)
Scheme
Marks
Comments
(i) \(\dfrac{6}{40}\) OR \(\dfrac{3}{20}\) OR 0.15
We'd like to use Google Analytics cookies to count visits and see which pages help most. They're optional, and the site works exactly the same either way. Privacy policy