
June 2019 Statistics Q2
2. The Venn diagram shows three events, \(A\), \(B\) and \(C\), and their associated probabilities.
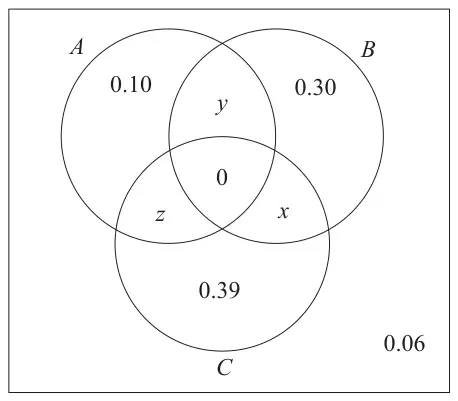
Events \(B\) and \(C\) are mutually exclusive.
Events \(A\) and \(C\) are independent.
Showing your working, find the value of \(x\), the value of \(y\) and the value of \(z\). (5)
| Scheme | Marks | AO |
|---|---|---|
| \(x = 0\) | B1 | 2.2a |
| \(\mathrm{P}(A) = 0.1 + z + y \qquad \mathrm{P}(C) = 0.39 + z[+x] \qquad \mathrm{P}(A \text{ and } C) = z\) | M1 | 2.1 |
| \(\mathrm{P}(A \text{ and } C) = \mathrm{P}(A) \times \mathrm{P}(C) \to z = (0.1 + z + y) \times (0.39 + z[+x])\) | M1 | 1.1b |
| \(\left[\sum p = 1\right]\) \(0.06 + 0.3 + 0.39 + 0.1 + z + y[+x] = 1 \to [z + y[+x] = 0.15]\) | M1 | 1.1b |
| Solving (simultaneously) leading to \(\underline{z = 0.13}\quad \underline{y = 0.02}\) | A1 | 1.1b |
| (5 marks) |
Notes
B1: for \(x = 0\), may be seen on Venn diagram
M1: Identifying the probabilities required for independence and at least 2 correct
These must be labelled
If there are no labels, then this may be implied by \(z = (0.1 + z + y)(0.39 + z\ [+x])\), allow one numerical slip
Allow e.g.
\(\mathrm{P}(A^{\prime}) = 0.39 + 0.30 + 0.06[+x] \qquad \mathrm{P}(C) = 0.39 + z[+x] \qquad \mathrm{P}(A^{\prime} \text{ and } C) = 0.39\)
[Not on spec. but you may see use of conditional probabilities]
M1: Use of independence equation with their labelled probabilities in terms \(y\), \(z\) [and \(x\)]
All their probabilities must be substituted into a correct formula
Sight of a correct equation e.g. \(z = (0.1 + z + y)(0.39 + z\ [+x])\) scores M1M1
M1: Using \(\Sigma p = 1\)
Implied by \([x\ +]\ y + z = 0.15\)
or their \(x + y + z = 0.15\) where \(x\), \(y\), and \(z\) are all probabilities
or e.g. \(\mathrm{P}(A) = 0.25\)
A1: both \(y = 0.02\) and \(z = 0.13\)