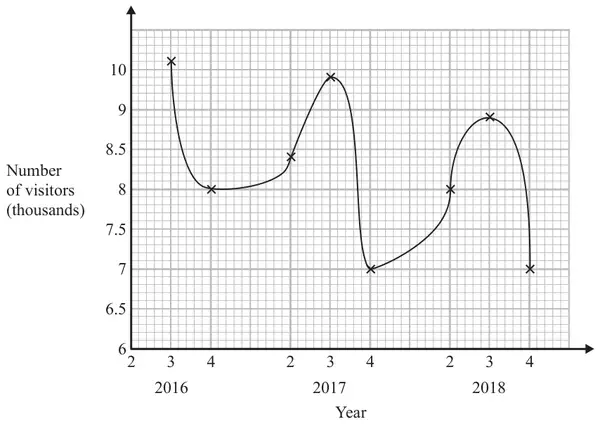
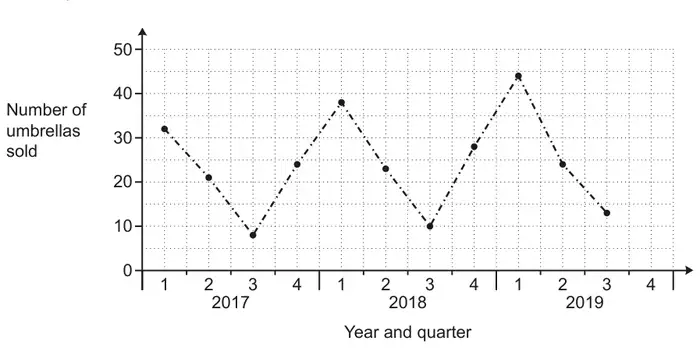
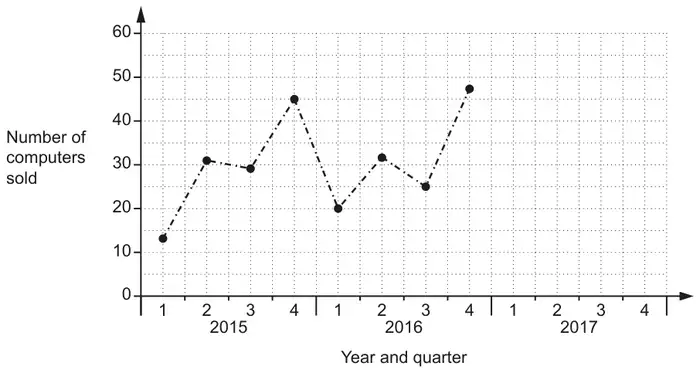
27 Sean has drawn a time series graph to show the numbers, in thousands, of visitors to a fun park.
Write down two things that are wrong or could be misleading with this graph. (2)
Mark scheme
Answer
Mark
Mark scheme
statement
B2
Two different statements Acceptable eg should be joined with straight lines (not curve)/should use a ruler 1st (quarter) not shown/plotted/labelled/not all quarters labelled does not show all 4 seasons 9.5 missing from vertical axes/not linear vertical (number) axis does not start at 0/the \(y\) axis starts at 6 the graph does not begin at 0, it starts at 6 it is not clear what 2, 3, 4 on the \(x\)-axis mean the scale of years doesn’t make sense there is lack of clarity about what the numbers on the \(x\) axis represent graph is curved line Not acceptable eg no value plotted for 2 in 2016 it does not start at 0 (no reference to vertical axis)/missing 0 they should not have connected the dots like that the numbers on the \(x\) axis are repeated the numbers along the \(x\) axis 2, 3, 4 the years on the \(x\) axis have not been written properly does not follow a sequence it needs a discontinuity wiggle on the axis no title
(B1
One statement eg from those above.)
Additional guidance
Ignore additional statements provided no contradiction
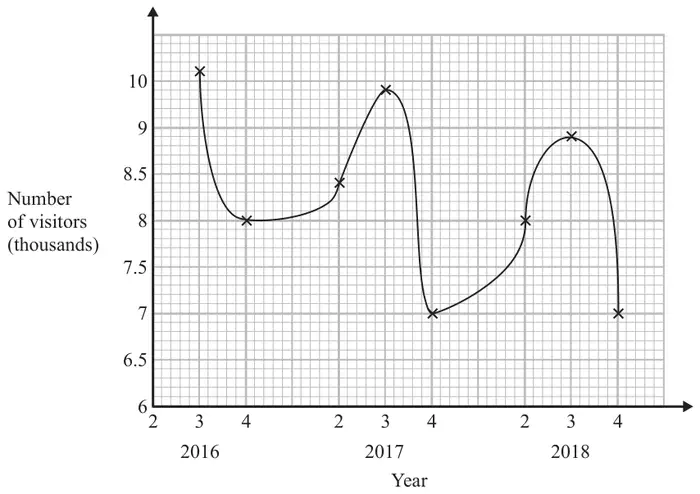
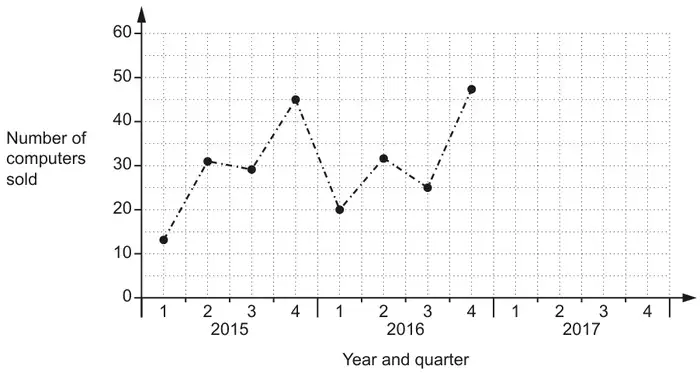
4 Sean has drawn a time series graph to show the numbers, in thousands, of visitors to a fun park.
Write down two things that are wrong or could be misleading with this graph. (2)
Mark scheme
Answer
Mark
Mark scheme
statement
B2
Two different statements Acceptable eg should be joined with straight lines (not curve)/should use a ruler 1st (quarter) not shown/plotted/labelled/not all quarters labelled does not show all 4 seasons 9.5 missing from vertical axes/not linear vertical (number) axis does not start at 0/the y axis starts at 6 the graph does not begin at 0, it starts at 6 it is not clear what 2, 3, 4 on the x-axis mean the scale of years doesn’t make sense there is lack of clarity about what the numbers on the x axis represent graph is curved line Not acceptable eg no value plotted for 2 in 2016 it does not start at 0 (no reference to vertical axis)/missing 0 they should not have connected the dots like that the numbers on the x axis are repeated the numbers along the x axis 2, 3, 4 the years on the x axis have not been written properly does not follow a sequence it needs a discontinuity wiggle on the axis no title
(B1
One statement eg from those above.)
Additional guidance
Ignore additional statements provided no contradiction
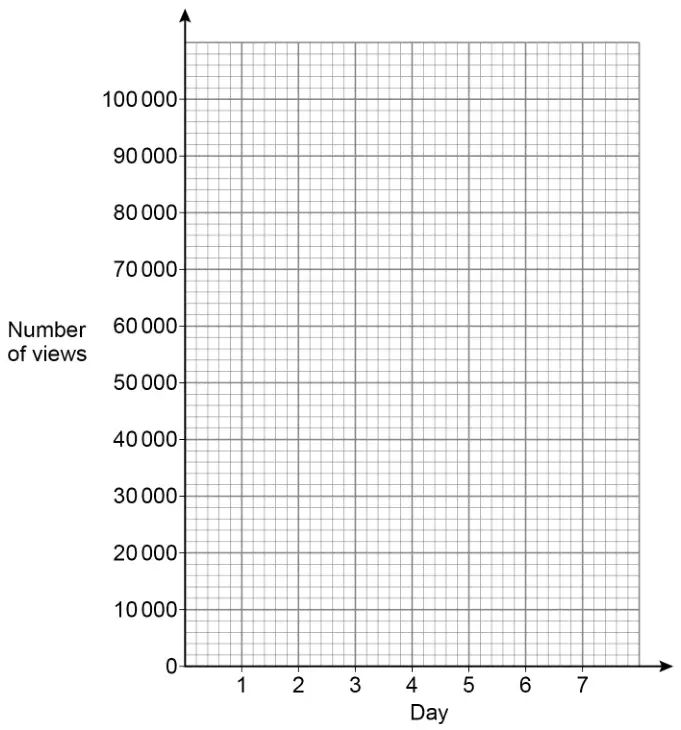
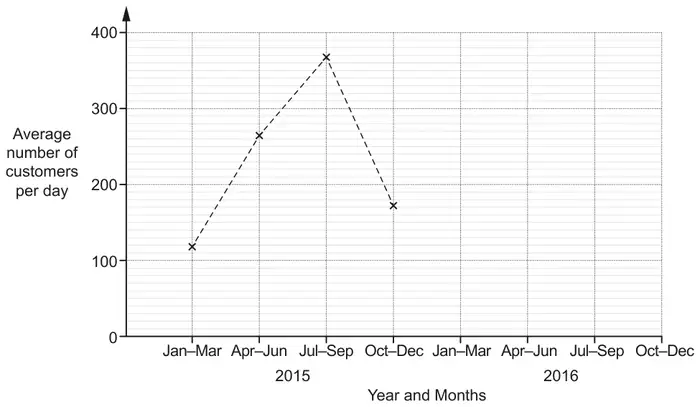
20 Youssuf posted an advert on his social media channel.
The table shows the number of views of the advert during its first 6 days.
Day
1
2
3
4
5
6
Number of views
49 000
95 000
87 000
77 000
64 000
48 000
(a) On the grid, draw a time series graph to represent the data. [2 marks]
(b) Youssuf receives 0.018p for each view of the advert.
Estimate how much he receives from views of the advert on day 7[3 marks]
Mark scheme (a)
Answer
Mark
Comments
All six given points plotted correctly and joined with straight lines
B2
\(\pm\) half square B1 at least four of the given points plotted correctly
Additional guidance
Mark intention for straight lines
Lines can be dashed (do not regard as short lines if intention clear) or continuous
Ignore lines drawn to the left of day 1 and to the right of day 6
The top of the lines in a vertical line graph can imply points plotted correctly (other vertical lines can be ignored)
Ignore horizontal lines
Ignore extra points
Ignore a line of best fit and/or a histogram and/or a bar chart
Mark scheme (b)
Answer
Mark
Comments
[20 000, 40 000]
B1
may be implied
their [20 000, 40 000] \(\times\) 0.018 (\(\div\) 100) or [360, 720] (\(\div\) 100)
M1
oe eg their [20 000, 40 000] \(\times\) 0.000 18 1000 \(\lt\) their [20 000, 40 000] \(\lt\) 48 000 condone 0.02 for 0.018
[3.60, 7.20]
A1ft
ft B0M1 answer must be an amount of money
Additional guidance
Accept an answer in pence only if £ has been crossed out and p(ence) is given
For A1 or A1ft accept answers rounded or truncated to the nearest penny eg \(28\,700 \times 0.018 \div 100\) Answer 5.17 (or 5.16)
B1M1A1
Using 0.02 can score a maximum of B1M1A0 eg1 \(30\,000 \times 0.02 = 600\) Answer 6 eg2 \(46\,000 \times 0.02 = 920\) Answer 9.20
B1M1A0 B0M1A0
Estimating their final answer can score a maximum of B1M1A0 unless correct answer also seen eg1 \(32\,000 \times 0.018 \div 100\) Answer 5.80 eg2 \(32\,000 \times 0.018 \div 100 = 5.76\) Answer 5.80
B1M1A0 B1M1A1
\(30\,000 \times 0.018\) Answer 5.4
B1M1A0
If part (b) is blank, B1 may be awarded for [20 000, 40 000] unambiguously stated for day 7 in part (a)
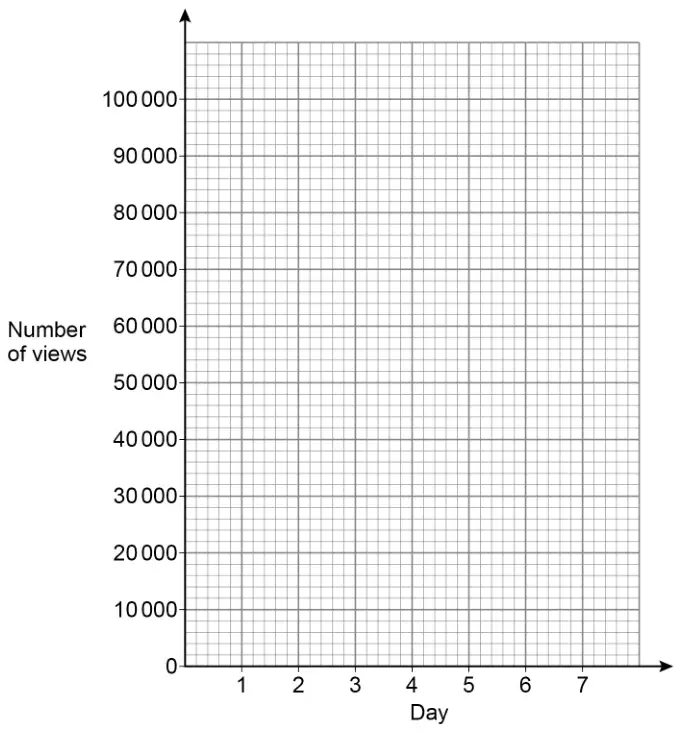
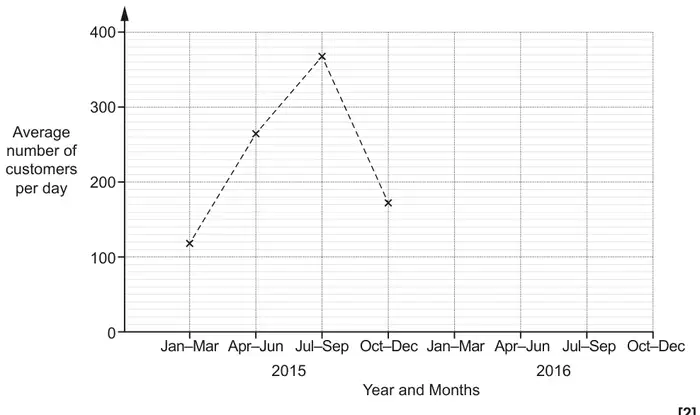
3 Youssuf posted an advert on his social media channel.
The table shows the number of views of the advert during its first 6 days.
Day
1
2
3
4
5
6
Number of views
49 000
95 000
87 000
77 000
64 000
48 000
(a) On the grid, draw a time series graph to represent the data. [2 marks]
(b) Youssuf receives 0.018p for each view of the advert.
Estimate how much he receives from views of the advert on day 7[3 marks]
Mark scheme (a)
Answer
Mark
Comments
All six given points plotted correctly and joined with straight lines
B2
\(\pm\) half square B1 at least four of the given points plotted correctly
Additional guidance
Mark intention for straight lines
Lines can be dashed (do not regard as short lines if intention clear) or continuous
Ignore lines drawn to the left of day 1 and to the right of day 6
The top of the lines in a vertical line graph can imply points plotted correctly (other vertical lines can be ignored)
Ignore horizontal lines
Ignore extra points
Ignore a line of best fit and/or a histogram and/or a bar chart
Mark scheme (b)
Answer
Mark
Comments
[20 000, 40 000]
B1
may be implied
their [20 000, 40 000] \(\times\) 0.018 (\(\div\) 100) or [360, 720] (\(\div\) 100)
M1
oe eg their [20 000, 40 000] \(\times\) 0.000 18 1000 \(\lt\) their [20 000, 40 000] \(\lt\) 48 000 condone 0.02 for 0.018
[3.60, 7.20]
A1ft
ft B0M1 answer must be an amount of money
Additional guidance
Accept an answer in pence only if £ has been crossed out and p(ence) is given
For A1 or A1ft accept answers rounded or truncated to the nearest penny eg \(28\,700 \times 0.018 \div 100\) Answer 5.17 (or 5.16)
B1M1A1
Using 0.02 can score a maximum of B1M1A0 eg1 \(30\,000 \times 0.02 = 600\) Answer 6 eg2 \(46\,000 \times 0.02 = 920\) Answer 9.20
B1M1A0 B0M1A0
Estimating their final answer can score a maximum of B1M1A0 unless correct answer also seen eg1 \(32\,000 \times 0.018 \div 100\) Answer 5.80 eg2 \(32\,000 \times 0.018 \div 100 = 5.76\) Answer 5.80
B1M1A0 B1M1A1
\(30\,000 \times 0.018\) Answer 5.4
B1M1A0
If part (b) is blank, B1 may be awarded for [20 000, 40 000] unambiguously stated for day 7 in part (a)
The table shows the number he sold each quarter for three years.
Quarter 1
Quarter 2
Quarter 3
Quarter 4
2016
17
64
50
5
2015
9
72
61
1
2014
19
58
53
2
(a) In which year did he sell the most lawnmowers?
You must show your working. [2 marks]
(b) He uses the table to decide the number of lawnmowers to stock each quarter.
At the start of which quarter should Chris stock the most lawnmowers?
Circle your answer. [1 mark]
Quarter 1
Quarter 2
Quarter 3
Quarter 4
Mark scheme (a)
Answer
Mark
Comments
Alternative method 1
Two of the three totals correct (2016 =) 136 (2015 =) 143 (2014 =) 132 or 17 + 64 + 50 + 5 and 9 + 72 + 61 + 1 and 19 + 58 + 53 + 2
M1
Totals may be seen by table Correct totals may be implied by means (2016 \(\rightarrow\) 34, 2015 \(\rightarrow\) 35.75, 2014 \(\rightarrow\) 33) Addition signs must be shown for horizontal addition but may be implied by a column of numbers in their working
136 and 143 and 132 and 2015 or 34 and 35.75 and 33 and 2015
A1
Totals may be seen by table
Alternative method 2
8 and –8 and –11 and 4 or –7 and –10 and 14 and 8 and –1 or 11
M1
Difference between 2016 and 2015 Difference between 2015 and 2014 Differences may be seen in table
–7 and 11 and 2015
A1
Differences may be seen in table
Additional guidance
Differences may have consistently opposite signs for either comparison
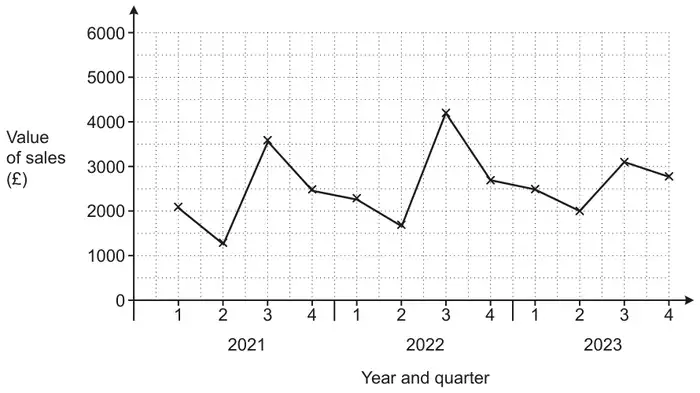
21 The graph shows the value of sunscreen products sold in a shop for each quarter from quarter 1 of 2021 to quarter 4 of 2023.
(a) Make one comment about the annual variation shown in this graph. [1]
(b) In one of these years, quarter 3 was very cloudy. Write down which year this is most likely to be. Give a reason for your answer. [1]
(c) The manager of the shop says that the value of sales in quarter 4 of 2024 will be £3100. What assumption has the manager made? [1]
Mark scheme (a)
Answer
Marks
Part marks and guidance
Repeating pattern
1
Accept any correct pattern that repeats annually Accept reference to seasons for Qs e.g. Lower in q2 than q1 or Highest in q3 or Lowest in q2 etc or Sales in q1 or 2 or 4 rise each year Do not accept “Low sales in 2023” etc
Mark scheme (b)
Answer
Marks
Part marks and guidance
2023 and [Q3 is] lower than in the other years oe
1
Accept summer or “it” etc for Q3 Condone [Year] 3 for [Year] 2023 Examples It didn’t increase as much as other years They had the least amount of sales. Sales rose but not as much as other years It is lower The sales are lower/est [in 2023] The graph shows less sales of products (BOD)
Mark scheme (c)
Answer
Marks
Part marks and guidance
The trend/pattern will continue oe
1
Do not accept references to the weather Do not accept “Sales stay the same” Accept e.g. Sales will increase The pattern stays the same
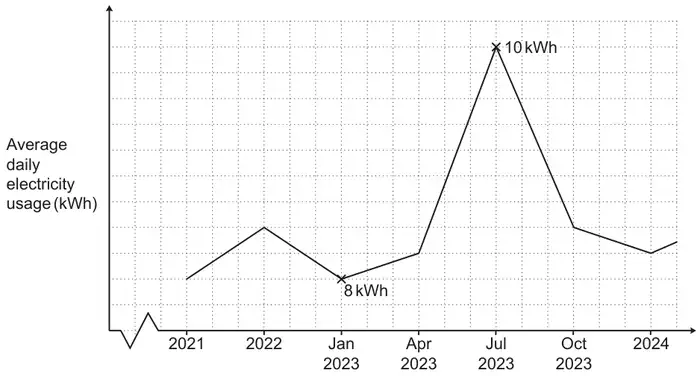
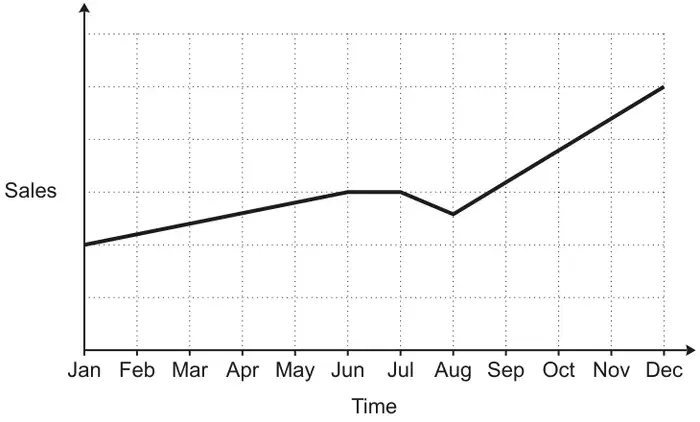
14 A sales representative and a manager discuss this graph of sales over the last year.
(a) The sales representative says
I can tell from the graph that, over the last year, sales have risen every month.
Is the sales representative correct? Give a reason for your answer. [1]
(b) The manager says
I can tell from the graph that sales are now more than double what they were at the start of the year.
Is the manager correct? Give a reason for your answer. [1]
Mark scheme (a)
Answer
Marks
Part marks and guidance
No with the graph is not rising month on month as they are flat in June and/or dip in July oe
1
Allow for comment on either the flat or dip in the graph e.g. sales fell between July and August
Do not accept incorrect statements
See Appendix 1
Appendix
Appendix 1 Q14a
Accept reasons that refer to being flat in one month [June or June to July or July] or dip in another month [July or July to August or August]. If the month is mentioned then it must be correct – any of the bracketed months
Response
Mark
1
No, the sales remained flat in July
1
2
No, the sales did not grow/stayed the same in June and July
1
3
No, the sales dipped in August
1
4
No, there was a decrease in July
1
5
No, there were two months where sales did not grow
1
6
No, sales went down from July to August
1
7
No, in July there is a dip in the graph
1
8
No, in June and July the sales were the same
1
9
Wrong, July the sales dropped
1
10
No, the sales increased then stopped and decreased then it increased. (Describes shape and does not refer to wrong months)
1
11
No, in August it drops down then goes back up
1
12
No from June to August the sales dropped (No as part of the statement is incorrect)
0
13
No, the sales went down at July and only started to rise again middle of August. (Incorrect statement)
0
Mark scheme (b)
Answer
Marks
Part marks and guidance
No with no vertical scale numbering so cannot see if sales have doubled oe
1
Accept: No with no values/data/figures/numbers/%s shown [on sales axis]
See Appendix 2
Appendix
Appendix 2 Q14b
Response
Mark
1
No, the scale may not start from 0. (Implies no figures on sales axis)
1
2
No, because on the graph no numbers we can’t know exactly.
1
3
No, on the graph it’s doesn’t show the % of sales to check if it double.
1
4
No, it doesn’t show what it is measured at. (Does not mention numbers/figures/values etc)
0
5
No, sales have tripled not doubled. There three times more sales.
0
6
No, slightly more than double.
0
7
No, at the end of the year it is only 3 more squares, it would have to be 4 to be double.
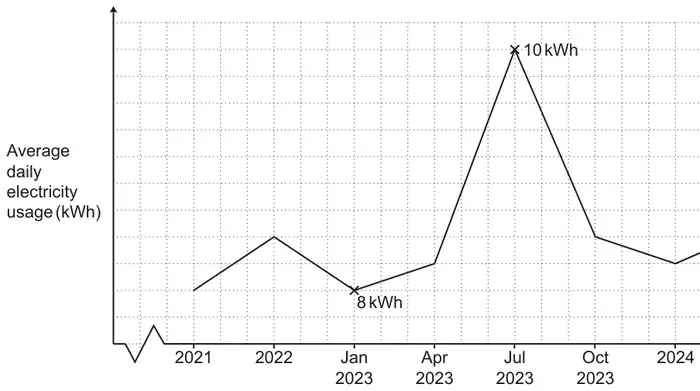
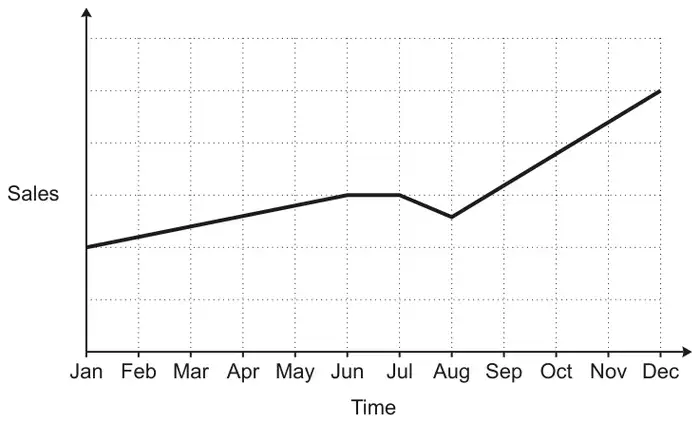
4 A sales representative and a manager discuss this graph of sales over the last year.
(a) The sales representative says
I can tell from the graph that, over the last year, sales have risen every month.
Is the sales representative correct? Give a reason for your answer. [1]
(b) The manager says
I can tell from the graph that sales are now more than double what they were at the start of the year.
Is the manager correct? Give a reason for your answer. [1]
Mark scheme (a)
Answer
Marks
Part marks and guidance
No with the graph is not rising month on month as they are flat in June and/or dip in July oe
1
Allow for comment on either the flat or dip in the graph e.g. sales fell between July and August Do not accept incorrect statements
See Appendix 1
Appendix 1: Q4(a)
Accept reasons that refer to being flat in one month [June or June to July or July] or dip in another month [July or July to August or August]. If the month is mentioned then it must be correct, accept any of the bracketed months
Response
Mark
1
No, the sales remained flat in July
1
2
No, the sales did not grow/stayed the same in June and July
1
3
No, the sales dipped in August
1
4
No, there was a decrease in July
1
5
No, there were two months where sales did not grow
1
6
No, sales went down from July to August
1
7
No, in July there is a dip in the graph
1
8
No, in June and July the sales were the same
1
9
Wrong, July the sales dropped
1
10
No, the sales increased then stopped and decreased then it increased. (Describes shape and does not refer to wrong months)
1
11
No, in August it drops down then goes back up
1
12
No from June to August the sales dropped (No as part of the statement is incorrect)
0
13
No, the sales went down at July and only started to rise again middle of August. (Incorrect statement)
0
Mark scheme (b)
Answer
Marks
Part marks and guidance
No with no vertical scale numbering so cannot see if sales have doubled oe
1
Accept: No with no values/data/figures/numbers/%s shown [on sales axis]
See Appendix 2
Appendix 2: Q4(b)
Response
Mark
1
No, the scale may not start from 0. (Implies no figures on sales axis)
1
2
No, because on the graph no numbers we can’t know exactly.
1
3
No, on the graph it’s doesn’t show the % of sales to check if it double.
1
4
No, it doesn’t show what it is measured at. (Does not mention numbers/figures/values etc)
0
5
No, sales have tripled not doubled. There three times more sales.
0
6
No, slightly more than double.
0
7
No, at the end of the year it is only 3 more squares, it would have to be 4 to be double.
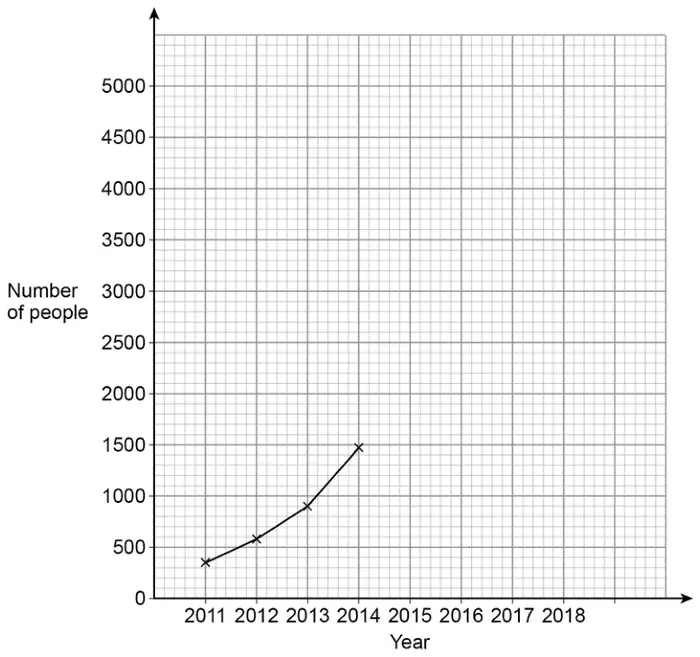
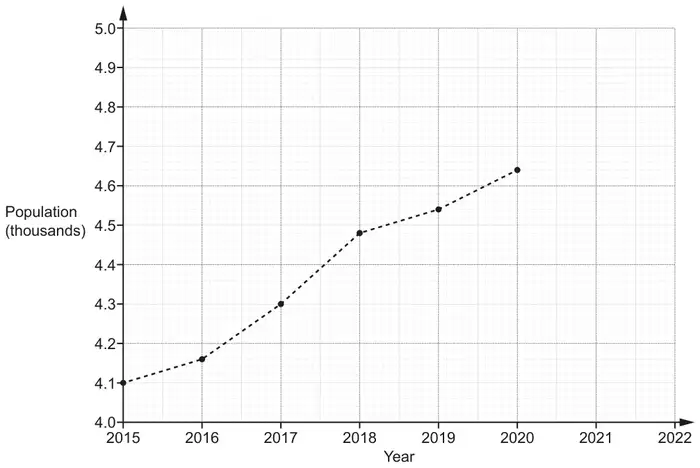
21 The graph shows information about the population of a village.
(a) The population of the village in 2021 was 4740.
Plot this point on the graph. [1]
(b) Work out the increase in the population of the village between 2016 and 2018. [2]
(c) Rowan says that there was a huge increase in the population of the village between 2015 and 2020.
Describe how Rowan may have been misled by the graph. [1]
(d) Blake says that the population of the village will be greater than 4800 in 2022.
Write down an assumption Blake has made. [1]
Mark scheme (a)
Answer
Marks
Part marks and guidance
Point correctly plotted
1
Accuracy \(\pm\) ½ small square radially, use overlay as a guide
Mark scheme (b)
Answer
Marks
Part marks and guidance
320
2
B1 for answer figs 32 or for 4160 or 4480
Don’t accept percentages.
Mark scheme (c)
Answer
Marks
Part marks and guidance
Only part of vertical scale is shown oe
1
e.g. Because the population axis starts at 4000, 4.0 [thousand] Vertical axis does not start at 0 She may have just looked at the steepness of the graph and not the scale of the graph/numbers Accept it only goes up by 540
See AG
Any incorrect statements/incorrect specific values scores zero
Appendix
Appendix Q21c
Response
Mark
1
It/the graph/ [y] axis/the population/the scale does not start at zero
1
2
Hasn’t realised the population is only going up by 100 each time, so it isn’t a huge increase (BOD implied axis and info on scale provided – huge increase implies steepness)
1
3
It has only gone up by 540 [people] (accept reference to the value of the increase if value is correct)
1
4
The graph has gone up by a lot but it is only around 500 (accept reasonable approximation of increase with steepness implied)
1
5
The line on the graphs varied significantly but the value changed by only 600 (value is incorrect and no ref to steepness)
0
6
Each big tile is on the graph shows 100 people (not enough – need to refer to graph not starting as zero or steepness)
0
7
The steepness on the graph makes him think it has gone up a lot but the graph is going up in 1000s (1000s is incorrect we would accept 100s or 0.1s)
0
8
The y axis is too small so it makes it look like there has been a huge increase ( lacks detail about scale on y axis)
0
9
The scale makes it look like it has gone up a lot when it really only a little (not enough – needs to ref steepness and scale)
0
10
He used the steepness of the line to judge the increase ( needs detail about scale)
0
11
The continuing rising of the graph population and not reading the numbers properly (not enough – steepness and scale needed)
0
12
Rowan didn’t read the graph correct. 2015=4100, 2020=4630. Not a huge increase (Error with one value 4630 – otherwise we would accept with accurate values also)
0
13
May have been misled by not reading the graph properly as it only went up by 640 (specific value given which is incorrect)
0
14
By not looking at the figures and going by the plots rising. (implies steepness but too vague with vertical scale)
0
15
Because of how much the line is rising may seem there is a rapid increase. ( no ref to scale)
0
16
He may think it goes up by thousands, but there has been less than a thousand people
0
17
By just looking at the plots on the graph and not looking at the actual numbers (right idea but need to ref steepness and scale)
0
18
As the graph is only going up 100 between each box yet he sees it large by the depth (not enough - if steepness rather than depth then fine)
0
19
Just because the line gets higher doesn't mean its a huge increase (need to ref scale)
0
20
Because the line increased by a lot, but the numbers didn't (not enough – need more detail about the scale)
0
21
May have been misled by the sharp diagonal line on the graph (no detail on scale)
0
Mark scheme (d)
Answer
Marks
Part marks and guidance
Increasing trend continues oe
1
e.g. The population growth will continue the same as in previous years People will not leave the village and the increase continues
If a number is given with the increase then it should be at least 60
See AG
Any incorrect specific value(s) scores zero
Appendix
Appendix Q21d
Response
Mark
1
The population will increase at the same/constant rate
1
2
The population will continue to increase
1
3
The population will increase by [more than] a thousand/600/60
1
4
The population will keep growing by birth or migration
1
5
The population will increase by 60, the population increases by more than 60
1
6
The graph will follow the same trend
1
7
That the population will carry on rising like the past years
1
8
he has estimated this through the constant population increase (trend is implied, ignore constant)
1
9
The graph will continue growing in the same way and shape as it was this morning (Fine describes trend – ignore ref to morning)
1
10
because of how the previous years were going he thinks it will stay in that pattern (BOD stay in that pattern for trend)
1
11
the birth rate will stay the same (not enough to imply population will increase – deaths etc?)
0
12
2022 will be greater than 4800 if 2021 is a population of 4740 (not enough as repeats what is in the question)
0
13
Blake may not be right as the population was increasing (does not describe the assumption)
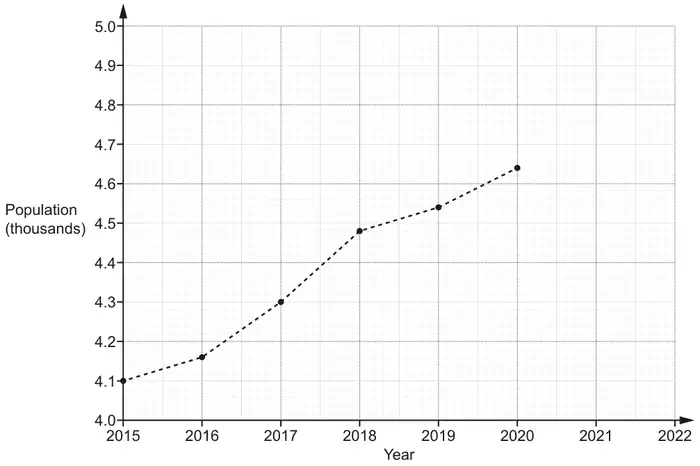
6 The graph shows information about the population of a village.
(a) The population of the village in 2021 was 4740. Plot this point on the graph. [1]
(b) Work out the increase in the population of the village between 2016 and 2018. [2]
(c) Rowan says that there was a huge increase in the population of the village between 2015 and 2020.
Describe how Rowan may have been misled by the graph. [1]
(d) Blake says that the population of the village will be greater than 4800 in 2022.
Write down an assumption Blake has made. [1]
Mark scheme (a)
Answer
Marks
Part marks and guidance
Point correctly plotted
1
Accuracy ± ½ small square radially, use overlay as a guide
Mark scheme (b)
Answer
Marks
Part marks and guidance
320
2
B1 for answer figs 32 or for 4160 or 4480
Don’t accept percentages
Mark scheme (c)
Answer
Marks
Part marks and guidance
Only part of vertical scale is shown oe
1
e.g. Because the population axis starts at 4000, 4.0 [thousand] Vertical axis does not start at 0 She may have just looked at the steepness of the graph and not the scale of the graph/numbers Accept it only goes up by 540
See AG Any incorrect statements/incorrect specific values scores zero
Appendix Q6c
Response
Mark
1
It/the graph/ [y] axis/the population/the scale does not start at zero
1
2
Hasn’t realised the population is only going up by 100 each time, so it isn’t a huge increase (BOD implied axis and info on scale provided – huge increase implies steepness)
1
3
It has only gone up by 540 [people] (accept reference to the value of the increase if value is correct)
1
4
The graph has gone up by a lot but it is only around 500 (accept reasonable approximation of increase with steepness implied)
1
5
The line on the graphs varied significantly but the value changed by only 600 (value is incorrect and no ref to steepness)
0
6
Each big tile is on the graph shows 100 people (not enough – need to refer to graph not starting as zero or steepness)
0
7
The steepness on the graph makes him think it has gone up a lot but the graph is going up in 1000s (1000s is incorrect we would accept 100s or 0.1s)
0
8
The y axis is too small so it makes it look like there has been a huge increase (lacks detail about scale on y axis)
0
9
The scale makes it look like it has gone up a lot when it really only a little (not enough – needs to ref steepness and scale)
0
10
He used the steepness of the line to judge the increase (needs detail about scale)
0
11
The continuing rising of the graph population and not reading the numbers properly (not enough – steepness and scale needed)
0
12
Rowan didn’t read the graph correct. 2015=4100, 2020=4630. Not a huge increase (Error with one value 4630 – otherwise we would accept with accurate values also)
0
13
May have been misled by not reading the graph properly as it only went up by 640 (specific value given which is incorrect)
0
14
By not looking at the figures and going by the plots rising. (implies steepness but too vague with vertical scale)
0
15
Because of how much the line is rising may seem there is a rapid increase. (no ref to scale)
0
16
He may think it goes up by thousands, but there has been less than a thousand people
0
17
By just looking at the plots on the graph and not looking at the actual numbers (right idea but need to ref steepness and scale)
0
18
As the graph is only going up 100 between each box yet he sees it large by the depth (not enough - if steepness rather than depth then fine)
0
19
Just because the line gets higher doesn't mean its a huge increase (need to ref scale)
0
20
Because the line increased by a lot, but the numbers didn't (not enough – need more detail about the scale)
0
21
May have been misled by the sharp diagonal line on the graph (no detail on scale)
0
Mark scheme (d)
Answer
Marks
Part marks and guidance
Increasing trend continues oe
1
e.g. The population growth will continue the same as in previous years People will not leave the village and the increase continues If a number is given with the increase then it should be at least 60
See AG Any incorrect specific values scores zero
Appendix 6d
Response
Mark
1
The population will increase at the same/constant rate
1
2
The population will continue to increase
1
3
The population will increase by [more than] a thousand/600/60
1
4
The population will keep growing by birth or migration
1
5
The population will increase by 60/ the population increases by more than 60
1
6
The graph will follow the same trend
1
7
That the population will carry on rising like the past years
1
8
He has estimated this through the constant population increase (trend is implied, ignore constant)
1
9
The graph will continue growing in the same way and shape as it was this morning (Fine describes trend – ignore ref to morning)
1
10
Because of how the previous years were going he thinks it will stay in that pattern (BOD stay in that pattern for trend)
1
11
The birth rate will stay the same (not enough to imply population will increase – deaths etc?)
0
12
2022 will be greater than 4800 if 2021 is a population of 4740 (not enough as repeats what is in the question)
0
13
Blake may not be right as the population was increasing (does not describe the assumption)
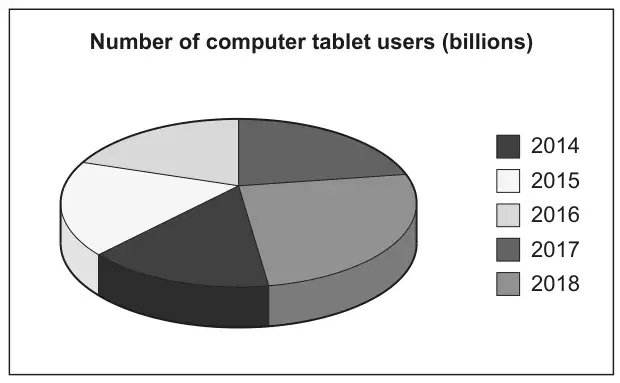
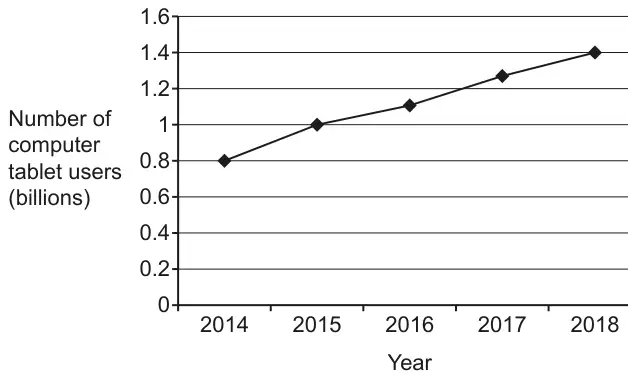
1 Two pupils are given data that shows the estimated number of computer tablet users worldwide from 2014 to 2018.
(a) Li creates this pie chart to show the data.
Write down two reasons why Li’s pie chart is not suitable to represent the data. [2]
(b) Amaya creates this line graph to show the same data.
Work out the percentage increase in the number of computer tablet users from 2014 to 2018. [4]
Mark scheme (a)
Answer
Marks
Part marks and guidance
Two correct different observations from these three categories No values shown e.g. Pie chart only shows proportions not totals
3D aspect e.g. 3D distorts perspective oe
Colours/key unclear e.g. The colour/key are too similar oe
2
B1 for one correct observation
e.g. We have no total/numbers/figures/frequency
e.g. It’s tilted, slanted, seen from an angle etc
Where more than two reasons are given, mark the best unless contradicted e.g. ignore all references to missing angles Do not allow 2 marks for two reasons that refer to the same category Two reasons may appear in the same statement e.g. Its slanted and it does not show the total number [gets 2 marks] See Appendix
Appendix: additional guidance for Q1(a)
Mark
Comments about no numbers
1
There are no numbers/figures/scale [to indicate total or numbers in sector]
1
2
You don’t know what its out of. You need to total [frequency]
1
3
Its difficult to tell the size of each fraction of the pie chart and we need the total(we need the total gets the mark)
1
4
We need to know the angle sizes and what its out of(and what its out of gets the mark provided they don’t say its out of 360)
1
5
Pie charts show proportions/fractions/%’s but do not show quantities
1
Comments about 3D aspect
6
She is viewing the chart from the side not the front
1
7
Its 3D
1
8
It is hard to see the fractions/proportions
1
9
The sections at the front look larger than those at the back
1
10
Its slanted so its hard to measure the angles (Its slanted gets the mark)
1
11
Not able to measure angles owing to the positioning of the pie chart(gets it for the underlined part)
1
Comments about key/colours
12
Segments are not clearly labelled (ref to colour reason)
1
13
The colours look the same. Some of the years are the same colour.
1
14
The parts need to be clearly labelled BOD related to colour
1
15
The colours are confusing
16
It does not tell us the size of each sector (size does not imply number – could be angles)
0
17
Pie charts are for discrete data only
0
18
It might not be accurate
0
19
We need to know the angle sizes
0
20
There are better ways to present the data
0
21
It doesn’t have any labels (Not true – there are labels but not very clear)
0
22
It is an estimated number of users
0
23
The data is not in percentages.
0
24
The sectors have no angles/percentages/fractions
0
25
The sections are similar in size making it unclear
0
26
Not exact figures/data lost
0
Mark scheme (b)
Answer
Marks
Part marks and guidance
75
4
B1 for 0.8 and 1.4 or 3 [rows] and 4 [rows] oe
Accept work in billions for B and M marks i.e 800 000 000 and 1 400 000 000
AND M2 for \(\dfrac{\textit{their } 1.4 - \textit{their } 0.8}{\textit{their } 0.8}\) or \(\dfrac{\textit{their } 1.4 - \textit{their } 0.8}{\textit{their } 0.8} \times 100\)
or for \(\dfrac{\textit{their } 1.4}{\textit{their } 0.8} \times 100\) [ –100] oe
M2 soi by 0.75 or 175
or M1 for \(\dfrac{\textit{their } 1.4}{\textit{their } 0.8}\)
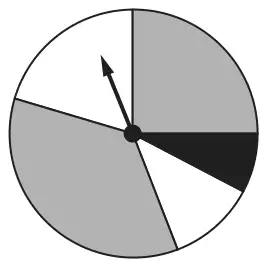
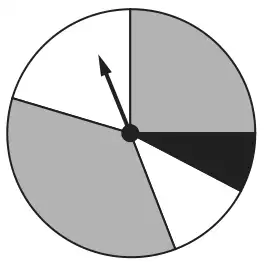
(a) This spinner has two grey sections, two white sections and one black section.
Vlad says
The probability of the spinner landing on black is \(\frac{1}{5}\).
Explain why Vlad is not correct. [1]
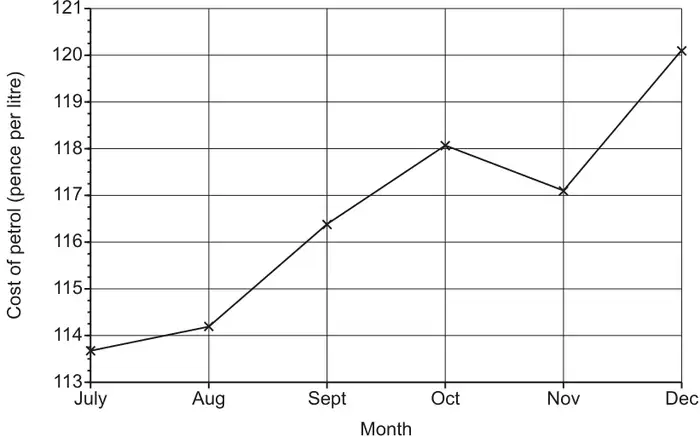
(b) The graph shows the cost of a litre of petrol for the last six months of 2017.
Explain why this graph is misleading. [1]
Mark scheme (a)
Answer
Marks
Part marks and guidance
Correct answer based on angle or area/arc length
1
The angle [for black] is too small oe or is less than a fifth oe or should be 72° oe The area/arc length [for black] is too small oe or is less than a fifth oe
Accept 26° to 30° for “the angle” Accept “not equal to” for “too small” or “less than” See appendix
Appendix: exemplar responses for Q3(a)
Response
Comment
Mark
The black section does not cover 1/5 of the spinner
“covering” implies area
1
The angle is 28°. It should be 72°.
1
1/5 is 72° and the black section is less than this
1
The angle is only 28.
Implied comparison with correct angle BOD Minimum case
1
Because 30/360 is 1/12
Comparing angle as fraction with common numerator with 1/5 (which is given) (3/36 is not enough to compare)
1
Because 28/360 = 0.07[…] not 0.2
Correct comparison (but (26 to 30)/360 needed for evidence of working with angle)
1
The angle is 28°.
Does not say that it should be 72 or is too small
0
The sections are not of equal area
0
The sections are not of equal width
0
The black section is the smallest section
0
The spinner is unequal and some spaces are the same colour but different size
0
It’s more like a tenth
No angle used to justify
0
Mark scheme (b)
Answer
Marks
Part marks and guidance
Any comment recognising limitations in range of the vertical scale
1
e.g. It does not start at zero or It starts at 113 See appendix
Appendix: exemplar responses for Q3(b)
Response
Comment
Mark
The graph starts at 113
Recognises limitation in scale
1
The y-axis is only from 113 to 121
Recognises limitation in scale
1
Because you don’t see anything below 113
Recognises limitation in scale
1
You can’t read between the numbers on the scale
Does not recognise limitations in the range of the scale
0
It doesn’t start from the bottom of the graph and the units go up in an unusual pattern.
Too vague.
0
It looks as though there has been a drastic increase in price when there hasn’t.