
Higher November 2018 Paper 3 Q6
6 A music festival has taken place each year from 2011
The table shows the number of people who attended each year.
| Year | 2011 | 2012 | 2013 | 2014 | 2015 | 2016 | 2017 | 2018 |
|---|---|---|---|---|---|---|---|---|
| Number of people | 350 | 583 | 906 | 1471 | 2023 | 2612 | 3251 | 3780 |
The festival organisers draw a time series graph to represent the data.
The first four years have been plotted.
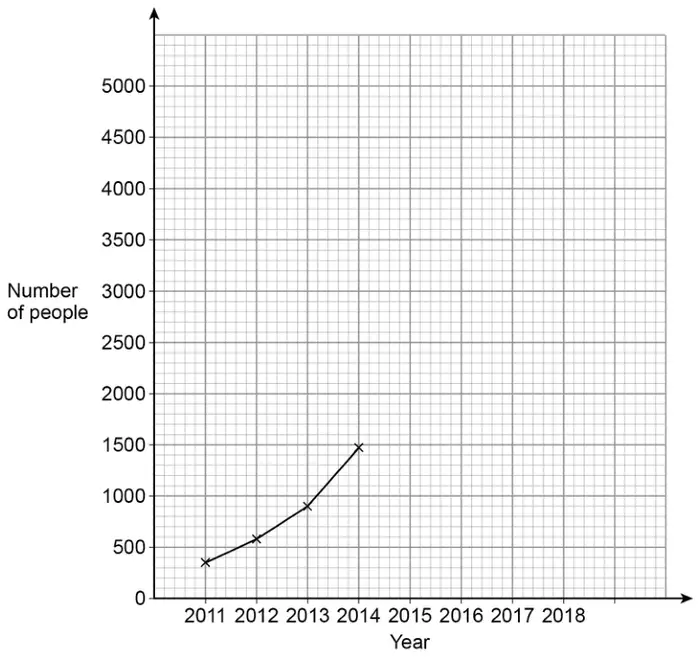
(a) Complete the graph. [2 marks]
(b) Use the graph to estimate the number of people who will attend the festival in 2019 [2 marks]
| Answer | Mark | Comments |
|---|---|---|
| Plots at least 3 points correctly | M1 | Plots within the correct 2 mm vertical square |
| Fully correct with all points joined | A1 |
| Answer | Mark | Comments |
|---|---|---|
| [4200, 4500] | B2 | B1 Any indication the 2018 figure is being increased for 2019 eg a point plotted for 2019 that is greater than 3780 |
Additional guidance
| Answer in range with or without working | B2 |
| 4300 – 4350 on answer line (both values in range) | B2 |
| 4400 – 4600 on answer line (one value in range) | B1 |
| Answer outside of range but between 3780 and 4200 | B1 |
| Answer outside of range but greater than 4500 | B1 |