
Higher June 2019 Paper 3 Q4
4 Sean has drawn a time series graph to show the numbers, in thousands, of visitors to a fun park.
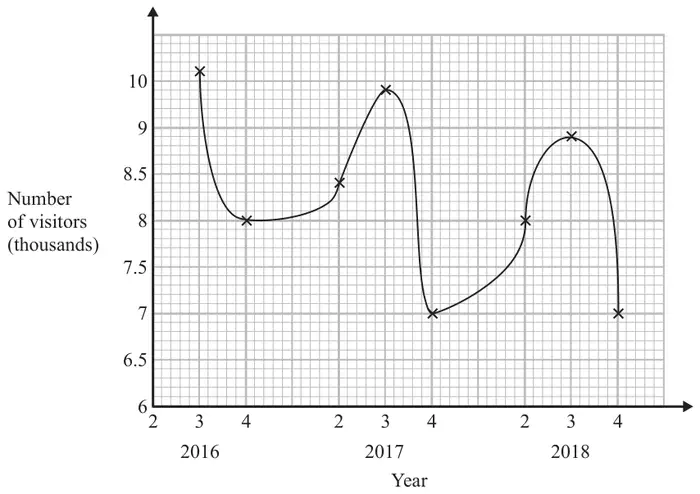
Write down two things that are wrong or could be misleading with this graph. (2)
| Answer | Mark | Mark scheme |
|---|---|---|
| statement | B2 | Two different statements Acceptable eg should be joined with straight lines (not curve)/should use a ruler 1st (quarter) not shown/plotted/labelled/not all quarters labelled does not show all 4 seasons 9.5 missing from vertical axes/not linear vertical (number) axis does not start at 0/the y axis starts at 6 the graph does not begin at 0, it starts at 6 it is not clear what 2, 3, 4 on the x-axis mean the scale of years doesn’t make sense there is lack of clarity about what the numbers on the x axis represent graph is curved line Not acceptable eg no value plotted for 2 in 2016 it does not start at 0 (no reference to vertical axis)/missing 0 they should not have connected the dots like that the numbers on the x axis are repeated the numbers along the x axis 2, 3, 4 the years on the x axis have not been written properly does not follow a sequence it needs a discontinuity wiggle on the axis no title |
| (B1 | One statement eg from those above.) |
Additional guidance
Ignore additional statements provided no contradiction