
Foundation November 2017 Paper 2 Q8
8 Chrissy drew this graph to show the percentage of buses that got to a bus stop on time for six months.
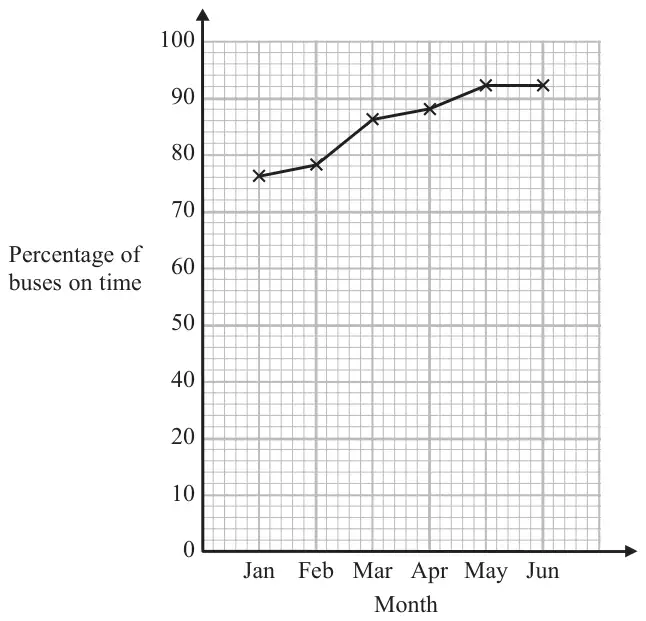
(a) Write down one thing that is wrong with the graph. (1)
(b) Describe the trend in the percentage of buses that got to the bus stop on time. (1)
| Answer | Mark | Notes |
|---|---|---|
| Statement | C1 | States one thing wrong eg vertical scale is not linear oe |
| Answer | Mark | Notes |
|---|---|---|
| Trend described | C1 | eg the trend is upwards, positive (trend) oe |