
Foundation November 2023 Paper 3 Q21
21 The graph shows the value of sunscreen products sold in a shop for each quarter from quarter 1 of 2021 to quarter 4 of 2023.
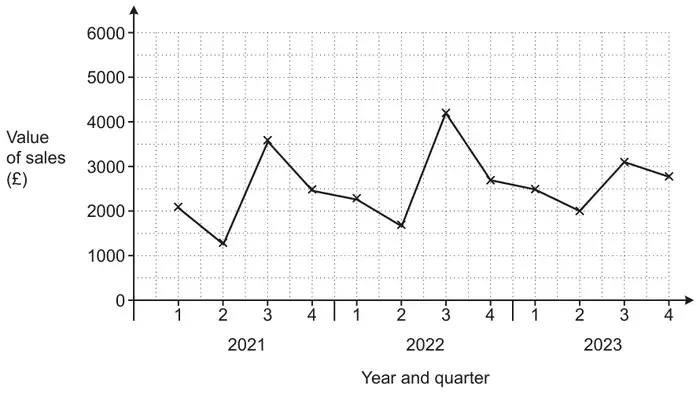
(a) Make one comment about the annual variation shown in this graph. [1]
(b) In one of these years, quarter 3 was very cloudy.
Write down which year this is most likely to be.
Give a reason for your answer. [1]
Write down which year this is most likely to be.
Give a reason for your answer. [1]
(c) The manager of the shop says that the value of sales in quarter 4 of 2024 will be £3100.
What assumption has the manager made? [1]
What assumption has the manager made? [1]
| Answer | Marks | Part marks and guidance | |
|---|---|---|---|
| Repeating pattern | 1 | Accept any correct pattern that repeats annually Accept reference to seasons for Qs e.g. Lower in q2 than q1 or Highest in q3 or Lowest in q2 etc or Sales in q1 or 2 or 4 rise each year Do not accept “Low sales in 2023” etc | |
| Answer | Marks | Part marks and guidance | |
|---|---|---|---|
| 2023 and [Q3 is] lower than in the other years oe | 1 | Accept summer or “it” etc for Q3 Condone [Year] 3 for [Year] 2023 Examples It didn’t increase as much as other years They had the least amount of sales. Sales rose but not as much as other years It is lower The sales are lower/est [in 2023] The graph shows less sales of products (BOD) | |
| Answer | Marks | Part marks and guidance | |
|---|---|---|---|
| The trend/pattern will continue oe | 1 | Do not accept references to the weather Do not accept “Sales stay the same” Accept e.g. Sales will increase The pattern stays the same | |