
Foundation November 2020 Paper 2 Q23
23 The time students spent watching TV was recorded.
The table shows the average daily time per student each year from 2012 to 2019
| Year | 2012 | 2013 | 2014 | 2015 | 2016 | 2017 | 2018 | 2019 |
|---|---|---|---|---|---|---|---|---|
| Time (minutes) | 157 | 148 | 138 | 124 | 113 | 100 | 90 | 82 |
A time series graph is drawn to represent the data.
The first four points have been plotted.
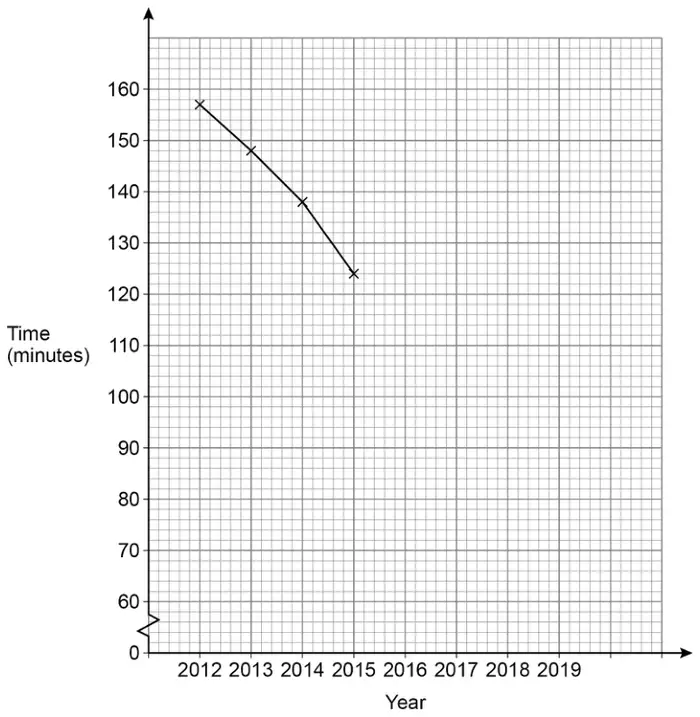
(a) Complete the graph. [2 marks]
(b) Use the graph to estimate the average daily time per student in 2020 [1 mark]
| Answer | Mark | Comments |
|---|---|---|
| Plots at least 3 points correctly | M1 | \(\pm\dfrac{1}{2}\) square |
| All four points correctly plotted and joined | A1 | \(\pm\dfrac{1}{2}\) square ignore working for part (b) |
Additional guidance
\(\pm\dfrac{1}{2}\) square means half a small square horizontally and vertically
If a point is within tolerance the line must be within \(\pm\dfrac{1}{2}\) square of their point
Mark intention for joining point to point
| Answer | Mark | Comments |
|---|---|---|
| [70, 78] | B1 |
Additional guidance
| Answer in range with or without working, with no graph or incorrect graph | B1 |
| 70.5 – 75 on answer line (both values in range) | B1 |