
Higher November 2023 Paper 5 Q4
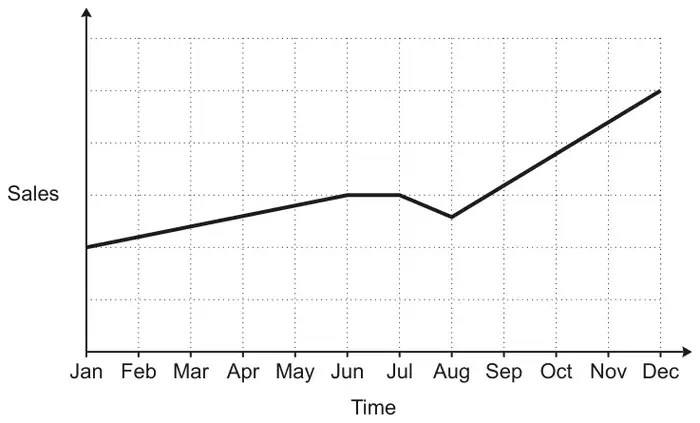
4 A sales representative and a manager discuss this graph of sales over the last year.
(a) The sales representative says
| I can tell from the graph that, over the last year, sales have risen every month. |
Is the sales representative correct?
Give a reason for your answer. [1]
(b) The manager says
| I can tell from the graph that sales are now more than double what they were at the start of the year. |
Is the manager correct?
Give a reason for your answer. [1]
| Answer | Marks | Part marks and guidance | |
|---|---|---|---|
| No with the graph is not rising month on month as they are flat in June and/or dip in July oe | 1 | Allow for comment on either the flat or dip in the graph e.g. sales fell between July and August Do not accept incorrect statements See Appendix 1 | |
Appendix 1: Q4(a)
Accept reasons that refer to being flat in one month [June or June to July or July] or dip in another month [July or July to August or August]. If the month is mentioned then it must be correct, accept any of the bracketed months
| Response | Mark | |
|---|---|---|
| 1 | No, the sales remained flat in July | 1 |
| 2 | No, the sales did not grow/stayed the same in June and July | 1 |
| 3 | No, the sales dipped in August | 1 |
| 4 | No, there was a decrease in July | 1 |
| 5 | No, there were two months where sales did not grow | 1 |
| 6 | No, sales went down from July to August | 1 |
| 7 | No, in July there is a dip in the graph | 1 |
| 8 | No, in June and July the sales were the same | 1 |
| 9 | Wrong, July the sales dropped | 1 |
| 10 | No, the sales increased then stopped and decreased then it increased. (Describes shape and does not refer to wrong months) | 1 |
| 11 | No, in August it drops down then goes back up | 1 |
| 12 | No from June to August the sales dropped (No as part of the statement is incorrect) | 0 |
| 13 | No, the sales went down at July and only started to rise again middle of August. (Incorrect statement) | 0 |
| Answer | Marks | Part marks and guidance | |
|---|---|---|---|
| No with no vertical scale numbering so cannot see if sales have doubled oe | 1 | Accept: No with no values/data/figures/numbers/%s shown [on sales axis] See Appendix 2 | |
Appendix 2: Q4(b)
| Response | Mark | |
|---|---|---|
| 1 | No, the scale may not start from 0. (Implies no figures on sales axis) | 1 |
| 2 | No, because on the graph no numbers we can’t know exactly. | 1 |
| 3 | No, on the graph it’s doesn’t show the % of sales to check if it double. | 1 |
| 4 | No, it doesn’t show what it is measured at. (Does not mention numbers/figures/values etc) | 0 |
| 5 | No, sales have tripled not doubled. There three times more sales. | 0 |
| 6 | No, slightly more than double. | 0 |
| 7 | No, at the end of the year it is only 3 more squares, it would have to be 4 to be double. | 0 |