
Foundation June 2024 Paper 3 Q19
19 The graph shows a household’s average daily electricity usage, in kilowatt hours (kWh).
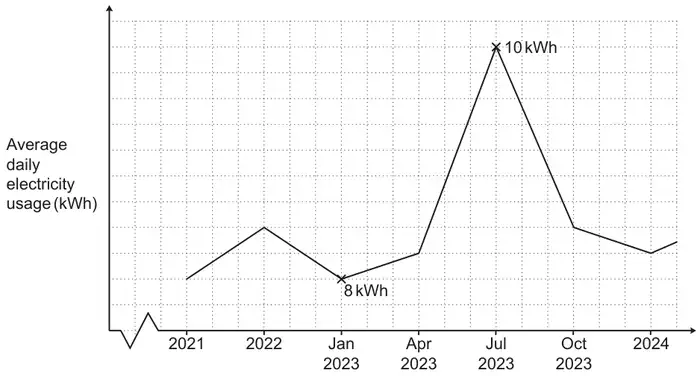
Give two different reasons why this graph is misleading. [2]
| Answer | Marks | Part marks and guidance | |
|---|---|---|---|
| Two from: • Horizontal scale uneven • No vertical scale • Vertical scale does not start at 0 | 2 | B1 for each | See Appendix Mark the best part of a statement if no contradiction If more than two reasons (often two in one statement), mark the worst two |
Appendix
Appendix Question 19
| Reason | Mark | Reason |
|---|---|---|
| It doesn’t have months for each year. Only a few for 2023 | 1 | |
| There are no numbers on the y axis | 1 | |
| As it doesn’t have all the numbers going up the side of electricity | 1 | |
| The dates keep skipping from years to months and back again | 1 | |
| It has months instead of years for 2023 | 1 | |
| Some years have months labelled | 1 | Implies others do not |
| The x axis dates are uneven distances apart | 1 | Condone x-axis |
| x-axis goes up by different amounts | 1 | BOD recognising uneven scale |
| The y-axis doesn’t have any data | 1 | BOD means not having any numbers |
| 2023 has four sections but the other years only have one | 1 | Recognises inconsistent scale |
| The y axis doesn’t start from 0 | 1 | Condone reference to y axis |
| 8 kWh is very far away from 10 kWh making it look like a big difference where in reality it isn’t | 1 | BOD implies “because vertical scale does not start at 0” |
| The scale of kWh has a large space between 8 and 10 | 1 | BOD implies “because vertical scale does not start at 0” |
| More results for 2023 | 1 | Correct because it shows the monthly figures |
| It misses out a couple of months | 0 | Could be referring to [Jan] Feb, Mar, [April] |
| The graphs is in months | 0 | Wrong as the graph also has years. Statement doesn’t recognise the uneven scale. |
| The axis doesn’t start from 0 | 0 | y axis not referenced |
| On the x axis, there’s a fluctuation/jagged line on the line | 0 | |
| Doesn’t show the numbers | 0 | Vertical axis not referenced |
| The y-axis isn’t labelled | 0 | It is labelled but does not have a scale |
| The graph is on a small scale/ It’s not drawn to scale | 0 | Do not accept reference to “drawn to scale” |