
Foundation November 2022 Paper 3 Q6
6 The graph shows information about the average monthly temperature, in °C, in Amman.
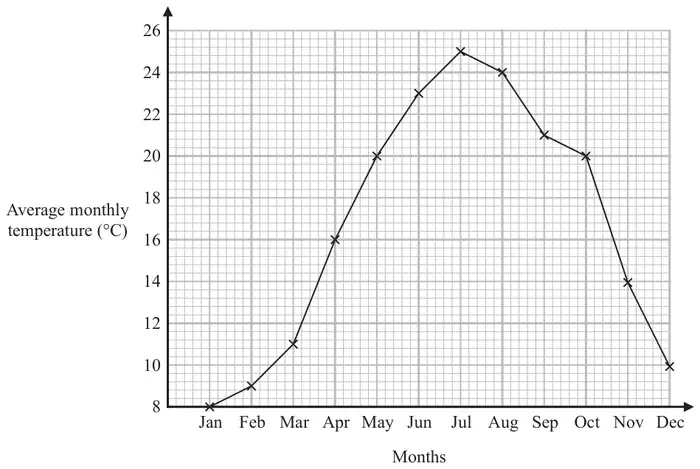
(a) For how many months was the average monthly temperature greater than 16°C? (1)
(b) Write down the two months that had the same average monthly temperature. (1)
| Answer | Mark | Mark scheme |
|---|---|---|
| 6 | B1 | cao |
| Answer | Mark | Mark scheme |
|---|---|---|
| May, October | B1 | cao |