
Higher June 2017 Paper 4 Q8
8 The table shows the average number of customers per day entering a shop.
| 2015 | 2016 | |||||||
|---|---|---|---|---|---|---|---|---|
| Months | Jan-Mar | Apr-Jun | July-Sep | Oct-Dec | Jan-Mar | Apr-Jun | July-Sep | Oct-Dec |
| Average number of customers per day | 119 | 264 | 368 | 172 | 130 | 304 | 381 | 192 |
(a) Complete the time series graph below. [2]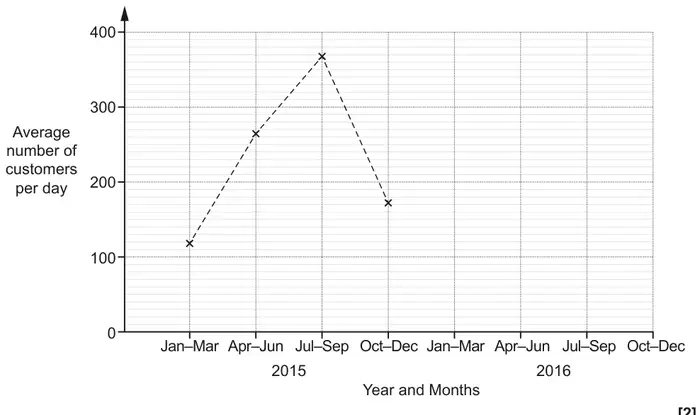
(b) Make two different comments comparing the number of customers entering the shop in 2015 and 2016. [2]
| Answer | Marks | Part marks and guidance | |
|---|---|---|---|
| 4 points accurately plotted | 2 | B1 for 2 or 3 points accurately plotted | condone missing or incorrect lines |
| Answer | Marks | Part marks and guidance | |
|---|---|---|---|
Here are 4 different categories ,
1 mark for each acceptable comment - for 2 marks they must come from different categories | 2 | B1 for 1 correct comment | If they make 3 comments mark the best 2. It is possible to cover 2 categories in one comment for 2 marks |