Correlation

More questions on this topic: A2 Statistics: Correlation & Regression (53)

Includes hypothesis testingFrom an AS paper

Edexcel

Edexcel · Old spec

AS June 2025 Q3

EdexcelAS paperCurrent spec14 marksIncludes hypothesis testingCorrelationLinear Regression

3. Dina is investigating the relationship between a marathon runner’s body mass index (BMI), \(x\,\mathrm{kg\,m^{-2}}\), and the runner’s average speed when running a marathon, \(v\,\mathrm{m\,s^{-1}}\)

She collects data from 20 marathon runners.

Some summary statistics are given below.

\[\bar{x} = 19.8 \qquad \bar{v} = 5.2 \qquad \sum xv = 2056.63 \qquad \mathrm{S}_{xx} = 15.78 \qquad \mathrm{S}_{vv} = 0.94\]
(a) Show that \(\mathrm{S}_{xv} = -2.57\) (1)
(b) Find the value of the product moment correlation coefficient between \(v\) and \(x\) (2)
(c) Use a suitable test, with a 5% level of significance, to assess whether or not there is evidence of a negative correlation between BMI and average speed.
State the hypotheses and the critical value used. (3)
(d) Find the equation of the regression line of \(v\) on \(x\) in the form \(v = a + bx\) giving the values of \(a\) and \(b\) to 2 decimal places. (3)
(e) Calculate the residual sum of squares (RSS). (2)

Information about 2 of the 20 marathon runners is listed in the table below.

RunnerBMIResidual
\(A\)20.90.18
\(B\)19.7–0.22
(f) Determine which of these runners took the shorter amount of time to run the marathon.
You must show your working. (3)

A2 June 2025 Q2

EdexcelCurrent spec7 marksIncludes hypothesis testingCorrelation

2. Two lecturers are marking a large batch of students’ essays, to place them in rank order.

A random sample of 9 students is taken and their essays are marked by both lecturers.

The marks awarded are given in the table below.

Student\(A\)\(B\)\(C\)\(D\)\(E\)\(F\)\(G\)\(H\)\(I\)
Lecturer 1101651712714118
Lecturer 2172219242115231820
(a) Calculate Spearman’s rank correlation coefficient for these data. (4)
(b) Carry out a suitable test to assess whether the lecturers agree about the rank order of the essays. You should use a 5% level of significance and state your hypotheses and critical value clearly. (3)

AS June 2025 Q1

EdexcelAS paperCurrent spec6 marksCorrelation

1. In a singing competition, two judges ranked the vocal quality of each of 8 singers.

The singers are labelled \(A\) to \(H\) and the table below shows the ranks given by each judge.

Rank12345678
Judge 1\(C\)\(B\)\(A\)\(G\)\(E\)\(F\)\(H\)\(D\)
Judge 2\(B\)\(A\)\(C\)\(G\)\(D\)\(E\)\(F\)\(H\)
(a) Calculate the Spearman’s rank correlation coefficient between the judges’ ranks. (4)

Each judge also gave a mark out of 20 for each singer’s vocal range.

Singer\(A\)\(B\)\(C\)\(D\)\(E\)\(F\)\(G\)\(H\)
Judge 118131612117136
Judge 21517141498128
(b) Without carrying out any further calculations, explain how the Spearman’s rank correlation coefficient between the judges’ marks for vocal range should be calculated. (2)

AS June 2024 Q5

EdexcelAS paperCurrent spec8 marksCorrelationLinear Regression

5. A random sample of 24 adults is taken. The height, \(h\) metres, and the arm span, \(s\) metres, for each adult are recorded.

These data are summarised below.

\[\mathrm{S}_{hh} = 0.377 \qquad \mathrm{S}_{sh} = 0.352 \qquad \bar{s} = 1.70 \qquad \bar{h} = 1.68\]

The least squares regression line of \(h\) on \(s\) is

\[h = a + 0.919s\]

where \(a\) is a constant.

(a) Calculate the product moment correlation coefficient. (3)

A doctor uses the least squares regression line of \(h\) on \(s\) as a model to predict a person’s height based on their arm span.

(b) Use the model to predict the height of an adult with arm span 1.79 metres. (2)

Ewan has an arm span of 1.70 metres and a height of 1.75 metres. His information is added to the sample as the 25th adult.

(c) Explain how the gradient of the regression line for the sample of 25 adults compares with the gradient of the regression line for the original sample of 24 adults.
Give a reason for your answer. (3)

A2 June 2024 Q2

EdexcelCurrent spec7 marksIncludes hypothesis testingCorrelation

2. An estate agent asks customers to rank 7 features of a house, \(A\), \(B\), \(C\), \(D\), \(E\), \(F\) and \(G\), in order of importance. The responses for two randomly selected customers are in the table below.

Rank1234567
Customer 1\(A\)\(E\)\(C\)\(F\)\(G\)\(B\)\(D\)
Customer 2\(E\)\(F\)\(C\)\(G\)\(A\)\(D\)\(B\)
(a) Calculate Spearman’s rank correlation coefficient for these data. (4)
(b) Stating your hypotheses and critical value clearly, test at the 5% level of significance, whether or not the two customers are generally in agreement. (3)

AS June 2024 Q2

EdexcelAS paperCurrent spec7 marksIncludes hypothesis testingCorrelation

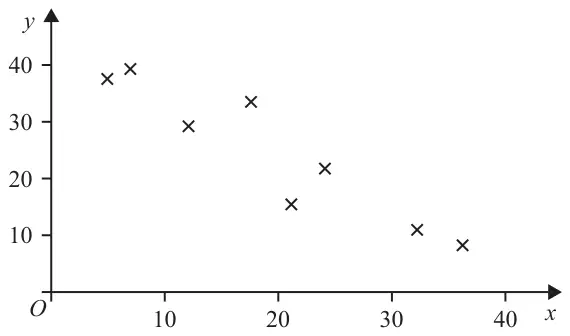
2. A random sample of size \(n = 8\) of paired data is taken from a population. The data are plotted below.

Scatter diagram of 8 points with x and y axes from 0 to 40, showing y generally decreasing as x increases

Test, at the 1% level of significance, whether or not there is evidence of a negative rank correlation between the two variables.

You should state your hypotheses and critical value and show your working clearly. (7)

AS June 2023 Q3

EdexcelAS paperCurrent spec10 marksCorrelationLinear Regression

3. Pat is investigating the relationship between the height of professional tennis players and the speed of their serve. Data from 9 randomly selected professional male tennis players were collected. The variables recorded were the height of each player, \(h\) metres, and the maximum speed of their serve, \(v\) km/h.

Pat summarised these data as follows

\[\sum h = 17.63 \qquad \sum v = 2174.9 \qquad \sum v^2 = 526\,407.8 \qquad S_{hh} = 0.0487 \qquad S_{hv} = 5.1376\]
(a) Calculate the product moment correlation coefficient between \(h\) and \(v\) (2)
(b) Explain whether the answer to part (a) is consistent with a linear model for these data. (1)
(c) Find the equation of the regression line of \(v\) on \(h\) in the form \(v = a + bh\)
where \(a\) and \(b\) are to be given to one decimal place. (3)

Pat calculated the sum of the residuals for the 9 tennis players as 1.04

(d) Without doing a calculation, explain how you know Pat has made a mistake. (1)

Pat made one mistake in the calculation. For the tennis player of height 1.96 m Pat misread the residual as 2.27

(e) Find the maximum speed of serve, in km/h, for the tennis player of height 1.96 m (3)

A2 June 2023 Q1

EdexcelCurrent spec7 marksCorrelationLinear Regression

1. Baako is investigating the times taken by children to run a 100 m race, \(x\) seconds, and a 500 m race, \(y\) seconds. For a sample of 20 children, Baako obtains the time taken by each child to run each race.

Here are Baako’s summary statistics.

\[\mathrm{S}_{xx} = 314.55 \qquad \mathrm{S}_{yy} = 9026 \qquad \mathrm{S}_{xy} = 1610\]\[\bar{x} = 19.65 \qquad \bar{y} = 108\]
(a) Calculate the product moment correlation coefficient between the times taken to run the 100 m race and the times taken to run the 500 m race. (2)
(b) Show that the equation of the regression line of \(y\) on \(x\) can be written as\[y = 5.12x + 7.42\]where the gradient and \(y\) intercept are given to 3 significant figures. (3)

The child who completed the 100 m race in 20 seconds took 104 seconds to complete the 500 m race.

(c) Find the residual for this child. (1)

The table below shows the signs of the residuals for the 20 children in order of finishing time for the 100 m race.

Sign of residual++++––+––––––––+++++
(d) Explain what the signs of the residuals show about the model’s predictions of the 500 m race times for the children who are fastest and slowest over the 100 m race. (1)

AS June 2023 Q1

EdexcelAS paperCurrent spec10 marksIncludes hypothesis testingCorrelation

1. Every applicant for a job at Donala is given three different tasks, \(P\), \(Q\) and \(R\).
For each task the applicant is awarded a score.
The scores awarded to 9 of the applicants, for the tasks \(P\) and \(Q\), are given below.

Applicant\(A\)\(B\)\(C\)\(D\)\(E\)\(F\)\(G\)\(H\)\(I\)
Task P1916161281712125
Task Q1711147618151110
(a) Calculate Spearman’s rank correlation coefficient for the scores awarded for the tasks \(P\) and \(Q\). (4)
(b) Test, at the 1% level of significance, whether or not there is evidence for a positive correlation between the ranks of scores for tasks \(P\) and \(Q\).
You should state your hypotheses and critical value clearly. (4)

The Spearman’s rank correlation coefficient for \(P\) and \(R\) is 0.290 and for \(Q\) and \(R\) is 0.795

The manager of Donala wishes to reduce the number of tasks given to job applicants from three to two.

(c) Giving a reason for your answer, state which 2 tasks you would recommend the manager uses. (2)

AS June 2022 Q3

EdexcelAS paperCurrent spec10 marksCorrelationLinear Regression

3. Gabriela is investigating a particular type of fish, called bream. She wants to create a model to predict the weight, \(w\) grams, of bream based on their length, \(x\) cm.

For a sample of 27 bream, some summary statistics are given below.

\[\bar{x} = 31.07 \qquad \bar{w} = 628.59 \qquad \sum w^2 = 11\,386\,134\]\[\mathrm{S}_{xw} = 13\,082.3 \qquad \mathrm{S}_{xx} = 260.8\]
(a) Find the value of the product moment correlation coefficient between \(x\) and \(w\) (3)
(b) Explain whether the answer to part (a) is consistent with a linear model for these data. (1)
(c) Find the equation of the regression line of \(w\) on \(x\) in the form \(w = a + bx\) (3)

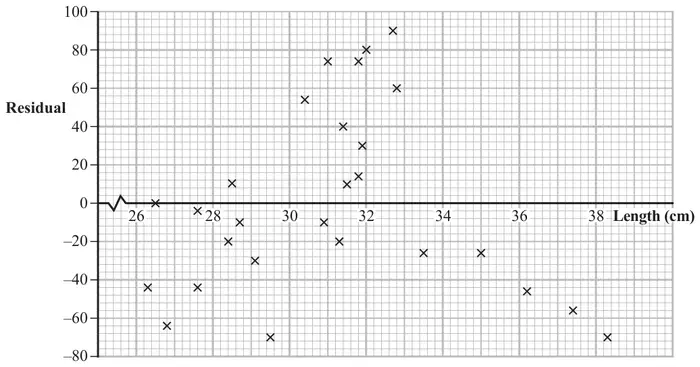
A residual plot for these data is shown below.

Residual plot: residual (from –80 to 100) against length (cm, from 26 to 38) for the 27 bream; the residual at length 32 cm is 80, and all five points with length above 33 cm have negative residuals

One of the bream in the sample has a length of 32 cm.

(d) Find its weight. (2)
(e) With reference to the residual plot, comment on the model for bream with lengths above 33 cm. (1)

A2 June 2022 Q1

EdexcelCurrent spec7 marksCorrelationLinear Regression

1. Kwame is investigating a possible relationship between average March temperature, \(t\,{}^\circ\mathrm{C}\), and tea yield, \(y\) kg/hectare, for tea grown in a particular location.
He uses 30 years of past data to produce the following summary statistics for a linear regression model, with tea yield as the dependent variable.

\[\text{Residual Sum of Squares (RSS)} = 1\,666\,567 \qquad \mathrm{S}_{tt} = 52.0 \qquad \mathrm{S}_{yy} = 1\,774\,155\]\[\text{least squares regression line:} \qquad \text{gradient} = 45.5 \qquad y\text{-intercept} = 2080\]
(a) Use the regression model to predict the tea yield for an average March temperature of \(20\,{}^\circ\mathrm{C}\) (1)

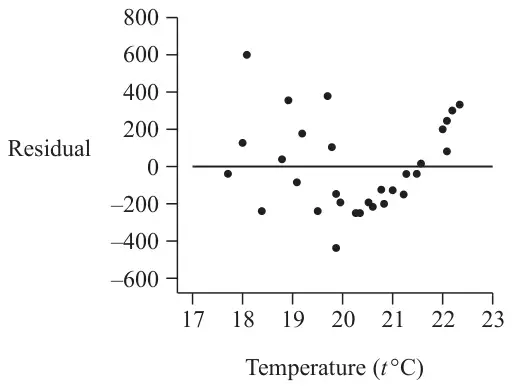
He also produces the following residual plot for the data.

Residual plot: residual (from –600 to 800) against temperature (t °C, from 17 to 23) for the 30 years; residuals are mostly negative between about 20 and 21.5 °C and all positive and rising above 21.5 °C
(b) Explain what you understand by the term residual. (1)
(c) Calculate the product moment correlation coefficient between \(t\) and \(y\) (2)
(d) Explain why the linear model may not be a good fit for the data
(i) with reference to your answer to part (c)
(ii) with reference to the residual plot.
(2)

Kwame also collects data on total March rainfall, \(w\) mm, for each of these 30 years.

For a linear regression model of \(w\) on \(t\) the following summary statistic is found.

\[\text{Residual Sum of Squares (RSS)} = 86\,754\]

Kwame concludes that since this model has a smaller RSS, there must be a stronger linear relationship between \(w\) and \(t\) than between \(y\) and \(t\) (where RSS = 1 666 567)

(e) State, giving a reason, whether or not you agree with the reasoning that led to Kwame’s conclusion. (1)

AS June 2022 Q1

EdexcelAS paperCurrent spec7 marksIncludes hypothesis testingCorrelation

1. Abena and Meghan are both given the same list of 10 films.

Each of them ranks the 10 films from most favourite to least favourite.

For the differences, \(d\), between their ranks for these 10 films, \(\sum d^2 = 84\)

(a) Calculate Spearman’s rank correlation coefficient between Abena’s ranks and Meghan’s ranks. (1)

A test is carried out at the 5% level of significance to see if there is agreement between their ranks for the films.

The hypotheses for the test are

\[\mathrm{H}_0 : \rho_\mathrm{S} = 0 \qquad \mathrm{H}_1 : \rho_\mathrm{S} \gt 0\]
(b)
(i) Find the critical region for the test.
(ii) State the conclusion of the test. (2)

An 11th film is added to the list. Abena and Meghan both agree that this film is their least favourite.

A new test is carried out at the 5% level of significance using the same hypotheses.

(c) Determine the conclusion of this test. You should state the test statistic and the critical value used. (4)

A2 October 2021 Q4

EdexcelCurrent spec10 marksCorrelationLinear Regression

4. A researcher is investigating the relationship between elevation, \(x\) metres, and annual mean temperature, \(t\,{}^\circ\mathrm{C}\).

From a random sample of 20 weather stations in Switzerland, the following results were obtained

\[\mathrm{S}_{xx} = 8\,820\,655 \qquad \mathrm{S}_{tt} = 444.7 \qquad \sum x = 28\,130 \qquad \sum t = 94.62\]

The product moment correlation coefficient for these data is found to be \(-0.959\)

(a) Interpret the value of this correlation coefficient. (1)
(b) Show that the equation of the regression line of \(t\) on \(x\) can be written as\[t = 14.3 - 0.00681x\] (4)

The random variable \(W\) represents the elevations of the weather stations in kilometres.

(c) Write down the equation of the regression line of \(t\) on \(w\) for these 20 weather stations in the form \(t = a + bw\) (1)
(d) Show that the residual sum of squares (RSS) for the model for \(t\) and \(x\) is 35.7 correct to one decimal place. (1)

One of the weather stations in the sample had a recorded elevation of 1100 metres and an annual mean temperature of \(1.4\,{}^\circ\mathrm{C}\)

(e)
(i) Calculate this weather station’s contribution to the residual sum of squares.
Give your answer as a percentage. (2)
(ii) Comment on the data for this weather station in light of your answer to part (e)(i). (1)

A2 October 2021 Q1

EdexcelCurrent spec7 marksIncludes hypothesis testingCorrelation

1. Anisa is investigating the relationship between marks on a History test and marks on a Geography test. She collects information from 7 students. She wants to calculate the Spearman’s rank correlation coefficient for the 7 students so she ranks their performance on each test.

StudentHistory markGeography markHistory rankGeography rank
\(A\)765813
\(B\)706022
\(C\)6457\(s\)\(t\)
\(D\)6463\(s\)1
\(E\)6457\(s\)\(t\)
\(F\)595067
\(G\)555276
(a) Write down the value of \(s\) and the value of \(t\) (2)

The full product moment correlation coefficient (pmcc) formula is used with the ranks to calculate the Spearman’s rank correlation coefficient instead of \(r_s = 1 - \dfrac{6\Sigma d^2}{n(n^2 - 1)}\) and the value obtained is 0.7106 to 4 significant figures.

(b) Explain why the full pmcc formula is used to carry out the calculation. (1)
(c) Stating your hypotheses clearly, test whether or not there is evidence to suggest that the higher a student ranks in the History test, the higher the student ranks in the Geography test. Use a 5% level of significance. (4)

AS October 2020 Q2

EdexcelAS paperCurrent spec9 marksCorrelation

2. Mary, Jahil and Dawn are judging the cakes in a village show. They have 5 features to consider and each feature is awarded up to 5 points. The total score the judges gave each cake are given in the table below.

Cake\(A\)\(B\)\(C\)\(D\)\(E\)\(F\)\(G\)\(H\)\(I\)
Mary19172310211512814
Jahil221821102420161215
Dawn911618915132013
(a) Calculate Spearman’s rank correlation coefficient between Mary’s scores and Jahil’s scores. (4)
(b) Calculate Spearman’s rank correlation coefficient between Jahil’s scores and Dawn’s scores. (3)

The judges discussed their interpretation of the points system and agreed that the first prize should go to cake \(C\).

(c) Explain how different interpretations of the points system could give rise to the results in part (a) and part (b). (2)

AS October 2020 Q1

EdexcelAS paperCurrent spec3 marksIncludes hypothesis testingCorrelation

1. An estate agent in Tornep believes that houses further from the railway station are more expensive than those that are closer. She took a random sample of 22 three-bedroom houses in Tornep and calculated the product moment correlation coefficient between the house price and the distance from the station to be 0.3892

Stating your hypotheses clearly, use a 5% level of significance to test the estate agent’s belief. State the critical region used in your test. (3)

A2 June 2019 Q8

EdexcelCurrent spec11 marksIncludes hypothesis testingCorrelation

8. Nine athletes, \(A\), \(B\), \(C\), \(D\), \(E\), \(F\), \(G\), \(H\) and \(I\), competed in both the 100 m sprint and the long jump. After the two events the positions of each athlete were recorded and Spearman’s rank correlation coefficient was calculated and found to be 0.85

(a) Stating your hypotheses clearly, test whether or not there is evidence to suggest that the higher an athlete’s position is in the 100 m sprint, the higher their position is in the long jump. Use a 5% level of significance. (4)

The piece of paper the positions were recorded on was mislaid. Although some of the athletes agreed their positions, there was some disagreement between athletes \(B\), \(C\) and \(D\) over their long jump results.

The table shows the results that are agreed to be correct.

Athlete\(A\)\(B\)\(C\)\(D\)\(E\)\(F\)\(G\)\(H\)\(I\)
Position in 100 m sprint467928315
Position in long jump549312

Given that there were no tied ranks,

(b) find the correct positions of athletes \(B\), \(C\) and \(D\) in the long jump. You must show your working clearly and give reasons for your answers. (5)
(c) Without recalculating the coefficient, explain how Spearman’s rank correlation coefficient would change if athlete \(H\) was disqualified from both the 100 m sprint and the long jump. (2)

AS June 2019 Q3

EdexcelAS paperCurrent spec11 marksCorrelationLinear Regression

3. Two students, Jim and Dora, collected data on the mean annual rainfall, \(w\) cm, and the annual yield of leeks, \(l\) tonnes per hectare, for 10 years.

Jim summarised the data as follows

\[\mathrm{S}_{wl} = 42.786 \qquad \mathrm{S}_{ww} = 9936.9 \qquad \sum l^2 = 26.2326 \qquad \sum l = 16.06\]
(a) Find the product moment correlation coefficient between \(l\) and \(w\) (2)

Dora decided to code the data first using \(s = w - 6\) and \(t = l - 20\)

(b) Write down the value of the product moment correlation coefficient between \(s\) and \(t\).
Give a justification for your answer. (1)

Dora calculates the equation of the regression line of \(t\) on \(s\) to be \(t = 0.00431s - 18.87\)

(c) Find the equation of the regression line of \(l\) on \(w\) in the form \(l = a + bw\), giving the values of \(a\) and \(b\) to 3 significant figures. (3)
(d) Use your equation to estimate the yield of leeks when \(w\) is 100 cm. (1)
(e) Calculate the residual sum of squares. (2)

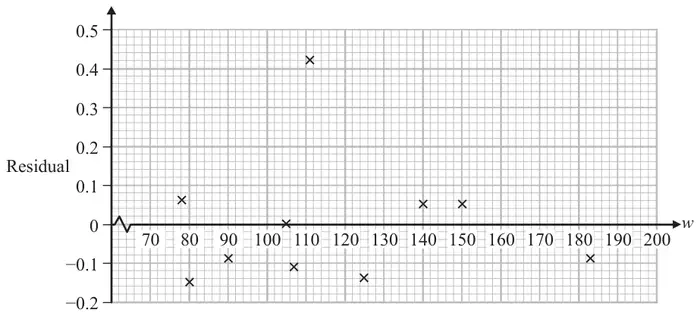
The graph shows the residual for each value of \(l\)

Residual plot: residual (from –0.2 to 0.5) against w (from 70 to 200) for 10 points; one residual of about 0.42 at w = 111, the others between about –0.15 and 0.06
(f)
(i) State whether this graph suggests that the use of a linear regression model is suitable for these data. Give a reason for your answer.
(ii) Other than collecting more data, suggest how to improve the fit of the model in part (c) to the data.
(2)

A2 June 2019 Q2

EdexcelCurrent spec10 marksCorrelationLinear Regression

2. A large field of wheat is split into 8 plots of equal area. Each plot is treated with a different amount of fertiliser, \(f\) grams/m2. The yield of wheat, \(w\) tonnes, from each plot is recorded. The results are summarised below.

\[\sum f = 28 \qquad \sum w = 303 \qquad \sum w^2 = 13\,447 \qquad \mathrm{S}_{ff} = 42 \qquad \mathrm{S}_{fw} = 269.5\]
(a) Calculate the product moment correlation coefficient between \(f\) and \(w\) (2)
(b) Interpret the value of your product moment correlation coefficient. (1)
(c) Find the equation of the regression line of \(w\) on \(f\) in the form \(w = a + bf\) (3)
(d) Using your equation, estimate the decrease in yield when the amount of fertiliser decreases by 0.5 grams/m2 (1)

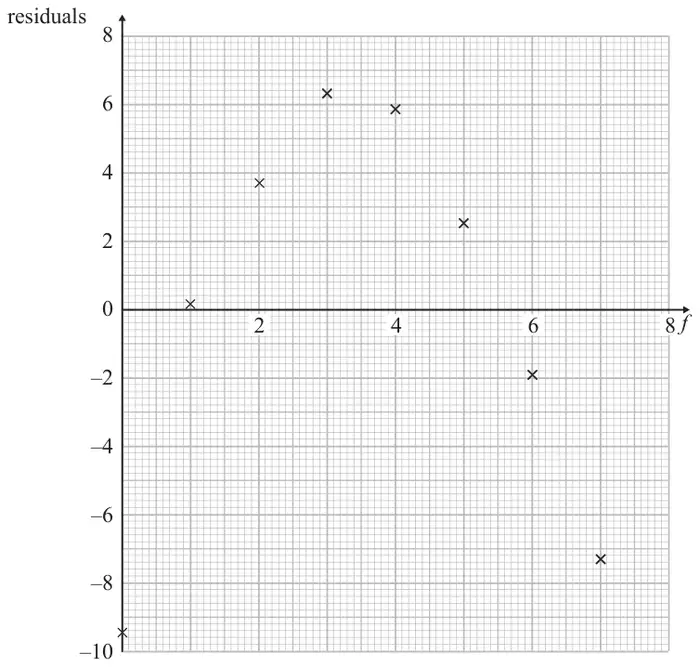
The residuals of the data recorded are calculated and plotted on the graph below.

Graph of residuals (from –10 to 8) against f (from 0 to 8) on a grid: approximately (0, –9.4), (1, 0.2), (2, 3.7), (3, 6.3), (4, 5.9), (5, 2.5), (6, –1.9), (7, –7.3)
(e) With reference to this graph, comment on the suitability of the model you found in part (c). (2)
(f) Suggest how you might be able to refine your model. (1)

AS June 2019 Q1

EdexcelAS paperCurrent spec10 marksIncludes hypothesis testingCorrelation

1. Bara is investigating whether or not the two judges of a skating competition are in agreement. The two judges gave a score to each of the 8 skaters in the competition as shown in the table below.

Skater
\(A\)\(B\)\(C\)\(D\)\(E\)\(F\)\(G\)\(H\)
Judge 17170726263615753
Judge 27371676462565253

Bara decided to calculate Spearman’s rank correlation coefficient for these data.

(a) Calculate Spearman’s rank correlation coefficient between the ranks of the two judges. (4)
(b) Test, at the 1% level of significance, whether or not the two judges are in agreement. (4)

Judge 1 accidentally swapped the scores for skaters \(D\) and \(E\). The score for skater \(D\) should be 63 and the score for skater \(E\) should be 62

(c) Without carrying out any further calculations, explain how Spearman’s rank correlation coefficient will change. Give a reason for your answer. (2)

AS June 2018 Q3

EdexcelAS paperCurrent spec12 marksIncludes hypothesis testingCorrelation

3. The table below shows the heights cleared, in metres, for each of 6 competitors in a high jump competition.

CompetitorABCDEF
Height (m)2.051.932.021.961.812.02

These 6 competitors also took part in a long jump competition and finished in the following order, with C jumping the furthest.

\[\mathrm{C} \qquad \mathrm{A} \qquad \mathrm{F} \qquad \mathrm{D} \qquad \mathrm{B} \qquad \mathrm{E}\]
(a) Calculate Spearman’s rank correlation coefficient for these data. (4)
(b) Stating your hypotheses clearly, test at the 5% level of significance whether or not there is a positive correlation between results in the high jump and results in the long jump. (4)

The product moment correlation coefficient between the height of the high jump and the length of the long jump for each competitor is found to be 0.678

(c) Use this value to test, at the 5% level of significance, for evidence of positive correlation between results in the high jump and results in the long jump. (2)
(d) State the condition required for the test in part (c) to be valid. (1)
(e) Explain what your conclusions in part (b) and part (c) suggest about the relationship between results in the high jump and results in the long jump. (1)

AS June 2018 Q1

EdexcelAS paperCurrent spec11 marksCorrelationLinear Regression

1. The scores achieved on a maths test, \(m\), and the scores achieved on a physics test, \(p\), by 16 students are summarised below.

\[\sum m = 392 \qquad \sum p = 254 \qquad \sum p^2 = 4748 \qquad \mathrm{S}_{mm} = 1846 \qquad \mathrm{S}_{mp} = 1115\]
(a) Find the product moment correlation coefficient between \(m\) and \(p\) (2)
(b) Find the equation of the linear regression line of \(p\) on \(m\) (3)

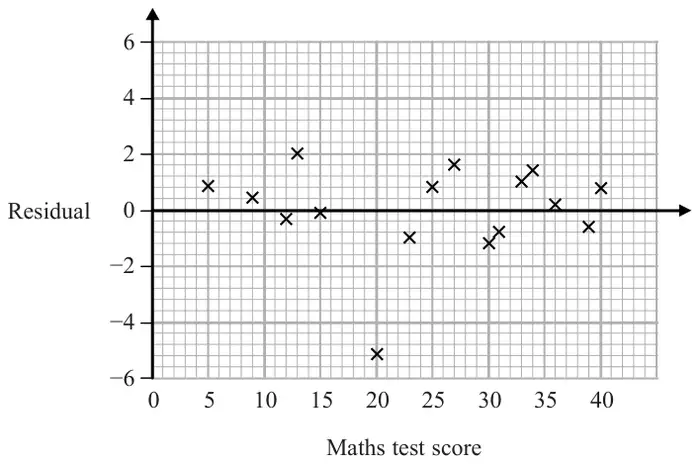
Figure 1 shows a plot of the residuals.

Figure 1: residual (from –6 to 6) against maths test score (from 0 to 40) for 16 students; the point at maths score 20 has residual about –5.1, the others lie between about –1.2 and 2
Figure 1
(c) Calculate the residual sum of squares (RSS). (2)

For the person who scored 30 marks on the maths test,

(d) find the score on the physics test. (2)

The data for the person who scored 20 on the maths test is removed from the data set.

(e) Suggest a reason why. (1)

The product moment correlation coefficient between \(m\) and \(p\) is now recalculated for the remaining 15 students.

(f) Without carrying out any further calculations, suggest how you would expect this recalculated value to compare with your answer to part (a).
Give a reason for your answer. (1)

S3 June 2018 Q1

EdexcelOld spec13 marksIncludes hypothesis testingCorrelation

1. Phil measures the concentration of a radioactive element, \(c\), and the amount of dissolved solids, \(a\), of 8 random samples of groundwater. His results are shown in the table below.

Sample\(A\)\(B\)\(C\)\(D\)\(E\)\(F\)\(G\)\(H\)
\(c\)625700650645720600825665
\(a\)1.281.301.001.201.551.151.401.45

Given that

\[\mathrm{S}_{cc} = 34\,787.5 \qquad \mathrm{S}_{aa} = 0.217\,287\,5 \qquad \mathrm{S}_{ca} = 47.7625\]
(a) calculate, to 3 decimal places, the product moment correlation coefficient between the concentration of the radioactive element and the amount of dissolved solids for these groundwater samples. (1)
(b) Use your value of the product moment correlation coefficient to test whether or not there is evidence of a positive correlation between the concentration of this radioactive element and the amount of dissolved solids in groundwater. Use a 5% significance level. State your hypotheses clearly. (3)
(c) Calculate, to 3 decimal places, Spearman’s rank correlation coefficient between the concentration of the radioactive element and the amount of dissolved solids. (5)
(d) Use your value of Spearman’s rank correlation coefficient to test for evidence of a positive correlation between the concentration of the radioactive element and the amount of dissolved solids. Use a 5% significance level. State your hypotheses clearly. (3)
(e) Using your conclusions in part (b) and part (d), comment on the possible relationship between these variables. (1)

S3 June 2017 Q3

EdexcelOld spec10 marksIncludes hypothesis testingCorrelation

3. A junior judge is being trained by a senior judge to learn how to assess ice skaters. After the training, the judges each assess 6 ice skaters \(A\), \(B\), \(C\), \(D\), \(E\) and \(F\). They each list them in order of preference with the best ice skater first. The results are shown in the table below.

Rank123456
Senior Judge\(A\)\(B\)\(D\)\(C\)\(F\)\(E\)
Junior Judge\(B\)\(D\)\(A\)\(F\)\(C\)\(E\)
(a) Calculate Spearman’s rank correlation coefficient for these data. (5)
(b) Test, at the 5% level of significance, whether or not there is evidence of a positive correlation between the rankings of the junior judge and the senior judge. State your hypotheses clearly. (4)
(c) Comment on the effectiveness of the training delivered by the senior judge. (1)

S3 June 2016 Q3

EdexcelOld spec11 marksIncludes hypothesis testingCorrelation

3.

(a) Describe when you would use Spearman’s rank correlation coefficient rather than the product moment correlation coefficient to measure the strength of the relationship between two variables. (1)

A shop sells sunglasses and ice cream. For one week in the summer the shopkeeper ranked the daily sales of ice cream and sunglasses. The ranks are shown in the table below.

SunMonTuesWedsThursFriSat
Ice cream6475321
Sunglasses6572341
(b) Calculate Spearman’s rank correlation coefficient for these data. (3)
(c) Test, at the 5% level of significance, whether or not there is a positive correlation between sales of ice cream and sales of sunglasses. State your hypotheses clearly. (4)

The shopkeeper calculates the product moment correlation coefficient from his raw data and finds \(r = 0.65\)

(d) Using this new coefficient, test, at the 5% level of significance, whether or not there is a positive correlation between sales of ice cream and sales of sunglasses. (2)
(e) Using your answers to part (c) and part (d), comment on the nature of the relationship between sales of sunglasses and sales of ice cream. (1)

S3 June 2015 Q1

EdexcelOld spec9 marksIncludes hypothesis testingCorrelation

1. A mobile library has 160 books for children on its records. The librarian believes that books with fewer pages are borrowed more often. He takes a random sample of 10 books for children.

(a) Explain how the librarian should select this random sample. (2)

The librarian ranked the 10 books according to how often they had been borrowed, with 1 for the book borrowed the most and 10 for the book borrowed the least. He also recorded the number of pages in each book. The results are in the table below.

Book\(A\)\(B\)\(C\)\(D\)\(E\)\(F\)\(G\)\(H\)\(I\)\(J\)
Borrowing rank12345678910
Number of pages502121158030190356283152317
(b) Calculate Spearman’s rank correlation coefficient for these data. (4)
(c) Test the librarian’s belief using a 5% level of significance. State your hypotheses clearly. (3)

S3 June 2014 (R) Q1

EdexcelOld spec11 marksIncludes hypothesis testingCorrelation

1. A journalist is investigating factors which influence people when they buy a new car. One possible factor is fuel efficiency. The journalist randomly selects 8 car models. Each model’s annual sales and fuel efficiency, in km/litre, are shown in the table below.

Car model\(A\)\(B\)\(C\)\(D\)\(E\)\(F\)\(G\)\(H\)
Annual sales1800540018 10071009300480012 20010 700
Fuel efficiency5.218.614.813.218.311.916.517.7
(a) Calculate Spearman’s rank correlation coefficient for these data. (5)

The journalist believes that car models with higher fuel efficiency will achieve higher sales.

(b) Stating your hypotheses clearly, test whether or not the data support the journalist’s belief. Use a 5% level of significance. (4)
(c) State the assumption necessary for a product moment correlation coefficient to be valid in this case. (1)
(d) The mean and median fuel efficiencies of the car models in the random sample are 14.5 km/litre and 15.65 km/litre respectively. Considering these statistics, as well as the distribution of the fuel efficiency data, state whether or not the data suggest that the assumption in part (c) might be true in this case. Give a reason for your answer.
(No further calculations are required.) (1)

S3 June 2014 Q8

EdexcelOld spec16 marksIncludes hypothesis testingCorrelation

8. The heights, in metres, and weights, in kilograms, of a random sample of 9 men are shown in the table below

Man\(A\)\(B\)\(C\)\(D\)\(E\)\(F\)\(G\)\(H\)\(I\)
Height (\(x\))1.681.741.751.761.781.821.841.881.98
Weight (\(y\))757610077909511096120
(a) Given that \(\mathrm{S}_{xx} = 0.0632\), \(\mathrm{S}_{yy} = 1957.5556\) and \(\mathrm{S}_{xy} = 9.3433\) calculate, to 3 decimal places, the product moment correlation coefficient between height and weight for these men. (2)
(b) Use your value of the product moment correlation coefficient to test whether or not there is evidence of a positive correlation between the height and weight of men. Use a 5% significance level. State your hypotheses clearly. (4)

Peter does not know the heights or weights of the 9 men. He is given photographs of them and asked to put them in order of increasing weight. He puts them in the order

\[A \quad C \quad E \quad B \quad G \quad D \quad I \quad F \quad H\]
(c) Find, to 3 decimal places, Spearman’s rank correlation coefficient between Peter’s order and the actual order. (6)
(d) Use your value of Spearman’s rank correlation coefficient to test for evidence of Peter’s ability to correctly order men, by their weight, from their photographs. Use a 5% significance level and state your hypotheses clearly. (4)

S3 June 2013 (R) Q3

EdexcelOld spec13 marksIncludes hypothesis testingCorrelation

3. The table below shows the population and the number of council employees for different towns and villages.

Town or villagePopulationNumber of council employees
\(A\)21110
\(B\)3562
\(C\)104712
\(D\)246321
\(E\)489216
\(F\)647925
\(G\)657167
\(H\)657345
\(I\)984548
\(J\)14 78434
(a) Find, to 3 decimal places, Spearman’s rank correlation coefficient between the population and the number of council employees. (5)
(b) Use your value of Spearman’s rank correlation coefficient to test for evidence of a positive correlation between the population and the number of council employees. Use a 2.5% significance level. State your hypotheses clearly. (4)

It is suggested that a product moment correlation coefficient would be a more suitable calculation in this case. The product moment correlation coefficient for these data is 0.627 to 3 decimal places.

(c) Use the value of the product moment correlation coefficient to test for evidence of a positive correlation between the population and the number of council employees. Use a 2.5% significance level. (2)
(d) Interpret and comment on your results from part (b) and part (c). (2)

S3 June 2013 Q2

EdexcelOld spec8 marksIncludes hypothesis testingCorrelation

2. The table below shows the number of students per member of staff and the student satisfaction scores for 7 universities.

University\(A\)\(B\)\(C\)\(D\)\(E\)\(F\)\(G\)
Number of students per member of staff14.213.113.311.710.515.910.8
Student satisfaction score4.14.23.84.03.94.33.7
(a) Calculate Spearman’s rank correlation coefficient for these data. (5)
(b) Stating your hypotheses clearly test, at the 5% level of significance, whether or not there is evidence of a correlation between the number of students per member of staff and the student satisfaction score. (3)

S3 June 2012 Q1

EdexcelOld spec12 marksIncludes hypothesis testingCorrelation

1. Interviews for a job are carried out by two managers. Candidates are given a score by each manager and the results for a random sample of 8 candidates are shown in the table below.

Candidate\(A\)\(B\)\(C\)\(D\)\(E\)\(F\)\(G\)\(H\)
Manager \(X\)6256875465151210
Manager \(Y\)5447715049253044
(a) Calculate Spearman’s rank correlation coefficient for these data. (5)
(b) Test, at the 5% level of significance, whether there is agreement between the rankings awarded by each manager. State your hypotheses clearly. (5)

Manager \(Y\) later discovered he had miscopied his score for candidate \(D\) and it should be 54.

(c) Without carrying out any further calculations, explain how you would calculate Spearman’s rank correlation in this case. (2)

S3 June 2011 Q2

EdexcelOld spec10 marksIncludes hypothesis testingCorrelation

2. A county councillor is investigating the level of hardship, \(h\), of a town and the number of calls per 100 people to the emergency services, \(c\). He collects data for 7 randomly selected towns in the county. The results are shown in the table below.

Town\(A\)\(B\)\(C\)\(D\)\(E\)\(F\)\(G\)
\(h\)14201618371924
\(c\)52454342618255
(a) Calculate the Spearman’s rank correlation coefficient between \(h\) and \(c\). (6)

After collecting the data, the councillor thinks there is no correlation between hardship and the number of calls to the emergency services.

(b) Test, at the 5% level of significance, the councillor’s claim. State your hypotheses clearly. (4)

S3 June 2010 Q4

EdexcelOld spec10 marksIncludes hypothesis testingCorrelation

4. A researcher claims that, at a river bend, the water gradually gets deeper as the distance from the inner bank increases. He measures the distance from the inner bank, \(b\) cm, and the depth of a river, \(s\) cm, at seven positions. The results are shown in the table below.

Position\(A\)\(B\)\(C\)\(D\)\(E\)\(F\)\(G\)
Distance from inner bank \(b\) cm100200300400500600700
Depth \(s\) cm60758576110120104
(a) Calculate Spearman’s rank correlation coefficient between \(b\) and \(s\). (6)
(b) Stating your hypotheses clearly, test whether or not the data provides support for the researcher’s claim. Use a 1% level of significance. (4)

S3 June 2009 Q3

EdexcelOld spec11 marksIncludes hypothesis testingCorrelation

3. A doctor is interested in the relationship between a person’s Body Mass Index (BMI) and their level of fitness. She believes that a lower BMI leads to a greater level of fitness. She randomly selects 10 female 18 year-olds and calculates each individual’s BMI. The females then run a race and the doctor records their finishing positions. The results are shown in the table.

Individual\(A\)\(B\)\(C\)\(D\)\(E\)\(F\)\(G\)\(H\)\(I\)\(J\)
BMI17.421.418.924.419.420.122.618.425.828.1
Finishing position35196410278
(a) Calculate Spearman’s rank correlation coefficient for these data. (5)
(b) Stating your hypotheses clearly and using a one tailed test with a 5% level of significance, interpret your rank correlation coefficient. (5)
(c) Give a reason to support the use of the rank correlation coefficient rather than the product moment correlation coefficient with these data. (1)

S3 June 2008 Q3

EdexcelOld spec14 marksIncludes hypothesis testingCorrelation

3. The product moment correlation coefficient is denoted by \(r\) and Spearman’s rank correlation coefficient is denoted by \(r_s\).

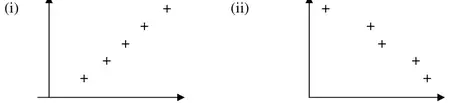
(a) Sketch separate scatter diagrams, with five points on each diagram, to show
(i) \(r = 1\),
(ii) \(r_s = -1\) but \(r \gt -1\). (3)

Two judges rank seven collie dogs in a competition. The collie dogs are labelled \(A\) to \(G\) and the rankings are as follows

Rank1234567
Judge 1\(A\)\(C\)\(D\)\(B\)\(E\)\(F\)\(G\)
Judge 2\(A\)\(B\)\(D\)\(C\)\(E\)\(G\)\(F\)
(b)
(i) Calculate Spearman’s rank correlation coefficient for these data. (6)
(ii) Stating your hypotheses clearly, test, at the 5% level of significance, whether or not the judges are generally in agreement. (5)

S3 June 2007 Q1

EdexcelOld spec10 marksIncludes hypothesis testingCorrelation

1. During a village show, two judges, \(P\) and \(Q\), had to award a mark out of 30 to some flower displays. The marks they awarded to a random sample of 8 displays were as follows:

Display\(A\)\(B\)\(C\)\(D\)\(E\)\(F\)\(G\)\(H\)
Judge \(P\)2519212328171620
Judge \(Q\)209211317141115
(a) Calculate Spearman’s rank correlation coefficient for the marks awarded by the two judges. (6)

After the show, one competitor complained about the judges. She claimed that there was no positive correlation between their marks.

(b) Stating your hypotheses clearly, test whether or not this sample provides support for the competitor’s claim. Use a 5% level of significance. (4)

S3 June 2006 Q4

EdexcelOld spec9 marksIncludes hypothesis testingCorrelation

4. The table below shows the price of an ice cream and the distance of the shop where it was purchased from a particular tourist attraction.

ShopDistance from tourist attraction (m)Price (£)
\(A\)501.75
\(B\)1751.20
\(C\)2702.00
\(D\)3751.05
\(E\)4250.95
\(F\)5801.25
\(G\)7100.80
\(H\)7900.75
\(I\)8901.00
\(J\)9800.85
(a) Find, to 3 decimal places, the Spearman rank correlation coefficient between the distance of the shop from the tourist attraction and the price of an ice cream. (5)
(b) Stating your hypotheses clearly and using a 5% one-tailed test, interpret your rank correlation coefficient. (4)

S3 January 2006 Q7

EdexcelOld spec12 marksIncludes hypothesis testingCorrelation

7. The numbers of deaths from pneumoconiosis and lung cancer in a developing country are given in the table.

Age group (years)20–2930–3940–4950–5960–6970 and over
Deaths from pneumoconiosis (1000s)12.55.918.519.431.231.0
Deaths from lung cancer (1000s)3.79.010.219.013.018.0

The correlation between the number of deaths in the different age groups for each disease is to be investigated.

(a) Give one reason why Spearman’s rank correlation coefficient should be used. (1)
(b) Calculate Spearman’s rank correlation coefficient for these data. (6)
(c) Use a suitable test, at the 5% significance level, to interpret your result. State your hypotheses clearly. (5)

S3 June 2005 Q4

EdexcelOld spec13 marksIncludes hypothesis testingCorrelation

4. Over a period of time, researchers took 10 blood samples from one patient with a blood disease. For each sample, they measured the levels of serum magnesium, \(s\) mg/dl, in the blood and the corresponding level of the disease protein, \(d\) mg/dl. The results are shown in the table.

\(s\)1.21.93.23.92.54.55.74.01.15.9
\(d\)3.87.011.012.09.012.013.512.22.013.9

[Use \(\sum s^2 = 141.51\), \(\sum d^2 = 1081.74\) and \(\sum sd = 386.32\)]

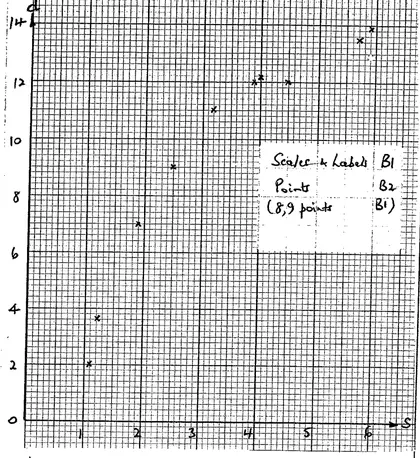
(a) Draw a scatter diagram to represent these data. (3)
(b) State what is measured by the product moment correlation coefficient. (1)
(c) Calculate \(S_{xx}\), \(S_{dd}\) and \(S_{sd}\). (3)
(d) Calculate the value of the product moment correlation coefficient \(r\) between \(s\) and \(d\). (2)
(e) Stating your hypotheses clearly, test, at the 1% significance level, whether or not the correlation coefficient is greater than zero. (3)
(f) With reference to your scatter diagram, comment on your result in part (e). (1)