
A2 June 2022 Q1
1. Kwame is investigating a possible relationship between average March temperature, \(t\,{}^\circ\mathrm{C}\), and tea yield, \(y\) kg/hectare, for tea grown in a particular location.
He uses 30 years of past data to produce the following summary statistics for a linear regression model, with tea yield as the dependent variable.
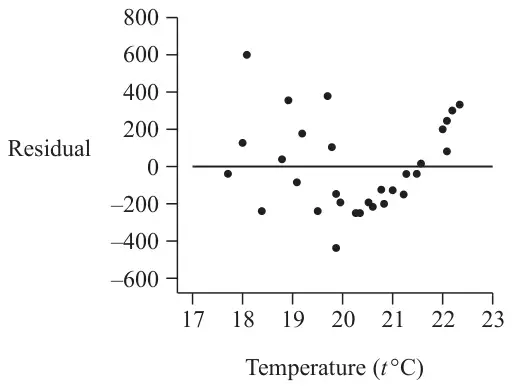
He also produces the following residual plot for the data.
Kwame also collects data on total March rainfall, \(w\) mm, for each of these 30 years.
For a linear regression model of \(w\) on \(t\) the following summary statistic is found.
\[\text{Residual Sum of Squares (RSS)} = 86\,754\]Kwame concludes that since this model has a smaller RSS, there must be a stronger linear relationship between \(w\) and \(t\) than between \(y\) and \(t\) (where RSS = 1 666 567)
| Scheme | Marks | AO |
|---|---|---|
| \([20 \times 45.5 + 2080] = 2990\) [kg/ha] | B1 | 3.4 |
| (1) |
Notes
B1: cao
| Scheme | Marks | AO |
|---|---|---|
| (A residual is the) difference between the observed value (oe) and the predicted value (oe) (of the dependent variable) | B1 | 1.2 |
| (1) |
Notes
B1: Correct definition. Allow equivalent wording.
Distance from regression line on its own is B0, but allow if vertical distance or \(y\) is referenced
| Scheme | Marks | AO |
|---|---|---|
| \(1666567 = 1774155(1 - r^2)\) | M1 | 1.1b |
| \(r = 0.246\ldots\) awrt 0.246 | A1 | 1.1b |
| (2) |
Notes
M1: Use of correct expression for \(r\) or \(r^2\)
Allow use of \(\mathrm{S}_{ty} = 45.5 \times 52.0\ [=2366]\)
or RSS: \(1774155 - \dfrac{(\mathrm{S}_{ty})^2}{52} = 1666567 \rightarrow [\mathrm{S}_{ty} = 2365.2\ldots]\)
and then \(r = \dfrac{\text{awrt 2365 or awrt 2366}}{\sqrt{52.0 \times 1774155}}\)
A1: awrt 0.246 (\(-0.246\) or \(\pm 0.246\) scores M1A0)
| Scheme | Marks | AO |
|---|---|---|
| (i) Since \(r\) is close to 0/weak correlation | B1 | 2.4 |
| (ii) e.g. (For \(t \gt 20\ldots\)) the residuals do not appear randomly scattered about 0. | B1 | 3.5a |
| (2) |
Notes
(i) B1: Correct explanation
(ii) B1: Correct evaluation of the fit of the model’s residuals (e.g. variance either side of \(t = 20\) does not appear to be the same)
‘residuals not randomly scattered’ on its own is B0.
| Scheme | Marks | AO |
|---|---|---|
| Kwame’s conclusion cannot be supported using RSS since the two values of RSS do not have the same units. | B1 | 2.3 |
| (1) | ||
| (7 marks) |
Notes
B1: Correct assessment of the conclusion involving the units/size of the variables used to calculate the RSS