
AS June 2024 Q2
2. A random sample of size \(n = 8\) of paired data is taken from a population. The data are plotted below.
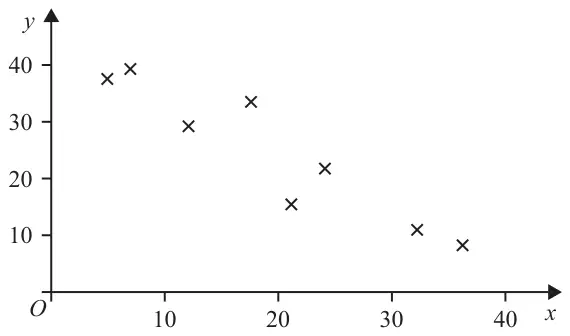
Test, at the 1% level of significance, whether or not there is evidence of a negative rank correlation between the two variables.
You should state your hypotheses and critical value and show your working clearly. (7)
| Scheme | Marks | AO | |||||||||||||||||||||||||||
|---|---|---|---|---|---|---|---|---|---|---|---|---|---|---|---|---|---|---|---|---|---|---|---|---|---|---|---|---|---|
| \(\mathrm{H}_0 : \rho_s = 0 \qquad \mathrm{H}_1 : \rho_s \lt 0\) | B1 | 2.5 | |||||||||||||||||||||||||||
| M1 dM1 | 3.1a 1.1b | |||||||||||||||||||||||||||
| \(r_s = 1 - \dfrac{6 \times \text{“}\textit{their} \sum d^2\text{”}}{8(8^2 - 1)}\) | M1 | 1.1b | |||||||||||||||||||||||||||
| \(r_s = -0.9285\ldots\) awrt –0.929 | A1 | 1.1b | |||||||||||||||||||||||||||
| Critical value –0.8333 | B1 | 1.1b | |||||||||||||||||||||||||||
| (Reject \(\mathrm{H}_0\)) there is sufficient evidence to suggest the data shows negative rank correlation. | A1ft | 2.2b | |||||||||||||||||||||||||||
| (7) | |||||||||||||||||||||||||||||
| (7 marks) |
Notes
1st B1: Both hypotheses correct in terms of \(\rho_s\) or \(\rho\)
1st M1: for an attempt to rank both rows (at least 4 correct in one row or 2 pairs).
Condone reverse rankings.
| \(x\) | 1 | 2 | 3 | 4 | 5 | 6 | 7 | 8 |
|---|---|---|---|---|---|---|---|---|
| \(y\) | 2 | 1 | 4 | 3 | 6 | 5 | 7 | 8 |
| \(d^2\) | 1 | 1 | 1 | 1 | 1 | 1 | 0 | 0 |
\(\sum d^2 = 6\)
2nd dM1: dep on 1st M1 for attempt at \(d\) or \(d^2\) row for their rankings.
3rd M1: for use of \(1 - \dfrac{6 \times \text{“}162\text{”}}{8(8^2 - 1)}\) Allow independently of 1st M1 and 2nd M1
1st A1: awrt –0.929 allow \(-\dfrac{13}{14}\) or –0.928 following a correct expression
Allow for + 0.929 etc following correct reverse ranking using \(\sum d^2 = 6\)
2nd B1: correct critical value (allow \(\pm\) 0.8333). 4dp here but allow 3 in 2nd A1
2nd A1ft: dependent upon all M marks and \(|r_s| = 0.929\) or \(|\text{cv}| = 0.833\) (or better)
No incorrect statements e.g. “accept \(\mathrm{H}_0\) there is evidence of negative …”
If comparison is seen it must be correct:
e.g. \(-0.929 \gt -0.833\) or \(-0.929 \lt 0.833\) are both A0
Allow “insufficient evidence of negative rank correlation” provided it follows from their \(r_s\) and their cv (at least one of which must be correct).