
AS June 2019 Q3
3. Two students, Jim and Dora, collected data on the mean annual rainfall, \(w\) cm, and the annual yield of leeks, \(l\) tonnes per hectare, for 10 years.
Jim summarised the data as follows
\[\mathrm{S}_{wl} = 42.786 \qquad \mathrm{S}_{ww} = 9936.9 \qquad \sum l^2 = 26.2326 \qquad \sum l = 16.06\]Dora decided to code the data first using \(s = w - 6\) and \(t = l - 20\)
Give a justification for your answer. (1)
Dora calculates the equation of the regression line of \(t\) on \(s\) to be \(t = 0.00431s - 18.87\)
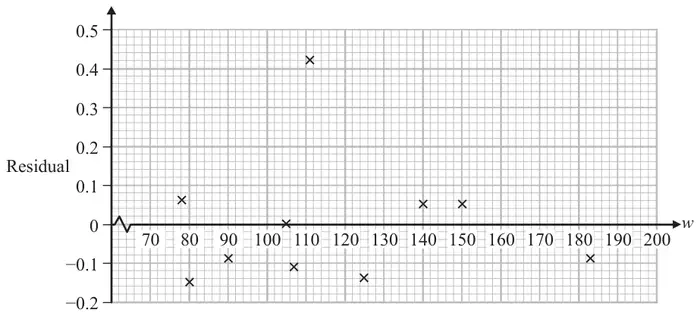
The graph shows the residual for each value of \(l\)
| Scheme | Marks | AO |
|---|---|---|
| \(\left[S_{ll} = 26.2326 - \dfrac{16.06^2}{10} = 0.44024\right]\) | ||
| \(r = \dfrac{42.786}{\sqrt{9936.9 \times \text{“}0.44024\text{”}}}\) | M1 | 1.1b |
| \(r = 0.64689\ldots\) awrt 0.647 | A1 | 1.1b |
| (2) |
Notes
M1: For a complete correct method to find \(r\)
A1: for awrt 0.647
| Scheme | Marks | AO |
|---|---|---|
| \(\text{“}0.647\text{”}\) coding has no effect on the pmcc | B1ft | 1.1b |
| (1) |
Notes
B1ft: stating their answer to part (a) and a correct reason
| Scheme | Marks | AO |
|---|---|---|
| \(l - 20 = 0.00431(w - 6) - 18.87\) | M1 | 3.1a |
| \(l = 0.00431w + \ldots.\) | M1 | 1.1b |
| \(l = 0.00431w + 1.10\,414\) | A1 | 1.1b |
| (3) |
Notes
M1: for use of a correct model. i.e. a correct expression for \(b\)
M1: for use of a correct model i.e. a correct expression (ft) for \(a\)
A1: for correct model \(l = 0.00431w + 1.10\) with awrt 0.00431 and awrt 1.10
| Scheme | Marks | AO |
|---|---|---|
| \(l = 0.00431 \times 100 + 1.10 = 1.53\) | B1ft | 3.4 |
| (1) |
Notes
B1ft: correct answer using their equation and \(w = 100\) or using \(t = 0.00431s - 18.87\) and \(s = 94\)
Allow awrt 1.53/1.54
| Scheme | Marks | AO |
|---|---|---|
| \(\text{RSS} = \text{“}0.44024\text{”} - \dfrac{(42.786)^2}{9936.9}\) or \(\text{“}0.44024\text{”}\left(1 - \text{“}0.647\text{”}^2\right)\) | M1 | 1.1b |
| RSS = 0.2560 | A1 | 1.1b |
| (2) |
Notes
M1: for a correct expression for RSS
A1: awrt 0.256
| Scheme | Marks | AO |
|---|---|---|
| (i) The points appear randomly scattered above and below zero giving us no reason to doubt the suitability of the linear model. | B1 | 3.5a |
| (ii) There is a possible outlier that could be removed (and the regression line recalculated). | B1 | 3.5c |
| (2) | ||
| (11 marks) |
Notes
(i) B1: For explaining why the model may be suitable. Allow randomly scattered around \(w\) (\(x\)) axis.
Do not allow most residuals close to zero or not suitable as not randomly scattered.
(ii) B1: For explaining how the fit of the model might be improved.