
A2 June 2019 Q2
2. A large field of wheat is split into 8 plots of equal area. Each plot is treated with a different amount of fertiliser, \(f\) grams/m2. The yield of wheat, \(w\) tonnes, from each plot is recorded. The results are summarised below.
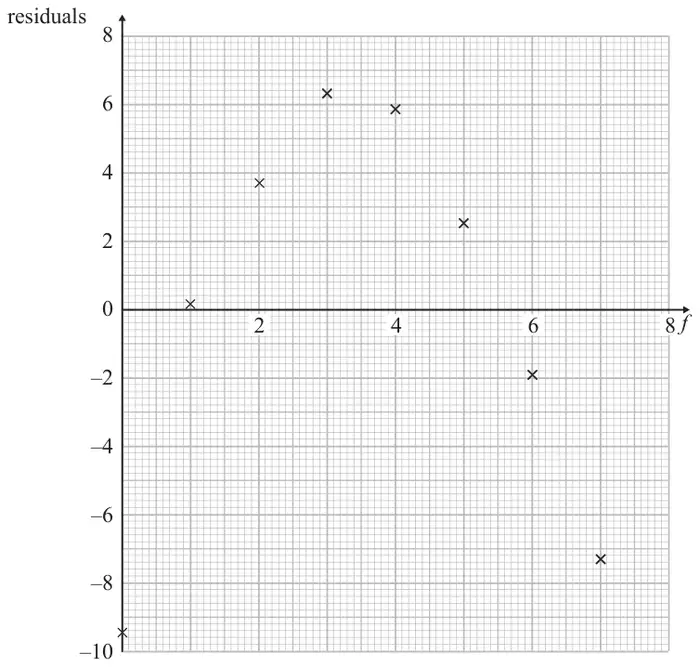
\[\sum f = 28 \qquad \sum w = 303 \qquad \sum w^2 = 13\,447 \qquad \mathrm{S}_{ff} = 42 \qquad \mathrm{S}_{fw} = 269.5\]The residuals of the data recorded are calculated and plotted on the graph below.
| Scheme | Marks | AO |
|---|---|---|
| \(S_{ww} = 13447 - \dfrac{303^2}{8} = 1970.875\) | ||
| \(r = \dfrac{269.5}{\sqrt{42 \times 1970.875}}\) | M1 | 1.1b |
| \(r = 0.9367\ldots\) awrt 0.937 | A1 | 1.1b |
| (2) |
Notes
M1: Complete correct method for finding \(r\)
A1: for awrt 0.937
| Scheme | Marks | AO |
|---|---|---|
| As the amount of fertiliser increases the yield increases | B1 | 3.2a |
| (1) |
Notes
B1: Correct contextual statement
| Scheme | Marks | AO |
|---|---|---|
| \(b = \dfrac{269.5}{42}\ [= 6.41666\ldots]\) | M1 | 3.3 |
| \(a = \dfrac{303}{8} - \text{‘}b\text{’}\dfrac{28}{8}\ [= 15.41666\ldots]\) | M1 | 1.1b |
| \(w = 15.4 + 6.42f\) | A1 | 1.1b |
| (3) |
Notes
M1: For use of a correct model ie a correct expression for \(b\)
M1: For use of a correct model ie a correct expression (ft) for \(a\)
A1: For a correct model \(w = 15.4 + 6.42f\) with awrt 15.4 and awrt 6.42
| Scheme | Marks | AO |
|---|---|---|
| 3.21 tonnes | B1ft | 1.1b |
| (1) |
Notes
B1ft: awrt 3.21 condone \(-3.21\)
| Scheme | Marks | AO |
|---|---|---|
| The residual plot is close to an ’n’ shape or the residuals appear not to be randomly scattered | M1 | 2.4 |
| The model in part (c) is unlikely to be suitable | A1 | 2.2b |
| (2) |
Notes
M1: Explaining a reason for their conclusion eg there is a pattern/trend in the residuals
Do not accept residuals not close to zero
A1: concluding it is not valid oe
| Scheme | Marks | AO |
|---|---|---|
| Fit a curve rather than a line | B1 | 3.5c |
| (1) | ||
| (10 marks) |
Notes
B1: A comment about not using a linear line eg use a quadratic model, logarithmic graph exponential