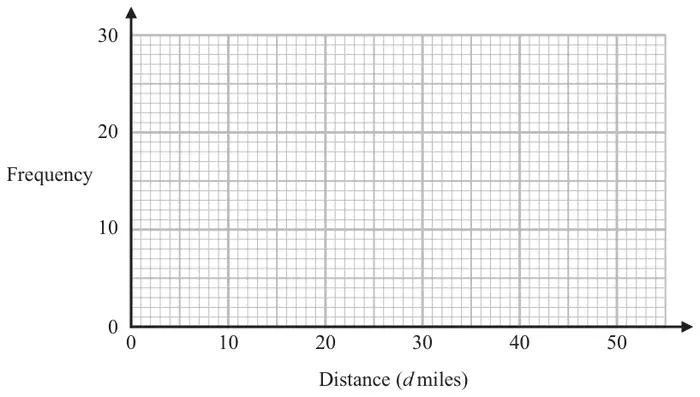
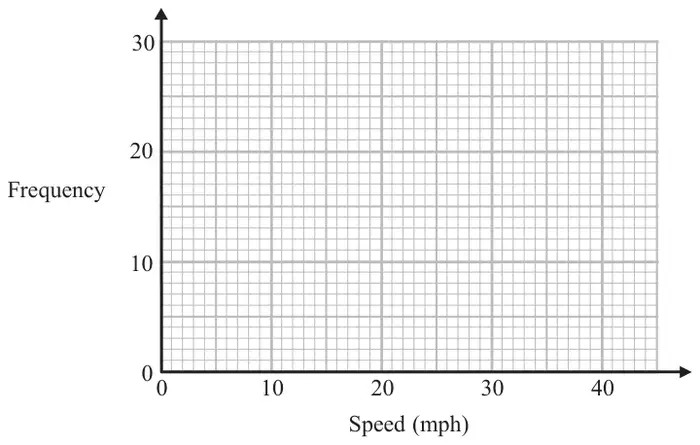
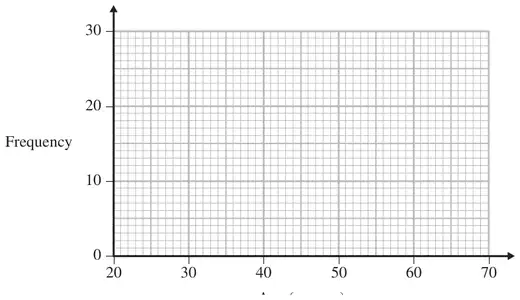
22 The table shows information about the distances that 60 people travel to work.
Distance (\(d\) miles)
Frequency
\(0 \lt d \leqslant 10\)
12
\(10 \lt d \leqslant 20\)
25
\(20 \lt d \leqslant 30\)
10
\(30 \lt d \leqslant 40\)
8
\(40 \lt d \leqslant 50\)
5
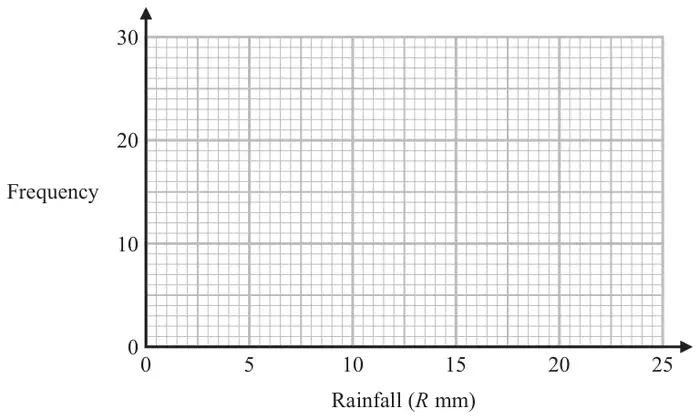
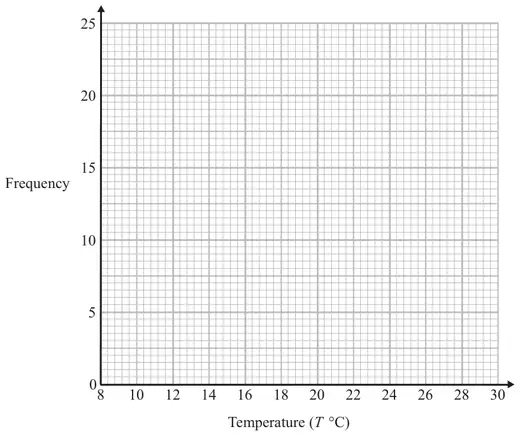
Draw a frequency polygon for the information in the table. (2)
Mark scheme
Answer
Mark
Mark scheme
Points plotted at (5, 12) (15, 25) (25, 10) (35, 8) (45, 5) and joined with line segments
B2
for correct plotting of all 5 points at midpoints and joining with line segments
(B1
for correct plotting of all 5 points at midpoints joined with a curve or missing / no line segments or for a frequency polygon with one point incorrect or for a frequency polygon with first and last point joined directly or for plotting of all 5 points at the correct heights consistent within intervals (including end points) and joining with line segments)
Additional guidance
Ignore any histogram drawn Ignore any part of the frequency polygon outside of the range of the first and last point plotted.
for example, at 0, 10, 20, 30, 40 or at 10, 20, 30, 40, 50
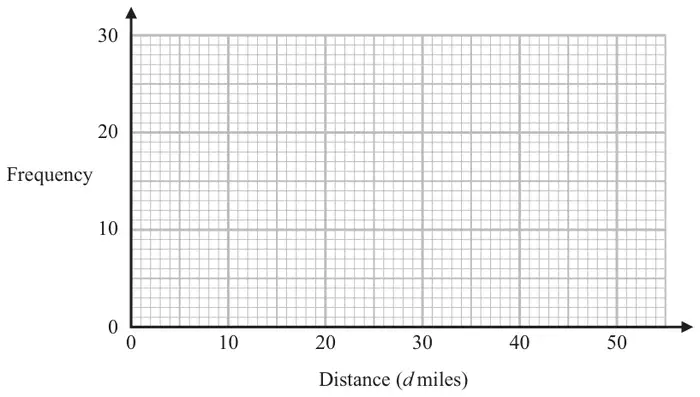
1 The table shows information about the distances that 60 people travel to work.
Distance (\(d\) miles)
Frequency
\(0 \lt d \leqslant 10\)
12
\(10 \lt d \leqslant 20\)
25
\(20 \lt d \leqslant 30\)
10
\(30 \lt d \leqslant 40\)
8
\(40 \lt d \leqslant 50\)
5
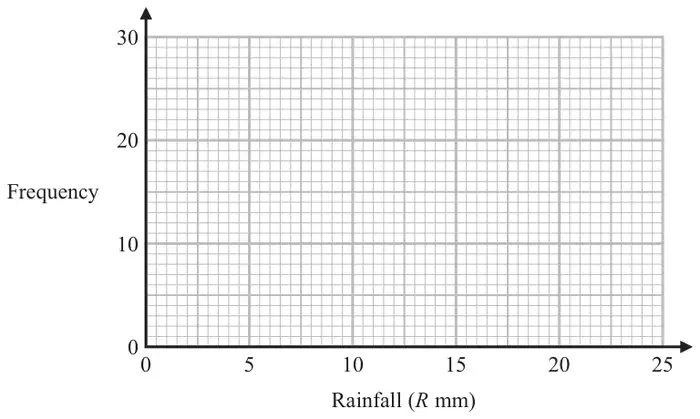
Draw a frequency polygon for the information in the table. (2)
Mark scheme
Answer
Mark
Mark scheme
Points plotted at (5, 12) (15, 25) (25, 10) (35, 8) (45, 5) and joined with line segments
B2
for correct plotting of all 5 points at midpoints and joining with line segments
(B1
for correct plotting of all 5 points at midpoints joined with a curve or missing / no line segments or for a frequency polygon with one point incorrect or for a frequency polygon with first and last point joined directly or for plotting of all 5 points at the correct heights consistent within intervals (including end points) and joining with line segments)
Additional guidance
Ignore any histogram drawn Ignore any part of the frequency polygon outside of the range of the first and last point plotted.
for example, at 0, 10, 20, 30, 40 or at 10, 20, 30, 40, 50
for all points plotted correctly but not joined with line segments or points plotted at correct heights not at midpoints but consistently within each interval and joined with line segments or correct frequency polygon with one point incorrect or correct frequency polygon with first and last points joined directly)
Additional guidance
Joining must be with line segments Accept points plotted within half a small square Ignore any histogram drawn and any part of a frequency polygon outside range of first and last points plotted
for all points plotted correctly but not joined with line segments or points plotted at correct heights not at midpoints but consistently within each interval and joined with line segments or correct frequency polygon with one point incorrect or correct frequency polygon with first and last points joined directly)
Additional guidance
Joining must be with line segments Accept points plotted within half a small square Ignore any histogram drawn and any part of a frequency polygon outside range of first and last points plotted
26 The table gives information about the lengths, in cm, of some pieces of string.
Length (\(t\) cm)
Frequency
\(0 \lt t \leqslant 10\)
15
\(10 \lt t \leqslant 20\)
20
\(20 \lt t \leqslant 30\)
50
\(30 \lt t \leqslant 40\)
25
\(40 \lt t \leqslant 50\)
5
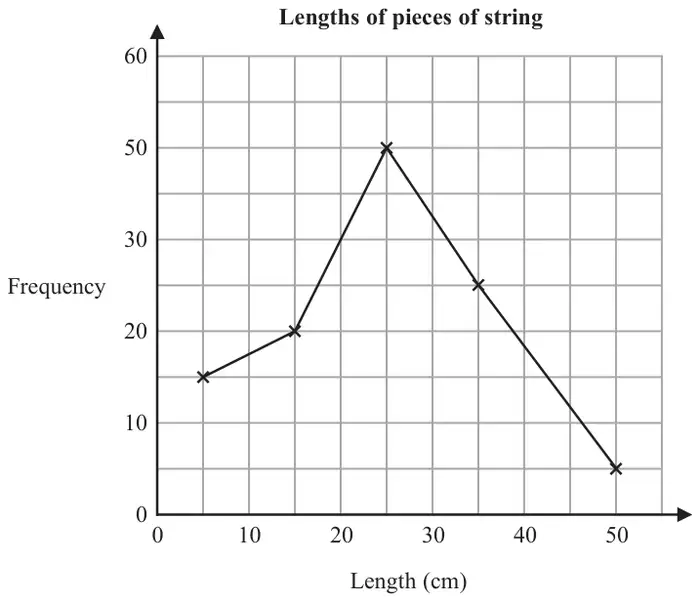
Amos draws a frequency polygon for the information in the table.
Write down two mistakes that Amos has made. (2)
Mark scheme
Answer
Mark
Mark scheme
40 missing from frequency scale
Incorrect point (50, 5)
C2
Two different statements Acceptable eg (50, 5) / the last point is incorrect the last point should be at (45,5) the last point plotted was placed incorrectly for his last point he has plotted by the end of the data and for the rest he has plotted by the middle he did not use the midpoint, he used 50 instead of 45 40 missing (from vertical axis) vertical scale is not linear the frequency doesn’t increase in the same intervals the vertical axis is not right Not acceptable eg the last point should be at (40, 5) bottom of the polygon should be connected he didn’t start the graph at the origin he did not draw a polygon he has plotted the first 4 points at midpoint
(C1
One acceptable statement)
Additional guidance
Ignore additional statements provided no contradiction
5 The table gives information about the lengths, in cm, of some pieces of string.
Length (\(t\) cm)
Frequency
\(0 \lt t \leqslant 10\)
15
\(10 \lt t \leqslant 20\)
20
\(20 \lt t \leqslant 30\)
50
\(30 \lt t \leqslant 40\)
25
\(40 \lt t \leqslant 50\)
5
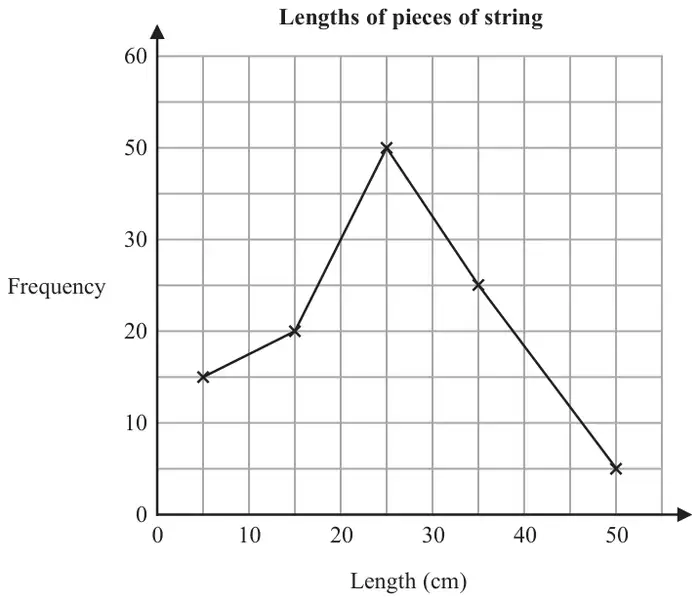
Amos draws a frequency polygon for the information in the table.
Write down two mistakes that Amos has made. (2)
Mark scheme
Answer
Mark
Mark scheme
40 missing from frequency scale
Incorrect point (50, 5)
C2
Two different statements Acceptable eg (50, 5) / the last point is incorrect the last point should be at (45,5) the last point plotted was placed incorrectly for his last point he has plotted by the end of the data and for the rest he has plotted by the middle he did not use the midpoint, he used 50 instead of 45
40 missing (from vertical axis) vertical scale is not linear the frequency doesn’t increase in the same intervals the vertical axis is not right
Not acceptable eg the last point should be at (40, 5) bottom of the polygon should be connected he didn’t start the graph at the origin he did not draw a polygon he has plotted the first 4 points at midpoint
(C1
One acceptable statement)
Additional guidance
Ignore additional statements provided no contradiction
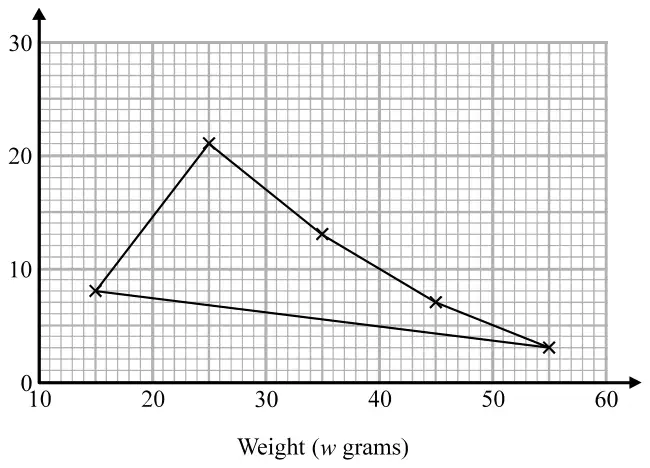
21 The table shows some information about the weights of 50 potatoes.
Weight (\(w\) grams)
Frequency
\(10 \lt w \leqslant 20\)
6
\(20 \lt w \leqslant 30\)
21
\(30 \lt w \leqslant 40\)
13
\(40 \lt w \leqslant 50\)
7
\(50 \lt w \leqslant 60\)
3
Iveta drew this frequency polygon for the information in the table. The frequency polygon is not fully correct.
Write down two things that are wrong with the frequency polygon. (2)
Mark scheme
Answer
Mark
Mark scheme
Two statements
C2
Two different statements Acceptable There is no ‘frequency’ label / \(y\)-axis is not labelled / no title for the \(y\)-axis The polygon should not be closed / have a line at the bottom / have first and last points connected (15, 6) has been plotted incorrectly / at (15, 8) / (The first point is at) 8 rather than 6 / First point is on an incorrect frequency
Not acceptable There is no title / Points should be joined with a curve \(x\)-axis doesn’t start at 0 There is no label The axes have not been labelled (\(x\) and \(y\)) The points haven’t (all) been plotted correctly \(10 \lt w \leqslant 20\) and \(30 \lt w \leqslant 40\) have been plotted wrong The first point is plotted incorrectly, its at (15, 7) not (15, 6) The points have been joined up wrong / Points should not be joined in the shape of a triangle / They’ve connected all the points Done the midpoints rather than the numbers on the right side / The points are in the middle
(C1
for one statement eg from those above)
Additional guidance
Ignore additional statements provided no contradiction
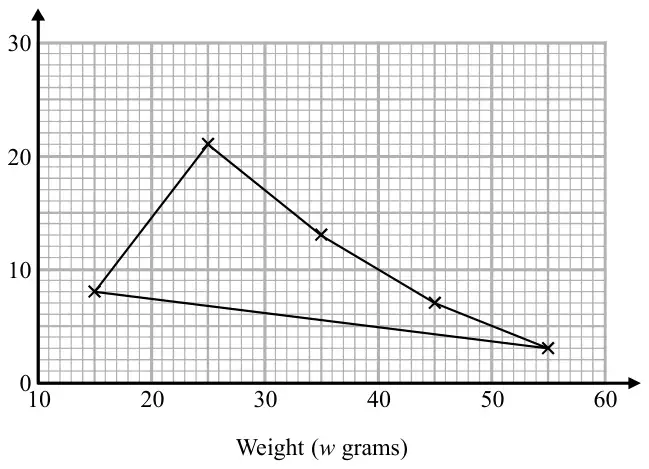
1 The table shows some information about the weights of 50 potatoes.
Weight (\(w\) grams)
Frequency
\(10 \lt w \leqslant 20\)
6
\(20 \lt w \leqslant 30\)
21
\(30 \lt w \leqslant 40\)
13
\(40 \lt w \leqslant 50\)
7
\(50 \lt w \leqslant 60\)
3
Iveta drew this frequency polygon for the information in the table. The frequency polygon is not fully correct.
Write down two things that are wrong with the frequency polygon. (2)
Mark scheme
Answer
Mark
Mark scheme
Two statements
C2
Two different statements Acceptable There is no ‘frequency’ label / \(y\)-axis is not labelled / no title for the \(y\)-axis The polygon should not be closed / have a line at the bottom / have first and last points connected (15, 6) has been plotted incorrectly / at (15, 8) / (The first point is at) 8 rather than 6 / First point is on an incorrect frequency
Not acceptable There is no title / Points should be joined with a curve / \(x\)-axis doesn’t start at 0 There is no label / The axes have not been labelled (\(x\) and \(y\)) The points haven’t (all) been plotted correctly \(10 \lt w \leqslant 20\) and \(30 \lt w \leqslant 40\) have been plotted wrong The first point is plotted incorrectly, its at (15, 7) not (15, 6) The points have been joined up wrong / Points should not be joined in the shape of a triangle / They’ve connected all the points Done the midpoints rather than the numbers on the right side / The points are in the middle
(C1
for one statement eg from those above)
Additional guidance
Ignore additional statements provided no contradiction
for fully correct polygon with points plotted at the midpoints
(B1
for points plotted correctly but not joined by straight lines or joining points at correct heights consistently within intervals including plotting at end values or correct frequency polygon with one point incorrect or correct frequency polygon with first and last points joined directly)
Additional guidance
For B2: Joining must be with line segments
For B1: for example, at 10, 20, 30,...or at 20, 30, 40,... Ignore any histogram drawn and any part of frequency polygon outside range of first and last points plotted
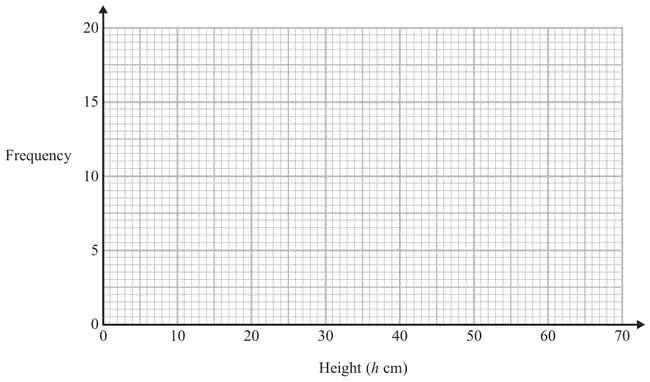
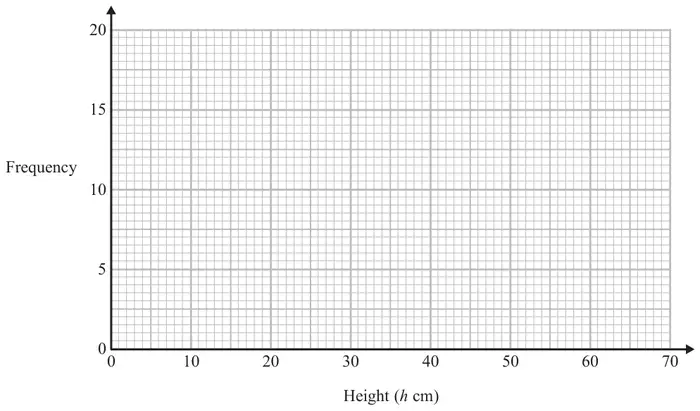
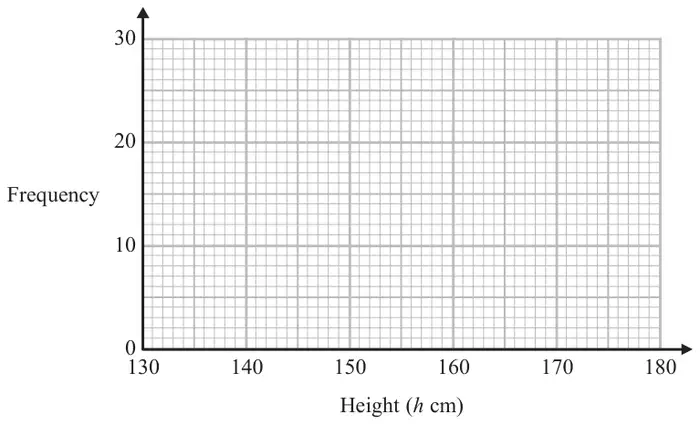
3 The table shows information about the heights of 80 plants.
Height (\(h\) cm)
Frequency
\(10 \lt h \leqslant 20\)
7
\(20 \lt h \leqslant 30\)
13
\(30 \lt h \leqslant 40\)
14
\(40 \lt h \leqslant 50\)
12
\(50 \lt h \leqslant 60\)
16
\(60 \lt h \leqslant 70\)
18
(a) Find the class interval that contains the median. (1)
(b) On the grid, draw a frequency polygon for the information in the table.(2)
Mark scheme (a)
Answer
Mark
Mark scheme
\(40 \lt h \leqslant 50\)
B1
accept 40 – 50 oe
Mark scheme (b)
Answer
Mark
Mark scheme
polygon drawn
B2
for fully correct polygon with points plotted at the midpoints
(B1
for points plotted correctly but not joined by straight lines or joining points at correct heights consistently within intervals including plotting at end values or correct frequency polygon with one point incorrect or correct frequency polygon with first and last points joined directly)
Additional guidance
Joining must be with line segments (15, 7), (25, 13) (35, 14), (45, 12) (55, 16), (65, 18)
For example, at 10, 20, 30,… or at 20, 30, 40,…
Ignore any histogram drawn and any part of frequency polygon outside range of first and last points plotted
7 The table gives information about the speeds of 70 cars.
Speed (\(s\) mph)
Frequency
\(0 \lt s \leqslant 10\)
14
\(10 \lt s \leqslant 20\)
18
\(20 \lt s \leqslant 30\)
26
\(30 \lt s \leqslant 40\)
12
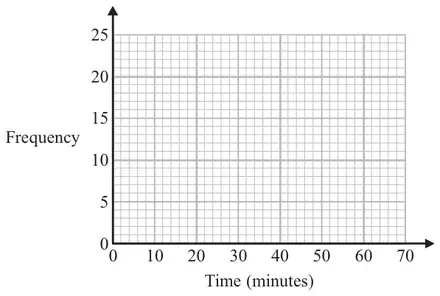
Draw a frequency polygon for this information. (2)
Mark scheme
Answer
Mark
Mark scheme
Diagram drawn
B2
for correct frequency polygon
(B1
for points plotted at correct midpoints of intervals or joining points at correct heights consistently within intervals including plotting at end values or correct frequency polygon with one point incorrect or correct frequency polygon with first and last points joined directly)
Additional guidance
Plotting at (5,14), (15,18), (25,26), (35,12) Must use line segments for B2
Joining must be with line segments NB ignore any histogram drawn and any part of frequency polygon outside range of first and last points plotted
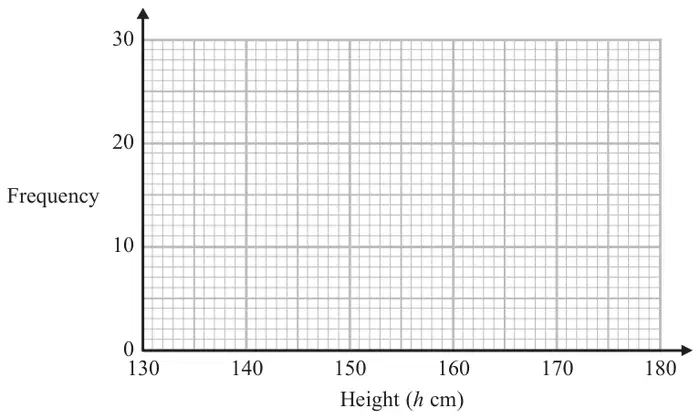
19 The table shows information about the heights of 80 children.
Height (\(h\) cm)
Frequency
\(130 \lt h \leqslant 140\)
4
\(140 \lt h \leqslant 150\)
11
\(150 \lt h \leqslant 160\)
24
\(160 \lt h \leqslant 170\)
22
\(170 \lt h \leqslant 180\)
19
(a) Find the class interval that contains the median. (1)
(b) Draw a frequency polygon for the information in the table.(2)
Mark scheme (a)
Answer
Mark
Notes
\(160 \lt h \leqslant 170\)
B1
correct class interval
Mark scheme (b)
Answer
Mark
Notes
Line segments joining the points (135, 4), (145, 11), (155, 24), (165, 22) and (175, 19)
C2
for fully correct frequency polygon
[C1
for points plotted correctly at midpoints of intervals OR joining points with line segments at the correct heights and consistent within the intervals (including end values) OR correct frequency polygon with one point incorrect OR correct frequency polygon with first and last point joined] NB: ignore any histogram drawn and any part of frequency polygon outside range of first and last points plotted
1 The table shows information about the heights of 80 children.
Height (\(h\) cm)
Frequency
\(130 \lt h \leqslant 140\)
4
\(140 \lt h \leqslant 150\)
11
\(150 \lt h \leqslant 160\)
24
\(160 \lt h \leqslant 170\)
22
\(170 \lt h \leqslant 180\)
19
(a) Find the class interval that contains the median. (1)
(b) Draw a frequency polygon for the information in the table.(2)
Mark scheme (a)
Answer
Mark
Notes
\(160 \lt h \leqslant 170\)
B1
correct class interval
Mark scheme (b)
Answer
Mark
Notes
Line segments joining the points (135, 4), (145, 11), (155, 24), (165, 22) and (175, 19)
C2
for fully correct frequency polygon
[C1
for points plotted correctly at midpoints of intervals OR joining points with line segments at the correct heights and consistent within the intervals (including end values) OR correct frequency polygon with one point incorrect OR correct frequency polygon with first and last point joined] NB: ignore any histogram drawn and any part of frequency polygon outside range of first and last points plotted
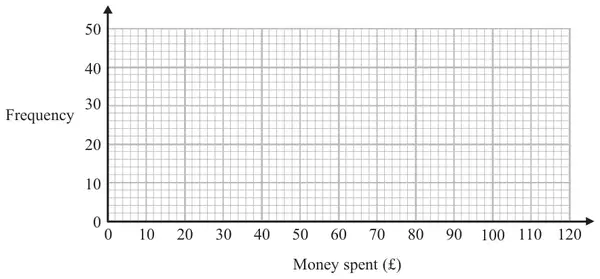
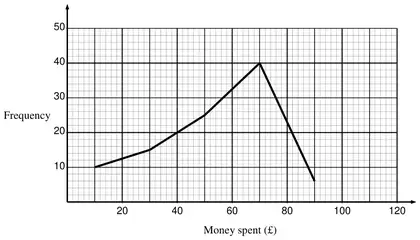
20 The table gives information about the money, £\(A\), some people spent on an internet site one day.
Money spent (£\(A\))
Frequency
\(0 \lt A \leqslant 20\)
10
\(20 \lt A \leqslant 40\)
15
\(40 \lt A \leqslant 60\)
25
\(60 \lt A \leqslant 80\)
40
\(80 \lt A \leqslant 100\)
6
(a) On the grid, draw a frequency polygon for this information.(2)
(b) Write down the modal class interval. (1)
Mark scheme (a)
Answer
Mark
Notes
Frequency polygon
2
B2 correct frequency polygon (B1 for points plotted correctly but not joined or for points plotted at the correct heights, consistently placed within the class intervals (including ends) and joined or for an otherwise correct frequency polygon with no more than one point incorrect or correct frequency polygon with first and last points joined directly)
NB: ignore parts of graph drawn to the left of the 1st point or the right of the last point; ignore any histograms drawn.
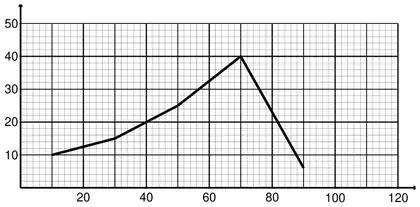
3 The table gives information about the money, £\(A\), some people spent on an internet site one day.
Money spent (£\(A\))
Frequency
\(0 \lt A \leqslant 20\)
10
\(20 \lt A \leqslant 40\)
15
\(40 \lt A \leqslant 60\)
25
\(60 \lt A \leqslant 80\)
40
\(80 \lt A \leqslant 100\)
6
(a) On the grid, draw a frequency polygon for this information.(2)
(b) Write down the modal class interval. (1)
Mark scheme (a)
Answer
Mark
Notes
Frequency polygon
2
B2 correct frequency polygon (B1 for points plotted correctly but not joined OR for points plotted at the correct heights, consistently placed within the class intervals (including ends) and joined OR for an otherwise correct frequency polygon with one point incorrect OR correct frequency polygon with first and last points joined directly)
NB: ignore parts of graph drawn to the left of the 1st point or the right of the last point; ignore any histograms drawn.
22 The table shows some information about the ages of 60 teachers.
Age (\(a\) years)
Frequency
\(20 \lt a \leqslant 30\)
6
\(30 \lt a \leqslant 40\)
16
\(40 \lt a \leqslant 50\)
14
\(50 \lt a \leqslant 60\)
22
\(60 \lt a \leqslant 70\)
2
(a) Write down the modal class interval. (1)
(b) Draw a frequency polygon for the information in the table.(2)
Mark scheme (a)
Answer
Mark
Notes
\(50 \lt a \leqslant 60\)
1
B1 for correctly identifying the modal class interval e.g. 50 – 60 oe
Mark scheme (b)
Answer
Mark
Notes
Polygon
2
B2 for fully correct frequency polygon - points plotted at the midpoint (B1 for all points plotted accurately but not joined with straight line segments or all points plotted accurately and joined with last joined to first to make a polygon or all points at the correct heights and consistently within or at the ends of the intervals and joined (can include joining last to first to make a polygon)
NB: ignore parts of graph drawn to the left of the 1st point or the right of the last point; ignore any histograms drawn.
6 The table shows some information about the ages of 60 teachers.
Age (\(a\) years)
Frequency
\(20 \lt a \leqslant 30\)
6
\(30 \lt a \leqslant 40\)
16
\(40 \lt a \leqslant 50\)
14
\(50 \lt a \leqslant 60\)
22
\(60 \lt a \leqslant 70\)
2
(a) Write down the modal class interval. (1)
(b) Draw a frequency polygon for the information in the table.(2)
Mark scheme (a)
Answer
Mark
Notes
\(50 \lt a \leqslant 60\)
1
B1 for correctly identifying the modal class interval e.g. 50 – 60 oe
Mark scheme (b)
Answer
Mark
Notes
Polygon
2
B2 for fully correct frequency polygon - points plotted at the midpoint (B1 for all points plotted accurately but not joined with straight line segments or all points plotted accurately and joined with last joined to first to make a polygon or all points at the correct heights and consistently within or at the ends of the intervals and joined (can include joining last to first to make a polygon)) NB: ignore parts of graph drawn to the left of the 1st point or the right of the last point; ignore any histograms drawn.
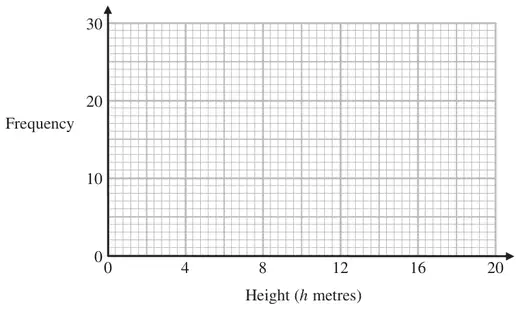
24 The table shows information about the heights of 50 trees.
Height (\(h\) metres)
Frequency
\(0 \lt h \leqslant 4\)
8
\(4 \lt h \leqslant 8\)
21
\(8 \lt h \leqslant 12\)
12
\(12 \lt h \leqslant 16\)
7
\(16 \lt h \leqslant 20\)
2
Draw a frequency polygon for the information in the table. (2)
Mark scheme
Answer
Mark
Notes
Polygon drawn
2
B2 for correct frequency polygon (B1 for points plotted at correct midpoints of intervals or joining points at correct heights consistently within intervals including plotting at end values or correct frequency polygon with one point incorrect or correct frequency polygon with first and last points joined directly)
NB ignore any histogram drawn and any part of frequency polygon outside range of first and last points plotted
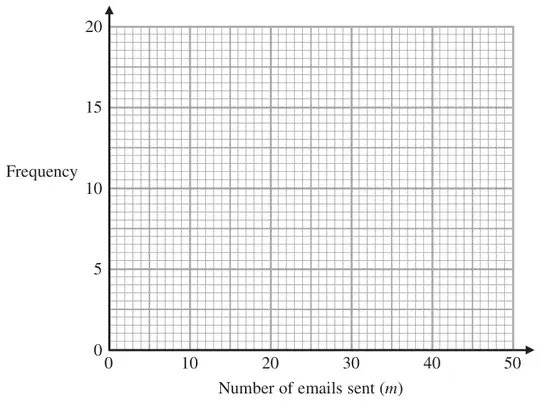
9 The frequency table gives information about the numbers of emails sent by 51 teachers on Monday.
Number of emails sent (\(m\))
Frequency
\(0 \lt m \leqslant 10\)
5
\(10 \lt m \leqslant 20\)
17
\(20 \lt m \leqslant 30\)
14
\(30 \lt m \leqslant 40\)
9
\(40 \lt m \leqslant 50\)
6
(a) On the grid below, draw a frequency polygon for this information.(2)
*(b) Nalini says that at least a quarter of these teachers sent more than 30 emails. Is Nalini correct? You must explain your answer. (2)
Mark scheme (a)
Answer
Mark
Notes
Polygon drawn
2
B2 for correct plotting of 5 points and joining with line segments (B1 for points plotted correctly at midpoints of intervals OR joining points with line segments at the correct heights and consistent within the class interval (including end values) OR correct frequency polygon with one point incorrect OR correct frequency polygon with first and last point joined) NB Ignore any histogram drawn and any part of frequency polygon outside range of first and last points plotted
Mark scheme (b)
Answer
Mark
Notes
Yes with reason
2
M1 for finding a quarter of 51 and for finding how many teachers sent more than 30 emails C1 for 12.75 or 13 compared to 15 and yes she is correct
OR M1 for finding how many teachers sent more than 30 emails and ‘15’ × 4 C1 for comparing 60 with 51 and yes she is correct
OR M1 for \(15 \div 51\) (= 0.29...) or \(\dfrac{15}{51} \times 100\) (= 29…%) C1 for comparing 0.29.. with \(\dfrac{1}{4}\) or 0.25 OR 29….% with 25% and yes she is correct
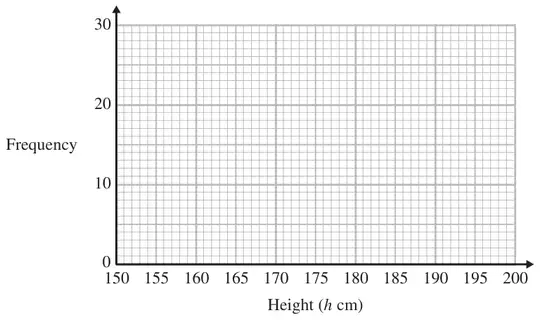
8 The frequency table gives information about the heights of some people.
Height (\(h\) cm)
Frequency
\(160 \lt h \leqslant 165\)
2
\(165 \lt h \leqslant 170\)
5
\(170 \lt h \leqslant 175\)
10
\(175 \lt h \leqslant 180\)
21
\(180 \lt h \leqslant 185\)
16
\(185 \lt h \leqslant 190\)
4
Draw a frequency polygon for this information.
(2)
Mark scheme
Answer
Mark
Notes
Polygon drawn
2
B2 for fully correct frequency polygon - points plotted at the midpoint (B1 for all points plotted accurately but not joined with straight line segments) or all points plotted accurately and joined with last joined to first to make a polygon or all points at the correct heights and consistently within or at the ends of the intervals and joined (can include joining last to first to make a polygon) NB: ignore parts of graph drawn to the left of the 1st point or the right of the last point; ignore any histograms drawn.
M1 for finding \(fx\) with \(x\) consistent within intervals (including the end points) allow 1 error; implied by 820, 1020 M1 (dep) for use of all correct mid-interval values eg 920 M1 (dep on 1st M1) for \(\sum fx \div \sum f\) A1 for 18.4 oe
Mark scheme (c)
Answer
Mark
Notes
correct frequency polygon
2
B2 for fully correct frequency polygon - points plotted at the midpoint (B1 for all points plotted accurately but not joined with straight line segments) or all points plotted accurately and joined with last joined to first to make a polygon or all points at the correct heights and consistently within or at the ends of the intervals and joined (can include joining last to first to make a polygon) NB: ignore parts of graph drawn to the left of the 1st point or the right of the last point
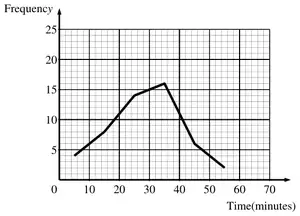
12 The frequency table gives information about the times it took some office workers to get to the office one day.
Time (\(t\) minutes)
Frequency
\(0 \lt t \leqslant 10\)
4
\(10 \lt t \leqslant 20\)
8
\(20 \lt t \leqslant 30\)
14
\(30 \lt t \leqslant 40\)
16
\(40 \lt t \leqslant 50\)
6
\(50 \lt t \leqslant 60\)
2
(a) Draw a frequency polygon for this information.(2)
(b) Write down the modal class interval. (1)
One of the office workers is chosen at random.
(c) Work out the probability that this office worker took more than 40 minutes to get to the office. (2)
Mark scheme (a)
Working
Answer
Mark
Notes
Correct Frequency Polygon
2
B2 Fully correct polygon. Points plotted at the midpoint (B1 All points plotted accurately not joined, or one error in plotting but joined or all points plotted accurately and joined with, additionally, first joined to last or all points at the correct heights and consistently within or at the ends of the intervals and joined (Includes joining last to first to make a polygon)) NB: ignore polygon before 1st point, and after last point. Ignore any histograms.
Mark scheme (b)
Answer
Mark
Notes
\(30 \lt t \leqslant 40\)
1
B1 Allow any notation eg, 30-40 ft polygon
Mark scheme (c)
Working
Answer
Mark
Notes
(6 +2) = 8, (4 + 8 + 14 + 16 + 6 + 2) = 50
\(\dfrac{8}{50}\) oe
2
M1 (6 +2)÷ (4 + 8 + 14 + 16 + 6 + 2) or ft figures from polygon or \(\frac{8}{a}\) with \(a \gt 8\) or \(\frac{c}{50}\) with \(c \lt 50\) or 8 and 50 used but notation incorrect (eg. 8:50 , 8 out of 50) A1 \(\frac{8}{50}\) oe (eg. 0.16) or ft figures from polygon
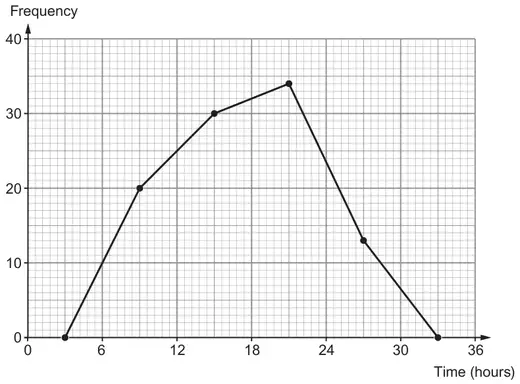
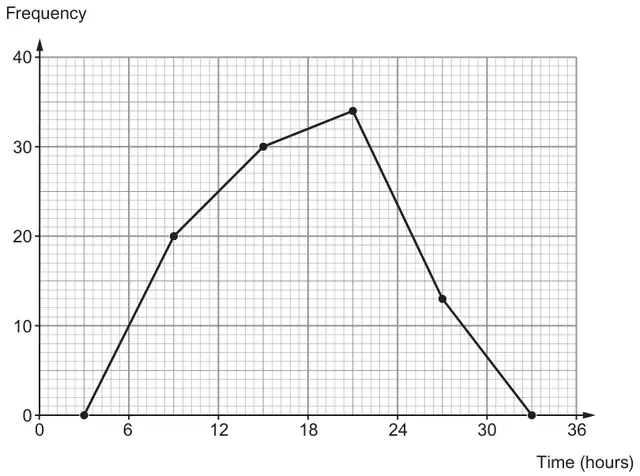
A survey was carried out to find the total time people took to read the book ‘Wales is a Celtic Country’. The results are shown in the frequency polygon below.
(i)
Which is the modal group? Circle your answer. [1]
18 to 24 hours21 hours12 to 18 hours34 hours30 to 36 hours
(ii)
How many people took part in the survey? Circle your answer. [1]
34303397108
(iii)
How many of the people in the survey took 24 hours or more to read this book? Circle your answer. [1]
1334472484
(iv)
Did any of the people in the survey take less than 6 hours to read this book?
Yes ☐ No ☐ Can’t tell ☐
You must give a reason for your answer. [1]
(b)
Four books are placed in a stack.
The thickness of each of the books is as follows:
22 mm25 mm29 mm31 mm
The thickness of each book is measured correct to the nearest mm.
Show that the total height of the stack of these four books cannot be more than 109 mm. [3]
Mark scheme (a)
Scheme
Marks
Comments
(i) 18 to 24 hours
B1
(ii) 97
B1
(iii) 13
B1
(iv) States or unambiguously implies ‘No’ with a reason, e.g. ‘no people in group 0 to 6 hours’
E1
Allow ‘No’ with e.g. ‘the point before 6 hours is at zero’
Do not allow ‘Can’t tell’ with e.g. ‘it is grouped data’
Do not accept “No’ with e.g. ‘it is grouped data’ (unless explaining why) ‘there is no point at 6’ ‘6 hours has a frequency of 0’ ‘it does not match a group of people’ ‘the first point is at 0 and the second one is at 20’ ‘the first plot is at 20’ ‘the first plot is at 9 hours’ ‘the first plot above 0 is at 9 hours’ ‘there is no information at 6 hours, it starts at 9 hours’ ‘the shortest time is 9 hours’
Mark scheme (b)
Scheme
Marks
Comments
Sight of 22.5, 25.5, 29.5 and 31.5 (mm)
B1
Award B1 for sight of 4 × 0.5 in an appropriate calculation Allow 0.4999(….) for 0.5, must clearly be a recurring 9 digit
22.5 + 25.5 + 29.5 + 31.5 or 22+25+29+31 + 4 × 0.5 or equivalent
A survey was carried out to find the total time people took to read the book ‘Wales is a Celtic Country’. The results are shown in the frequency polygon below.
(i)
Which is the modal group? Circle your answer. [1]
18 to 24 hours 21 hours 12 to 18 hours 34 hours 30 to 36 hours
(ii)
How many people took part in the survey? Circle your answer. [1]
34 30 33 97 108
(iii)
How many of the people in the survey took 24 hours or more to read this book? Circle your answer. [1]
13 34 47 24 84
(iv)
Did any of the people in the survey take less than 6 hours to read this book?
Yes ☐ No ☐ Can’t tell ☐
You must give a reason for your answer. [1]
(b)
Four books are placed in a stack.
The thickness of each of the books is as follows:
22 mm 25 mm 29 mm 31 mm
The thickness of each book is measured correct to the nearest mm.
Show that the total height of the stack of these four books cannot be more than 109 mm. [3]
Mark scheme (a)
Scheme
Mark
Comments
(i) 18 to 24 hours
B1
(ii) 97
B1
(iii) 13
B1
(iv) States or unambiguously implies ‘No’ with a reason, e.g. ‘no people in group 0 to 6 hours’
E1
Allow ‘No’ with e.g. ‘the point before 6 hours is at zero’
Do not allow ‘Can’t tell’ with e.g. ‘it is grouped data’
Do not accept “No’ with e.g. ‘it is grouped data’ (unless explaining why) ‘there is no point at 6’ ‘6 hours has a frequency of 0’ ‘it does not match a group of people’ ‘the first point is at 0 and the second one is at 20’ ‘the first plot is at 20’ ‘the first plot is at 9 hours’ ‘the first plot above 0 is at 9 hours’ ‘there is no information at 6 hours, it starts at 9 hours’ ‘the shortest time is 9 hours’
Mark scheme (b)
Scheme
Mark
Comments
Sight of 22.5, 25.5, 29.5 and 31.5 (mm)
B1
Award B1 for sight of 4 × 0.5 in an appropriate calculation Allow 0.4999(….) for 0.5, must clearly be a recurring 9 digit
22.5 + 25.5 + 29.5 + 31.5 or 22+25+29+31 + 4 × 0.5 or equivalent
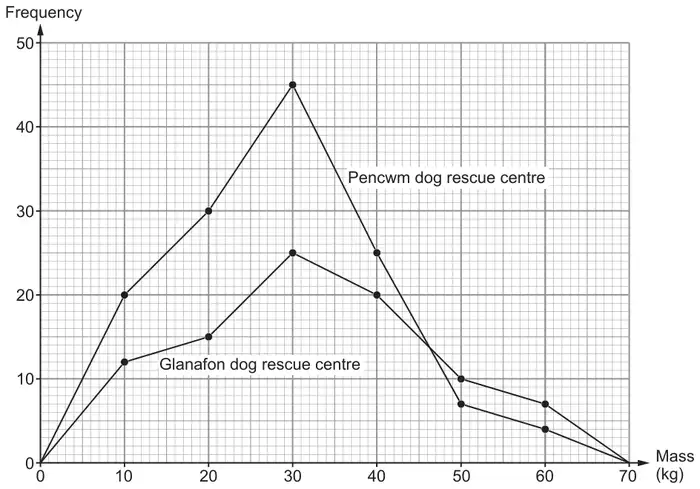
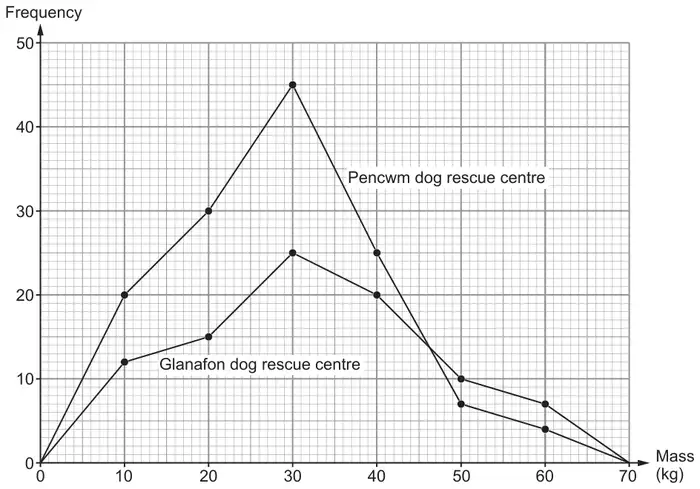
The results are shown in the frequency polygons below.
(a)
Doreen, Rory and Muzhir look at these frequency polygons.
(i) Doreen says,
“The modal group of the masses of dogs in each dog rescue centre is the same.”
Is Doreen correct?
Yes ☐ No ☐ Can’t tell ☐
You must give a reason for your answer. [1]
(ii) Rory says,
“28 of the dogs in Pencwm each have a mass of 18 kg.”
Is Rory correct?
Yes ☐ No ☐ Can’t tell ☐
You must give a reason for your answer. [1]
(iii) Muzhir says,
“There is a higher proportion of dogs that are heavier than 35 kg in Glanafon than in Pencwm.”
Without doing any calculations, decide if Muzhir is correct.
Correct ☐ Incorrect ☐ Can’t tell ☐
You must give a reason for your answer. [1]
(b) The estimate of the mean mass of the dogs in Glanafon was 32·5 kg. How much less was the estimate of the mean mass of the dogs in Pencwm? You must show all your working. [5]
Estimate of the mean mass of the dogs in Pencwm is …………… kg less than in Glanafon.
Mark scheme (a)
Scheme
Marks
Comments
(i) Unambiguously indicates or states ‘Yes’ with a reason, e.g. ‘both 25 kg to 35 kg’, ‘the highest frequencies at the same mass’
E1
Ignore any additional spurious or contradictory statements provided ‘Yes’ selected
Allow ‘Yes’ with a reason, e.g. ‘both at 30 kg’, ‘both at the same mass’, ‘both have the same mass’, ‘tallest (highest frequency) is 30 kg for both polygons’
Do not accept ‘Yes’ with a reason, e.g. ‘don’t know’, ‘both in the same place’, ‘the groups have the same width’, ‘the graph tells us this’
(ii) Unambiguously indicates or states ‘Can’t tell’ with a reason, e.g. ‘there were 30 dogs with a masses between 15 kg and 25 kg’, ‘no raw data is given’, ‘the actual mass of each dog is not given’, ‘the data is grouped’
E1
Ignore any additional spurious or contradictory statements provided ‘Can’t tell’ selected
Allow ‘Can’t tell’ with a reason, e.g. ‘doesn’t show this’, ‘you can’t tell the exact number of dogs’ ‘doesn’t give the amount of dogs’
Do not accept ‘Can’t tell’ with a reason, e.g. ‘don’t know’, ‘it is an estimate’, ‘it isn’t accurate’, ‘because they can be anywhere from 10 kg to 20 kg’
(iii) Unambiguously indicates or states ‘Correct’ with a reason, e.g. ‘Pencwm polygon shows a greater drop for greater masses’, ‘fewer dogs but more large dogs in Glanafon’, ‘more dogs in Pencwm, but fewer large dogs’, ‘about the same number of large dogs, with fewer dogs in Glanafon’, ‘about the same number of large dogs, with more dogs in Pencwm’,
E1
Ignore any additional spurious or contradictory statements provided ‘Correct’ selected
Do not allow a reason based on calculations of proportions alone, e.g. Pencwm 27.5%, Glanafon 41.6%
Allow ‘Correct’ with a reason, e.g. ‘Pencwm (polygon) shows a steeper drop from 30 kg’, ‘line for Pencwm is steeper (drop)’, ‘Glanafon (polygon) has a less steep drop for larger dogs’, ‘the greater masses are more frequent (in Glanafon)’ ‘2 of the 3 points for Glanafon are above Pencwm’, ‘Pencwm line drops below Glanafon after 40 (kg)’
Do not accept ‘Correct’ with a reason, e.g. ‘36 dogs in Pencwm and 37 dogs in Glanafon’ alone without considering proportion, ‘the greatest is 45 kg’, ‘higher frequency in Glanafon’, ‘Pencwm is bigger but doesn’t have higher proportion’ ‘as seen by the skew in (the) Glanafon (polygon)’, ‘seen by the shape (of the polygon) for Glanafon’
Mark scheme (b)
Scheme
Marks
Comments
(Total number of dogs 20 + 30 + 45 + 25 + 7 + 4 =) 131
B1
May be implied by the sight of ((20 + 30 + 45 + 25 + 7 + 4) ÷ 6 =) 21.8(33...)
2. Glanafon and Pencwm dog rescue centres take in unwanted dogs.
The mass of each dog in the two dog rescue centres was recorded.
Groups of width 10 kg were used:
5 kg \(\leqslant\) mass \(<\) 15 kg, 15 kg \(\leqslant\) mass \(<\) 25 kg, …, 55 kg \(\leqslant\) mass \(<\) 65 kg
The results are shown in the frequency polygons below.
(a)
Doreen, Rory and Muzhir look at these frequency polygons.
(i)
Doreen says,
“The modal group of the masses of dogs in each dog rescue centre is the same.”
Is Doreen correct?
Yes ☐ No ☐ Can’t tell ☐
You must give a reason for your answer. [1]
(ii)
Rory says,
“28 of the dogs in Pencwm each have a mass of 18 kg.”
Is Rory correct?
Yes ☐ No ☐ Can’t tell ☐
You must give a reason for your answer. [1]
(iii)
Muzhir says,
“There is a higher proportion of dogs that are heavier than 35 kg in Glanafon than in Pencwm.”
Without doing any calculations, decide if Muzhir is correct.
Correct ☐ Incorrect ☐ Can’t tell ☐
You must give a reason for your answer. [1]
(b)
The estimate of the mean mass of the dogs in Glanafon was 32·5 kg. How much less was the estimate of the mean mass of the dogs in Pencwm? You must show all your working. [5]
Estimate of the mean mass of the dogs in Pencwm is …………… kg less than in Glanafon.
Mark scheme (a)
(i)
Scheme
Marks
Comments
Unambiguously indicates or states ‘Yes’ with a reason, e.g. ‘both 25 kg to 35 kg’, ‘the highest frequencies at the same mass’
E1
Ignore any additional spurious or contradictory statements provided ‘Yes’ selected
Allow ‘Yes’ with a reason, e.g. ‘both at 30 kg’, ‘both at the same mass’, ‘both have the same mass’, ‘tallest (highest frequency) is 30 kg for both polygons’
Do not accept ‘Yes’ with a reason, e.g. ‘don’t know’, ‘both in the same place’, ‘the groups have the same width’, ‘the graph tells us this’
(ii)
Scheme
Marks
Comments
Unambiguously indicates or states ‘Can’t tell’ with a reason, e.g. ‘there were 30 dogs with a masses between 15 kg and 25 kg’, ‘no raw data is given’, ‘the actual mass of each dog is not given’, ‘the data is grouped’
E1
Ignore any additional spurious or contradictory statements provided ‘Can’t tell’ selected
Allow ‘Can’t tell’ with a reason, e.g. ‘doesn’t show this’, ‘you can’t tell the exact number of dogs’ ‘doesn’t give the amount of dogs’
Do not accept ‘Can’t tell’ with a reason, e.g. ‘don’t know’, ‘it is an estimate’, ‘it isn’t accurate’, ‘because they can be anywhere from 10 kg to 20 kg’
(iii)
Scheme
Marks
Comments
Unambiguously indicates or states ‘Correct’ with a reason, e.g. ‘Pencwm polygon shows a greater drop for greater masses’, ‘fewer dogs but more large dogs in Glanafon’, ‘more dogs in Pencwm, but fewer large dogs’, ‘about the same number of large dogs, with fewer dogs in Glanafon’, ‘about the same number of large dogs, with more dogs in Pencwm’,
E1
Ignore any additional spurious or contradictory statements provided ‘Correct’ selected
Do not allow a reason based on calculations of proportions alone, e.g. Pencwm 27.5%, Glanafon 41.6%
Allow ‘Correct’ with a reason, e.g. ‘Pencwm (polygon) shows a steeper drop from 30 kg’, ‘line for Pencwm is steeper (drop)’ ‘Glanafon (polygon) has a less steep drop for larger dogs’, ‘the greater masses are more frequent (in Glanafon)’, ‘2 of the 3 points for Glanafon are above Pencwm’, ‘Pencwm line drops below Glanafon after 40 (kg)’,
Do not accept ‘Correct’ with a reason, e.g. ‘36 dogs in Pencwm and 37 dogs in Glanafon’ alone without considering proportion, ‘the greatest is 45 kg’, ‘higher frequency in Glanafon’, ‘Pencwm is bigger but doesn’t have higher proportion’ ‘as seen by the skew in (the) Glanafon (polygon)’, ‘seen by the shape (of the polygon) for Glanafon’
Mark scheme (b)
Scheme
Marks
Comments
(Total number of dogs 20 + 30 + 45 + 25 + 7 + 4 =) 131
B1
May be implied by the sight of ((20 + 30 + 45 + 25 + 7 + 4) ÷ 6 =) 21.8(33….)
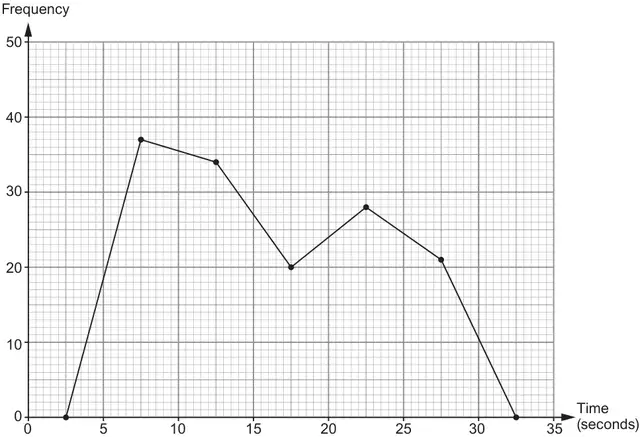
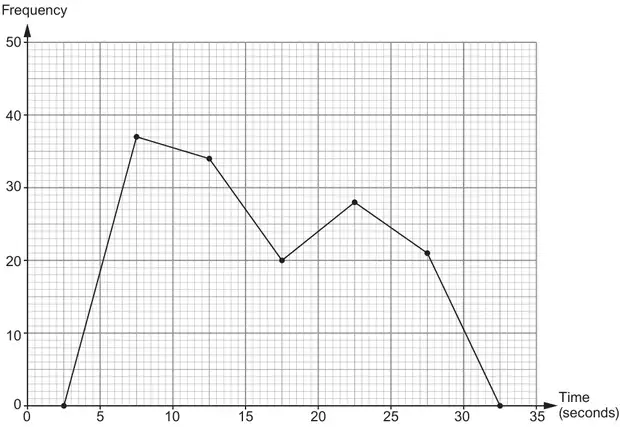
7. On Monday, Mrs Griffin recorded the time each of her students took to start a task. She records her data in groups of equal width. Mrs Griffin displays the results in a frequency polygon, as shown below.
(a) On Monday, how many students started the task? [2]
(b) Which is the modal group of the times taken to start the task? Circle your answer.
7·5 seconds 20 to 25 seconds 5 to 10 seconds
15 to 20 seconds 37 seconds [1]
(c) In which group is the median time taken to start the task? [2]
(d) Mrs Griffin had set a target that students should start the task within 30 seconds. Was the target met? You must give a reason for your answer. [1]
Yes ☐ No ☐ Can’t tell ☐
(e)
On Tuesday, the same students started the same task again. 25% of them started the task within 10 seconds.
Is this an improvement on the number of students who started the task within 10 seconds on Monday? You must show all your working. [2]
Yes ☐ No ☐
Mark scheme (a)
Scheme
Marks
Comments
37 + 34 + 20 + 28 + 21
M1
Allow M1 for
any 4 of the 5 readings correct in a sum of 5 non-zero readings, or
for a total (≠140 but) 140 ± 2
total of 140 seen with further working with ‘their’ final answer ≠ 140
140 (students)
A1
Mark final answer
Mark scheme (b)
Scheme
Marks
Comments
5 to 10 seconds
B1
Mark scheme (c)
Scheme
Marks
Comments
Allow if considering the 0.5(n+1)th term throughout
FT ‘their 140’ provided ‘their 140’ > 100 throughout
10 (seconds) to 15 (seconds)
B2
Not from incorrect working Allow for an inclusive or exclusive range of times
B1 for any of the following:
appropriate sight of 70 or 140 ÷ 2
the answer 12.5 seconds
Mark scheme (d)
Scheme
Marks
Comments
Selects or unambiguously implies ‘Yes’ with a reason, e.g. ‘no students in group 30 to 35 seconds’, ‘last students started in 25 to 30 second range’
E1
Allow the term ‘finished’ as meaning ‘finished starting the task’, e.g. ‘Yes’ with ‘no student finished after 30 seconds’
Allow, ‘yes’ with a reason, e.g. ‘all students started before 30 seconds’, ‘data stopped after 30 seconds’, ‘no students in the last group’
Allow selection of ‘Can’t tell’ with a reason based on thinking 30 seconds may be included in the group 25 to 30, so some students could have taken exactly 30 seconds to start and not started within 30 seconds, that is thinking ‘within 30 seconds’ does not include ‘30 seconds’
Do not accept ‘Yes’ with a reason, e.g. ‘no students after 27.5 seconds’, ‘all students between 27.5 and 32.5 seconds could start within 30 seconds’
2. On Monday, Mrs Griffin recorded the time each of her students took to start a task. She records her data in groups of equal width. Mrs Griffin displays the results in a frequency polygon, as shown below.
(a) On Monday, how many students started the task? [2]
(b) In which group is the median time taken to start the task? [2]
(c)
Mrs Griffin had set a target that students should start the task within 30 seconds. Was the target met? You must give a reason for your answer. [1]
Yes ☐ No ☐ Can’t tell ☐
(d)
On Tuesday, the same students started the same task again. 25% of them started the task within 10 seconds.
Is this an improvement on the number of students who started the task within 10 seconds on Monday? You must show all your working. [2]
Yes ☐ No ☐
Mark scheme (a)
Scheme
Marks
Comments
37 + 34 + 20 + 28 + 21
M1
Allow M1 for
any 4 of the 5 readings correct in a sum of 5 non-zero readings, or
for a total (≠140 but) 140 ± 2
total of 140 seen with further working with ‘their’ final answer ≠ 140
140 (students)
A1
Mark final answer
Mark scheme (b)
Scheme
Marks
Comments
10 (seconds) to 15 (seconds)
B2
Allow if considering the 0.5(n+1)th term throughout
FT ‘their 140’ provided ‘their 140’ > 100 throughout
Not from incorrect working Allow for an inclusive or exclusive range of times
B1 for any of the following:
appropriate sight of 70 or 140 ÷ 2
the answer 12.5 seconds
Mark scheme (c)
Scheme
Marks
Comments
Selects or unambiguously implies ‘Yes’ with a reason, e.g. ‘no students in group 30 to 35 seconds’, ‘last students started in 25 to 30 second range’
E1
Allow the term ‘finished’ as meaning ‘finished starting the task’, e.g. ‘Yes’ with ‘no student finished after 30 seconds’
Allow, ‘yes’ with a reason, e.g. ‘all students started before 30 seconds’, ‘data stopped after 30 seconds’, ‘no students in the last group’
Allow selection of ‘Can’t tell’ with a reason based on thinking 30 seconds may be included in the group 25 to 30, so some students could have taken exactly 30 seconds to start and not started within 30 seconds, that is thinking ‘within 30 seconds’ does not include ‘30 seconds’
Do not accept ‘Yes’ with a reason, e.g. ‘no students after 27.5 seconds’, ‘all students between 27.5 and 32.5 seconds could start within 30 seconds’
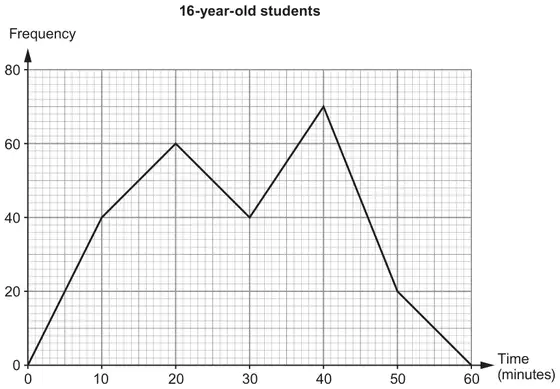
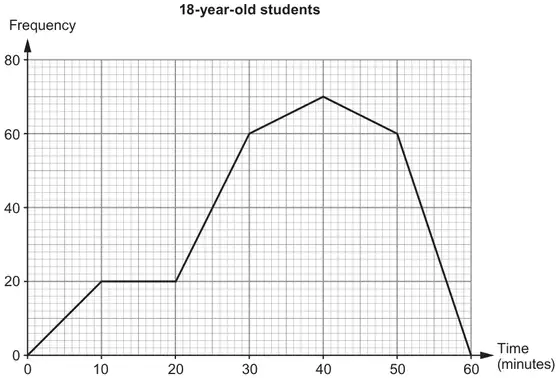
6. A survey was carried out to find how much time a group of 16-year-old students and a group of 18-year-old students spent using social media. The frequency polygons below, which use equal time intervals, illustrate the results.
(a) How many 16-year-old students took part in the survey? Circle your answer. [1]
60 70 210 230 2300
(b) How many more 16-year-old students than 18-year-old students spent between 15 minutes and 25 minutes using social media? Circle your answer. [1]
20 40 60 100 250
(c) Wesley says,
‘The 16-year-old students generally spent about the same time using social media as the 18-year-old students.’
Using the frequency polygons, how would you explain to Wesley that his statement is not true? [1]
Mark scheme (a)
Scheme
Marks
Comments
230
B1
Mark scheme (b)
Scheme
Marks
Comments
40
B1
Mark scheme (c)
Scheme
Marks
Comments
Reason, e.g. ‘graph for 18-year olds leans towards the greater times’, ‘the frequency polygon for times from (the plot at) 30 minutes are greater for the 18-year olds’, ‘more 18-year olds spend longer times than 16 year olds', ‘more 18-year olds for 30 minutes, same at 40 minutes and more at 50 minutes’, ‘more 18-year olds at 50 minutes’, ‘more 18-year olds from 25 minutes onwards’, ‘many more 16-year olds than 18-year olds spend 20 (or 25) minutes or less’, ‘median is higher for the 18-year olds’, ‘more 16-year olds use less time on social media than 18-year olds’
E1
If readings are used they must be correct, e.g. at 50 minutes there are
20 16-year olds and 60 18-year olds,
or 40 more 18-year olds than 16-year olds
3 times as many 18-year olds spend 50 minutes as 16-year olds
Allow e.g. ‘half way through the 18-year olds frequency rises higher than for 16-year olds’
Do not accept irrelevant, incorrect or incomplete statements e.g. ‘more 18-year olds spend 30 minutes’, ‘more 16-year olds spend 20 minutes’, ‘because more than 60 18-year olds spend 30 to 50 minutes’, ‘The mode for 16-year olds using social media is the same as for 18-year olds’, ’16-year olds frequency is higher to start’, ‘not true because the frequency polygons would look roughly the same’, ‘not true because the shapes of the frequency polygons are very different’, ‘there is only one point where 16 and 18-year olds spend the same amount of time’, ‘because the polygons are not the same’, ‘the 2 polygons have different trends’, ‘the average time is greater for 18-year olds’
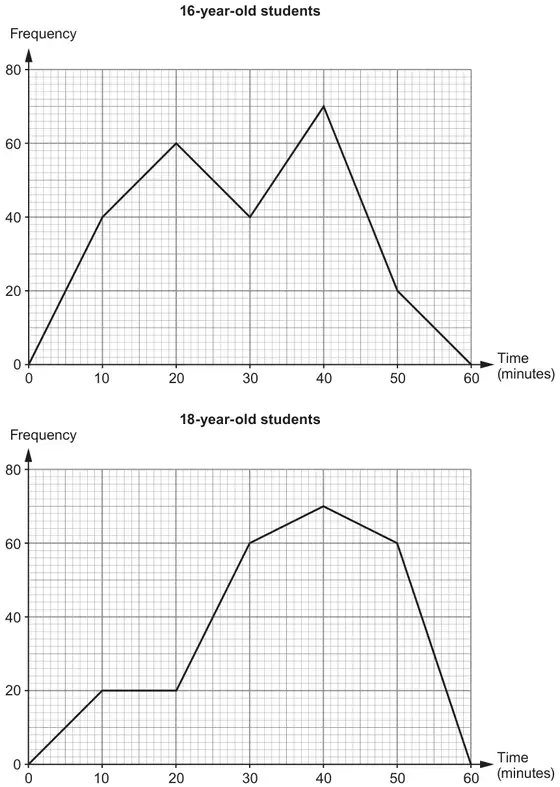
2. A survey was carried out to find how much time a group of 16-year-old students and a group of 18-year-old students spent using social media. The frequency polygons below, which use equal time intervals, illustrate the results.
(a) How many 16-year-old students took part in the survey? Circle your answer. [1]
60 70 210 230 2300
(b) How many more 16-year-old students than 18-year-old students spent between 15 minutes and 25 minutes using social media? Circle your answer. [1]
20 40 60 100 250
(c)
Wesley says,
‘The 16-year-old students generally spent about the same time using social media as the 18-year-old students.’
Using the frequency polygons, how would you explain to Wesley that his statement is not true? [1]
Mark scheme (a)
Scheme
Marks
Comments
230
B1
Mark scheme (b)
Scheme
Marks
Comments
40
B1
Mark scheme (c)
Scheme
Marks
Comments
Reason, e.g. ‘graph for 18-year olds leans towards the greater times’, ‘the frequency polygon for times from (the plot at) 30 minutes are greater for the 18-year olds’, ‘more 18-year olds spend longer times than 16 year olds', ‘more 18-year olds for 30 minutes, same at 40 minutes and more at 50 minutes’, ‘more 18-year olds at 50 minutes’, ‘more 18-year olds from 25 minutes onwards’, ‘many more 16-year olds than 18-year olds spend 20 (or 25) minutes or less’, ‘median is higher for the 18-year olds’, ‘more 16-year olds use less time on social media than 18-year olds’
E1
If readings are used they must be correct, e.g. at 50 minutes there are
20 16-year olds and 60 18-year olds,
or 40 more 18-year olds than 16-year olds
3 times as many 18-year olds spend 50 minutes as 16-year olds
Allow e.g. ‘half way through the 18-year olds frequency rises higher than for 16-year olds’
Do not accept irrelevant, incorrect or incomplete statements e.g. ‘more 18-year olds spend 30 minutes’, ‘more 16-year olds spend 20 minutes’, ‘because more than 60 18-year olds spend 30 to 50 minutes’, ‘The mode for 16-year olds using social media is the same as for 18-year olds’, ’16-year olds frequency is higher to start’, ‘not true because the frequency polygons would look roughly the same’, ‘not true because the shapes of the frequency polygons are very different’, ‘there is only one point where 16 and 18-year olds spend the same amount of time’, ‘because the polygons are not the same’, ‘the 2 polygons have different trends’, ‘the average time is greater for 18-year olds’
We'd like to use Google Analytics cookies to count visits and see which pages help most. They're optional, and the site works exactly the same either way. Privacy policy