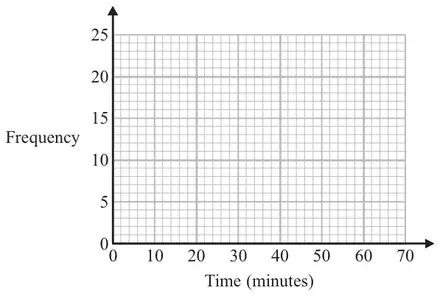
12 The frequency table gives information about the times it took some office workers to get to the office one day.
Time (\(t\) minutes)
Frequency
\(0 \lt t \leqslant 10\)
4
\(10 \lt t \leqslant 20\)
8
\(20 \lt t \leqslant 30\)
14
\(30 \lt t \leqslant 40\)
16
\(40 \lt t \leqslant 50\)
6
\(50 \lt t \leqslant 60\)
2
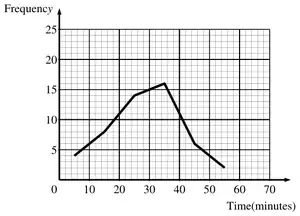
(a) Draw a frequency polygon for this information.(2)
(b) Write down the modal class interval. (1)
One of the office workers is chosen at random.
(c) Work out the probability that this office worker took more than 40 minutes to get to the office. (2)
Mark scheme (a)
Working
Answer
Mark
Notes
Correct Frequency Polygon
2
B2 Fully correct polygon. Points plotted at the midpoint (B1 All points plotted accurately not joined, or one error in plotting but joined or all points plotted accurately and joined with, additionally, first joined to last or all points at the correct heights and consistently within or at the ends of the intervals and joined (Includes joining last to first to make a polygon)) NB: ignore polygon before 1st point, and after last point. Ignore any histograms.
Mark scheme (b)
Answer
Mark
Notes
\(30 \lt t \leqslant 40\)
1
B1 Allow any notation eg, 30-40 ft polygon
Mark scheme (c)
Working
Answer
Mark
Notes
(6 +2) = 8, (4 + 8 + 14 + 16 + 6 + 2) = 50
\(\dfrac{8}{50}\) oe
2
M1 (6 +2)÷ (4 + 8 + 14 + 16 + 6 + 2) or ft figures from polygon or \(\frac{8}{a}\) with \(a \gt 8\) or \(\frac{c}{50}\) with \(c \lt 50\) or 8 and 50 used but notation incorrect (eg. 8:50 , 8 out of 50) A1 \(\frac{8}{50}\) oe (eg. 0.16) or ft figures from polygon