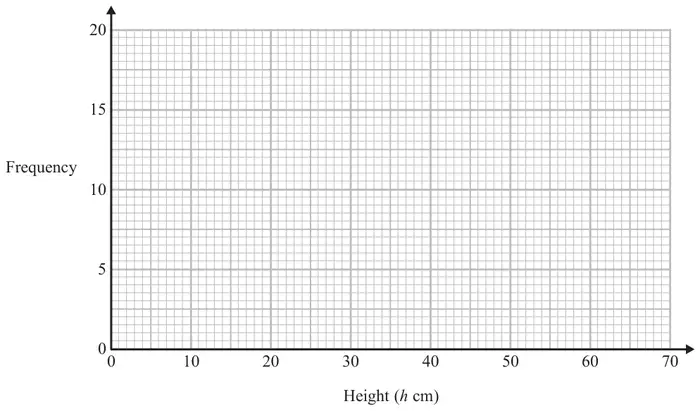
3 The table shows information about the heights of 80 plants.
Height (\(h\) cm)
Frequency
\(10 \lt h \leqslant 20\)
7
\(20 \lt h \leqslant 30\)
13
\(30 \lt h \leqslant 40\)
14
\(40 \lt h \leqslant 50\)
12
\(50 \lt h \leqslant 60\)
16
\(60 \lt h \leqslant 70\)
18
(a) Find the class interval that contains the median. (1)
(b) On the grid, draw a frequency polygon for the information in the table.(2)
Mark scheme (a)
Answer
Mark
Mark scheme
\(40 \lt h \leqslant 50\)
B1
accept 40 – 50 oe
Mark scheme (b)
Answer
Mark
Mark scheme
polygon drawn
B2
for fully correct polygon with points plotted at the midpoints
(B1
for points plotted correctly but not joined by straight lines or joining points at correct heights consistently within intervals including plotting at end values or correct frequency polygon with one point incorrect or correct frequency polygon with first and last points joined directly)
Additional guidance
Joining must be with line segments (15, 7), (25, 13) (35, 14), (45, 12) (55, 16), (65, 18)
For example, at 10, 20, 30,… or at 20, 30, 40,…
Ignore any histogram drawn and any part of frequency polygon outside range of first and last points plotted