
Numeracy Higher June 2017 Unit 1 Q2
2. A survey was carried out to find how much time a group of 16-year-old students and a group of 18-year-old students spent using social media.
The frequency polygons below, which use equal time intervals, illustrate the results.
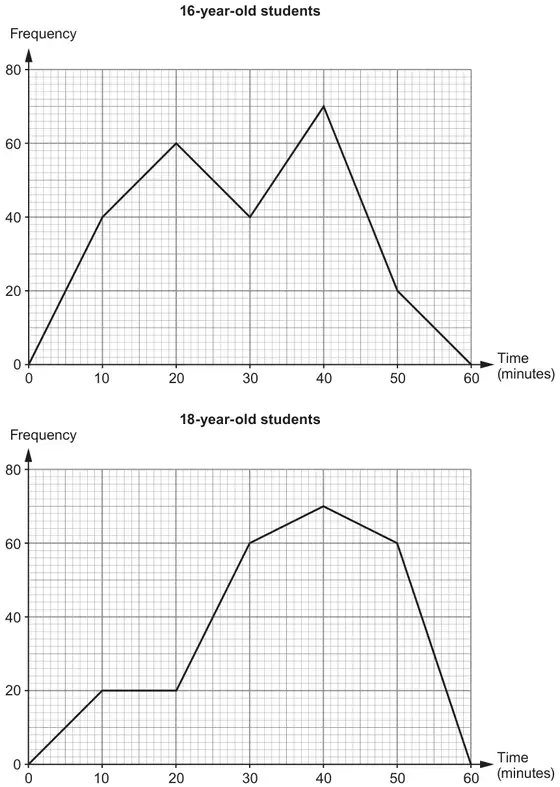
(a) How many 16-year-old students took part in the survey?
Circle your answer. [1]
Circle your answer. [1]
60 70 210 230 2300
(b) How many more 16-year-old students than 18-year-old students spent between 15 minutes and 25 minutes using social media?
Circle your answer. [1]
Circle your answer. [1]
20 40 60 100 250
(c)
Wesley says,
‘The 16-year-old students generally spent about the same time using social media as the 18-year-old students.’
Using the frequency polygons, how would you explain to Wesley that his statement is not true? [1]
| Scheme | Marks | Comments |
|---|---|---|
| 230 | B1 |
| Scheme | Marks | Comments |
|---|---|---|
| 40 | B1 |
| Scheme | Marks | Comments |
|---|---|---|
| Reason, e.g. ‘graph for 18-year olds leans towards the greater times’, ‘the frequency polygon for times from (the plot at) 30 minutes are greater for the 18-year olds’, ‘more 18-year olds spend longer times than 16 year olds', ‘more 18-year olds for 30 minutes, same at 40 minutes and more at 50 minutes’, ‘more 18-year olds at 50 minutes’, ‘more 18-year olds from 25 minutes onwards’, ‘many more 16-year olds than 18-year olds spend 20 (or 25) minutes or less’, ‘median is higher for the 18-year olds’, ‘more 16-year olds use less time on social media than 18-year olds’ | E1 | If readings are used they must be correct, e.g. at 50 minutes there are
‘half way through the 18-year olds frequency rises higher than for 16-year olds’ Do not accept irrelevant, incorrect or incomplete statements e.g. ‘more 18-year olds spend 30 minutes’, ‘more 16-year olds spend 20 minutes’, ‘because more than 60 18-year olds spend 30 to 50 minutes’, ‘The mode for 16-year olds using social media is the same as for 18-year olds’, ’16-year olds frequency is higher to start’, ‘not true because the frequency polygons would look roughly the same’, ‘not true because the shapes of the frequency polygons are very different’, ‘there is only one point where 16 and 18-year olds spend the same amount of time’, ‘because the polygons are not the same’, ‘the 2 polygons have different trends’, ‘the average time is greater for 18-year olds’ |