
Foundation June 2022 Paper 3 Q26
26 The table gives information about the lengths, in cm, of some pieces of string.
| Length (\(t\) cm) | Frequency |
|---|---|
| \(0 \lt t \leqslant 10\) | 15 |
| \(10 \lt t \leqslant 20\) | 20 |
| \(20 \lt t \leqslant 30\) | 50 |
| \(30 \lt t \leqslant 40\) | 25 |
| \(40 \lt t \leqslant 50\) | 5 |
Amos draws a frequency polygon for the information in the table.
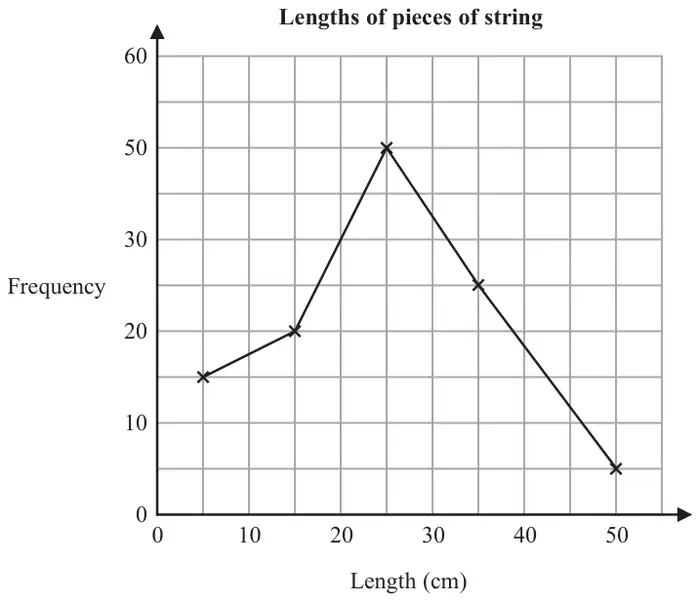
Write down two mistakes that Amos has made. (2)
| Answer | Mark | Mark scheme |
|---|---|---|
| 40 missing from frequency scale Incorrect point (50, 5) | C2 | Two different statements Acceptable eg (50, 5) / the last point is incorrect the last point should be at (45,5) the last point plotted was placed incorrectly for his last point he has plotted by the end of the data and for the rest he has plotted by the middle he did not use the midpoint, he used 50 instead of 45 40 missing (from vertical axis) vertical scale is not linear the frequency doesn’t increase in the same intervals the vertical axis is not right Not acceptable eg the last point should be at (40, 5) bottom of the polygon should be connected he didn’t start the graph at the origin he did not draw a polygon he has plotted the first 4 points at midpoint |
| (C1 | One acceptable statement) |
Additional guidance
Ignore additional statements provided no contradiction