Normal Distribution

Includes hypothesis testingIncludes sampling

Edexcel

AQA

OCR A

OCR MEI

June 2025 Paper 3 Q5

EdexcelCurrent spec10 marksNormal Distribution

5. The heights of men in a tennis club are normally distributed with a mean of 183 cm and a standard deviation of 4.9 cm.

A man from the tennis club is selected at random.

(a) Find the probability that the man’s height is
(i) more than 186 cm,
(ii) between 175 cm and 185 cm. (2)

The heights of women in the tennis club are normally distributed with a mean of \(\mu\) cm and a standard deviation of \(\sigma\) cm.

Given that 40% of the women are shorter than 170 cm and 15% are taller than 175 cm,

(b) find the value of \(\mu\) and the value of \(\sigma\)
Show your working clearly. (5)

A man from the tennis club and a woman from the tennis club are selected at random.

(c) Find the probability that both players have heights between 170 cm and 175 cm. (3)

June 2024 Paper 3 Q5

EdexcelCurrent spec10 marksNormal DistributionProbability

5. The records for a school athletics club show that the height, \(H\) metres, achieved by students in the high jump is normally distributed with mean 1.4 metres and standard deviation 0.15 metres.

(a) Find the proportion of these students achieving a height of more than 1.6 metres. (1)

The records also show that the time, \(T\) seconds, to run 1500 metres is normally distributed with mean 330 seconds and standard deviation 26 seconds.

The school’s Head would like to use these distributions to estimate the proportion of students from the school athletics club who can jump higher than 1.6 metres and can run 1500 metres in less than 5 minutes.

(b) State a necessary assumption about \(H\) and \(T\) for the Head to calculate an estimate of this proportion. (1)
(c) Find the Head’s estimate of this proportion. (3)

Students in the school athletics club also throw the discus.

The random variable \(D \sim \mathrm{N}\left(\mu, \sigma^2\right)\) represents the distance, in metres, that a student can throw the discus.

Given that \(\mathrm{P}(D \lt 16.3) = 0.30\) and \(\mathrm{P}(D \gt 29.0) = 0.10\)

(d) calculate the value of \(\mu\) and the value of \(\sigma\) (5)

June 2024 Paper 3 Q1

EdexcelCurrent spec11 marksBinomial DistributionNormal Distribution

1. Xian rolls a fair die 10 times.

The random variable \(X\) represents the number of times the die lands on a six.

(a) Using a suitable distribution for \(X\), find
(i) \(\mathrm{P}(X = 3)\)
(ii) \(\mathrm{P}(X \lt 3)\) (3)

Xian repeats this experiment each day for 60 days and records the number of days when \(X = 3\)

(b) Find the probability that there were at least 12 days when \(X = 3\) (3)
(c) Find an estimate for the total number of sixes that Xian will roll during these 60 days. (1)
(d) Use a normal approximation to estimate the probability that Xian rolls a total of more than 95 sixes during these 60 days. (4)

June 2025 Paper 3 Q20

AQACurrent spec9 marksLarge Data SetNormal Distribution

20 The oxides of nitrogen emissions, \(F\) g/km, of a car registered in 2000 can be modelled by a normal distribution with mean 0.41 and standard deviation 0.07

(a) Find \(\mathrm{P}(F \lt 0.39)\) [1 mark]
(b) Find \(\mathrm{P}(0.3 \lt F \lt 0.5)\) [1 mark]
(c)
(i) Find \(\mathrm{P}(F \gt 0.6)\) [1 mark]
(ii) Explain why \(\mathrm{P}(F \geqslant 0.6) = \mathrm{P}(F \gt 0.6)\) in this model. [2 marks]
(d) The oxides of nitrogen emissions, \(F\) g/km, of a car in 2010 can be modelled by a normal distribution with mean 0.36 and standard deviation 0.09

Compare the oxides of nitrogen emissions in 2000 with those in 2010.

[2 marks]
(e) A researcher collected data on the oxides of nitrogen emissions from the Large Data Set for cars registered in 2002 and 2016.

The researcher cleaned the data by removing the details for some cars.

Using your knowledge of the Large Data Set, give one reason why the researcher cleaned the data.

[1 mark]
(f) The researcher wished to make a comparison between the oxides of nitrogen emissions for a sample of Nissan cars in their local town from 2016 with the data from all cars registered in the same year in the Large Data Set.

Using your knowledge of the Large Data Set, give one reason why a meaningful comparison could not be made.

[1 mark]

June 2025 Paper 3 Q18

AQACurrent spec10 marksIncludes hypothesis testingNormal Distribution

18 The cholesterol level, \(X\), of an adult can be modelled by a normal distribution with mean 5.7 mmol/l and standard deviation 1.2 mmol/l.

(a) The lower quartile of \(X\) is \(a\) and the upper quartile is \(b\)

It is given that the \(\mathrm{P}(X \leqslant a) = 0.25\) and \(\mathrm{P}(X \geqslant b) = 0.25\)

Find the interquartile range of \(X\)

[4 marks]
(b) A group of scientists believe that a new dietary supplement can reduce the mean cholesterol level.

A random sample of 160 adults were given the new dietary supplement for a trial period of one year.

After the trial, their cholesterol level was found to have a mean of 5.6 mmol/l.

Carry out a hypothesis test at the 5% significance level to investigate whether the mean cholesterol level has reduced after taking the dietary supplement.

It can be assumed that the cholesterol level after taking the dietary supplement follows a normal distribution with an unchanged variance.

[6 marks]

June 2025 Paper 3 Q14

AQACurrent spec1 markNormal Distribution

14 It is given that \(X \sim \mathrm{N}(9, 1.5^2)\) and \(\mathrm{P}(a \leqslant X \leqslant b) \approx 95\%\)

Identify the correct pair of values of \(a\) and \(b\).

Tick (✓) one box. [1 mark]

  • \(a = 4.5\) and \(b = 13.5\)
  • \(a = 6\) and \(b = 12\)
  • \(a = 7\) and \(b = 11\)
  • \(a = 7.5\) and \(b = 10.5\)

June 2024 Paper 3 Q17

AQACurrent spec14 marksIncludes hypothesis testingNormal Distribution

17 In 2019, the lengths of new-born babies at a clinic can be modelled by a normal distribution with mean 50 cm and standard deviation 4 cm.

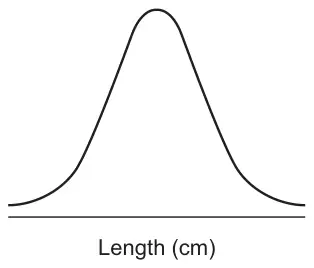
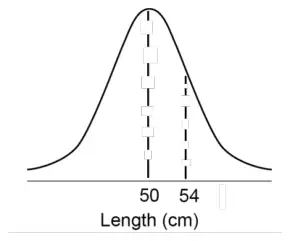
(a) This normal distribution is represented in the diagram below.

Label the values 50 and 54 on the horizontal axis. [2 marks]

A normal distribution curve above a horizontal axis labelled Length (cm), with no values marked
(b) State the probability that the length of a new-born baby is less than 50 cm. [1 mark]
(c) Find the probability that the length of a new-born baby is more than 56 cm. [1 mark]
(d) Find the probability that the length of a new-born baby is more than 40 cm but less than 60 cm. [1 mark]
(e) Determine the length exceeded by 95% of all new-born babies at the clinic. [2 marks]
(f) In 2020, the lengths of 40 new-born babies at the clinic were selected at random.

The total length of the 40 new-born babies was 2060 cm.

Carry out a hypothesis test at the 10% significance level to investigate whether the mean length of a new-born baby at the clinic in 2020 has increased compared to 2019.

You may assume that the length of a new-born baby is still normally distributed with standard deviation 4 cm. [7 marks]

June 2023 Paper 3 Q16

AQACurrent spec9 marksNormal Distribution

16 A farm supplies apples to a supermarket.

The diameters of the apples, \(D\) centimetres, are normally distributed with mean 6.5 and standard deviation 0.73

(a)
(i) Find \(\mathrm{P}(D \lt 5.2)\) [1 mark]
(ii) Find \(\mathrm{P}(D \gt 7)\) [1 mark]
(iii) The supermarket only accepts apples with diameters between 5 cm and 8 cm.

Find the proportion of apples that the supermarket accepts. [1 mark]

(b) The farm also supplies plums to the supermarket.

These plums have diameters that are normally distributed.

It is found that 60% of these plums have a diameter less than 5.9 cm.

It is found that 20% of these plums have a diameter greater than 6.1 cm.

Find the mean and standard deviation of the diameter, in centimetres, of the plums supplied by the farm. [6 marks]

June 2023 Paper 3 Q14

AQACurrent spec10 marksIncludes hypothesis testingNormal Distribution

14 The mass of aluminium cans recycled each day in a city may be modelled by a normal distribution with mean 24 500 kg and standard deviation 5 200 kg.

(a) State the probability that the mass of aluminium cans recycled on any given day is not equal to 24 500 kg. [1 mark]
(b) To reduce costs, the city’s council decides to collect aluminium cans for recycling less frequently.

Following the decision, it was found that over a 24-day period a total mass of 641 520 kg of aluminium cans was recycled.

It can be assumed that the distribution of the mass of aluminium cans recycled is still normal with standard deviation 5 200 kg, and that the 24-day period can be regarded as a random sample.

Investigate, at the 5% level of significance, whether the mean daily mass of aluminium cans recycled has changed. [7 marks]

(c) A member of the council claims that if a different sample of 24 days had been used the hypothesis test in part (b) would have given the same result.

Comment on the validity of this claim. [2 marks]

June 2022 Paper 3 Q18

AQACurrent spec11 marksData ProcessingNormal Distribution

18 In a particular year, the height of a male athlete at the Summer Olympics has a mean 1.78 metres and standard deviation 0.23 metres.

The heights of 95% of male athletes are between 1.33 metres and 2.22 metres.

(a) Comment on whether a normal distribution may be suitable to model the height of a male athlete at the Summer Olympics in this particular year. [3 marks]
(b) You may assume that the height of a male athlete at the Summer Olympics may be modelled by a normal distribution with mean 1.78 metres and standard deviation 0.23 metres.
(i) Find the probability that the height of a randomly selected male athlete is 1.82 metres. [1 mark]
(ii) Find the probability that the height of a randomly selected male athlete is between 1.70 metres and 1.90 metres. [1 mark]
(iii) Two male athletes are chosen at random.

Calculate the probability that both of their heights are between 1.70 metres and 1.90 metres. [1 mark]

(c) The summarised data for the heights, \(h\) metres, of a random sample of 40 male athletes at the Winter Olympics is given below.\[\sum h = 69.2 \qquad \sum (h - \bar{h})^2 = 2.81\]

Use this data to calculate estimates of the mean and standard deviation of the heights of male athletes at the Winter Olympics. [3 marks]

(d) Using your answers from part (c), compare the heights of male athletes at the Summer Olympics and male athletes at the Winter Olympics. [2 marks]

June 2022 Paper 3 Q17

AQACurrent spec6 marksIncludes hypothesis testingNormal Distribution

17 The number of working hours per week of employees in a company is modelled by a normal distribution with mean of 34 hours and a standard deviation of 4.5 hours.

The manager claims that the mean working hours per week of the company’s employees has increased.

A random sample of 30 employees in the company was found to have mean working hours per week of 36.2 hours.

Carry out a hypothesis test at the 2.5% significance level to investigate the manager’s claim. [6 marks]

June 2025 Paper 2 Q14

OCR ACurrent spec9 marksIncludes hypothesis testingNormal Distribution

14 The masses of stones on a certain beach are normally distributed with mean 0.36 kg and standard deviation 0.12 kg.

(a) Find the probability that two stones chosen at random from this beach both have masses between 0.3 kg and 0.4 kg. [2]
(b) Determine the probability that the mean mass of a random sample of 40 stones from this beach is less than 0.32 kg. [2]

Some geologists suspect that the mean mass, \(\mu\) kg, of stones on a second beach is different from the mean for the first beach. They carry out a hypothesis test, at the 5% significance level, of the null hypothesis \(\mu = 0.36\) against the alternative hypothesis \(\mu \neq 0.36\).

They weigh each of a random sample of 40 stones on the second beach and find the sample mean, \(\bar{X}\) kg, of their masses. You may assume that the standard deviation of the masses of stones on the second beach is 0.12 kg.

(c) Determine the range of values of \(\bar{X}\) for which the null hypothesis would not be rejected. [5]

June 2025 Paper 2 Q10

10

(a) The random variable \(W\) has the distribution \(\mathrm{B}\left(12, \frac{1}{3}\right)\).

Find \(\mathrm{P}(W \geqslant 7)\). [2]
(b) The random variable \(X\) has the distribution \(\mathrm{N}\left(45, 4^2\right)\).

Find \(\mathrm{P}(X \gt 50)\). [1]
(c) The random variable \(Y\) has the distribution \(\mathrm{N}\left(25, \sigma^2\right)\).

Given that \(\mathrm{P}(Y \lt 30) = 0.75\), find \(\sigma\). [2]

June 2024 Paper 2 Q13

OCR ACurrent spec5 marksIncludes hypothesis testingBinomial DistributionNormal Distribution

13 At an election last year, 20% of voters in Aytown voted for the Now Party. A researcher plans to test whether the proportion of voters in Aytown who support the Now Party this year is greater than 0.2. The hypotheses for the test will be \(\mathrm{H}_0: p = 0.2\) and \(\mathrm{H}_1: p \gt 0.2\).

The researcher surveys a random sample of 200 voters in Aytown and notes the number \(X\) who say they support the Now Party.

The random variable \(Y\) has a normal distribution which is a good approximation to the distribution of \(X\) when the null hypothesis is correct.

The significance level of the test is 5%.

(a) Find the value of \(y\) such that \(\mathrm{P}(Y \gt y) = 0.05\). [2]
(b) Use your answer to part (a) to determine the smallest value of \(X\) that would result in rejecting the null hypothesis. [3]

June 2024 Paper 2 Q9

OCR ACurrent spec8 marksNormal Distribution

9

(a) The masses, \(M\) grams, of bags of flour are modelled by the distribution \(\mathrm{N}(1002, 2.25)\).
Find \(\mathrm{P}(1000 \lt M \lt 1005)\). [1]
(b) The masses, in grams, of bags of sugar are modelled by the distribution \(\mathrm{N}(\mu, \sigma^2)\).
You are given that 20% of bags have masses greater than 502 g and 30% of bags have masses less than 499 g.
Determine the values of \(\mu\) and \(\sigma\). Give your answers correct to 2 decimal places. [5]
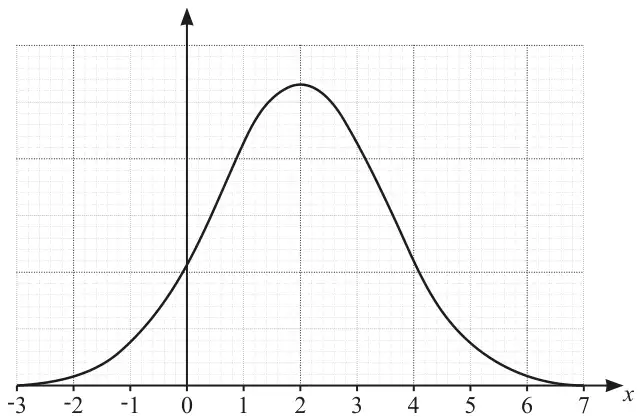
(c) The diagram shows the probability distribution of a normal variable, \(X\).
Bell-shaped normal curve on a grid with x from -3 to 7, symmetrical about x = 2, peak at x = 2
(i) Write down estimates of the \(x\)-coordinates of the points of inflection on the graph. [1]
(ii) Hence write down an estimate of the standard deviation of \(X\), explaining your method. [1]

June 2023 Paper 2 Q11

OCR ACurrent spec9 marksNormal Distribution

11 The random variable \(Y\) has the distribution \(\mathrm{N}(\mu, \sigma^2)\).

(a) Find \(\mathrm{P}(Y \gt \mu - \sigma)\). [1]
(b) Given that \(\mathrm{P}(Y \gt 45) = 0.2\) and \(\mathrm{P}(Y \lt 25) = 0.3\), determine the values of \(\mu\) and \(\sigma\). [6]

The random variables \(U\) and \(V\) have the distributions N(10, 4) and N(12, 9) respectively.

(c) It is given that \(\mathrm{P}(U \lt b) = \mathrm{P}(V \gt c)\), where \(b \gt 10\) and \(c \lt 12\).
Determine \(b\) in terms of \(c\). [2]

June 2023 Paper 2 Q10

OCR ACurrent spec8 marksIncludes hypothesis testingNormal Distribution

10 The mass, in kilograms, of a species of fish in the UK has population mean 4.2 and standard deviation 0.25.

An environmentalist believes that the fish in a particular river are smaller, on average, than those in other rivers in the UK.

A random sample of 100 fish of this species, taken from the river, has sample mean 4.16 kg.

Stating a necessary assumption, test at the 5% significance level whether the environmentalist is correct. [8]

June 2022 Paper 2 Q11

OCR ACurrent spec7 marksIncludes hypothesis testingNormal Distribution

11 In the past the masses of new-born babies in a certain country were normally distributed with mean 3300 g. Last year a publicity campaign was held to encourage pregnant women to improve their diet.

Following this campaign, it is required to test whether the mean mass of new-born babies has increased. A random sample of 200 new-born babies is chosen, and it is found that their mean mass is 3360 g. It is given that the standard deviation of the masses of new-born babies is 450 g.

Carry out the test at the 2.5% significance level. [7]

June 2022 Paper 2 Q9

OCR ACurrent spec14 marksData ProcessingNormal Distribution

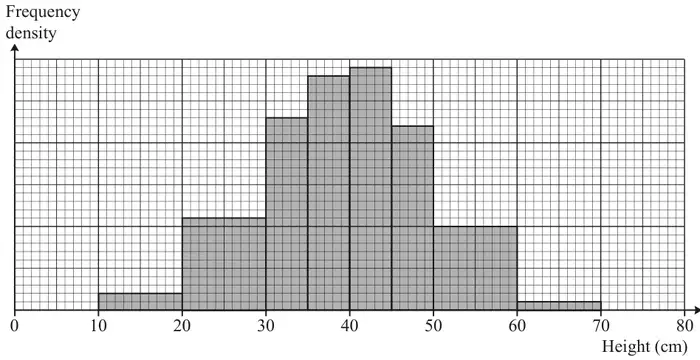
9 The heights, in centimetres, of a random sample of 150 plants of a certain variety were measured. The results are summarised in the histogram.

Histogram of frequency density against height in cm from 0 to 80, with bars for 10 to 20, 20 to 30, 30 to 35, 35 to 40, 40 to 45, 45 to 50, 50 to 60 and 60 to 70; the tallest bars are 35 to 40 and 40 to 45

One of the 150 plants is chosen at random, and its height, \(X\) cm, is noted.

(a) Show that \(\mathrm{P}(20 \lt X \lt 30) = 0.147\), correct to 3 significant figures. [2]

Sam suggests that the distribution of \(X\) can be well modelled by the distribution \(\mathrm{N}(40, 100)\).

(b)
(i) Give a brief justification for the use of the normal distribution in this context. [1]
(ii) Give a brief justification for the choice of the parameter values 40 and 100. [2]
(c) Use Sam’s model to find \(\mathrm{P}(20 \lt X \lt 30)\). [1]

Nina suggests a different model. She uses the midpoints of the classes to calculate estimates, \(m\) and \(s\), for the mean and standard deviation respectively, in centimetres, of the 150 heights. She then uses the distribution \(\mathrm{N}(m, s^2)\) as her model.

(d) Use Nina’s model to find \(\mathrm{P}(20 \lt X \lt 30)\). [4]
(e)
(i) Complete the table in the Printed Answer Booklet to show the probabilities obtained from Sam’s model and Nina’s model. [2]
\(x\)< 2020 to 3030 to 3535 to 4040 to 4545 to 5050 to 60> 60
Histogram0.0270.1470.1530.1870.1930.1470.1330.013
\(\mathrm{N}(40, 100)\)0.0230.1500.1910.1360.023
\(\mathrm{N}(m, s^2)\)0.0300.1530.1890.1300.023
(ii) By considering the different ranges of values of \(X\) given in the table, discuss how well the two models fit the original distribution. [2]

October 2021 Paper 2 Q11

OCR ACurrent spec12 marksIncludes hypothesis testingIncludes samplingData ProcessingNormal Distribution

11 Zac is planning to write a report on the music preferences of the students at his college. There is a large number of students at the college.

(a) State one reason why Zac might wish to obtain information from a sample of students, rather than from all the students. [1]
(b) Amaya suggests that Zac should use a sample that is stratified by school year.
Give one advantage of this method as compared with random sampling, in this context. [1]

Zac decides to take a random sample of 60 students from his college. He asks each student how many hours per week, on average, they spend listening to music during term. From his results he calculates the following statistics.

MeanStandard deviationMedianLower quartileUpper quartile
21.04.2020.518.022.9
(c) Sundip tells Zac that, during term, she spends on average 30 hours per week listening to music.
Discuss briefly whether this value should be considered an outlier. [3]
(d) Layla claims that, during term, each student spends on average 20 hours per week listening to music. Zac believes that the true figure is higher than 20 hours. He uses his results to carry out a hypothesis test at the 5% significance level.
Assume that the time spent listening to music is normally distributed with standard deviation 4.20 hours.
Carry out the test. [7]

June 2025 Paper 2 Q17

OCR MEICurrent spec9 marksIncludes hypothesis testingNormal Distribution

17 In this question you must show detailed reasoning

Jars of honey contain a nominal mass of 340 grams of honey.

The jars are filled by an automated process so that the actual mass of honey in a jar, \(X\) grams, is Normally distributed with mean 350 grams. This is to minimize the chance of a jar which contains less than 340 grams of honey being sold.

During a quality control check, a random sample of 50 jars of honey are checked.

Summary statistics for the check are as follows.

\(\sum x = 17\,367 \qquad \sum x^2 = 6\,036\,597 \qquad n = 50\)

Carry out a hypothesis test at the 1% level to see if there is any evidence to suggest that the mean mass of honey in the jars is less than 350 grams. [9]

June 2024 Paper 2 Q15

OCR MEICurrent spec17 marksIncludes hypothesis testingData ProcessingNormal Distribution

15 Bottles of Fizzipop nominally contain 330 ml of drink. A consumer affairs researcher collects a random sample of 55 bottles of Fizzipop and records the volume of drink in each bottle.

Summary statistics for the researcher’s sample are shown in the table.

\(n\)55
\(\sum x\)18 535
\(\sum x^2\)6 247 066.6
(a)
(i) Calculate the mean volume of drink in a bottle of Fizzipop. [1]
(ii) Show that the standard deviation of the volume of drink in a bottle of Fizzipop is 3.78 ml. [1]

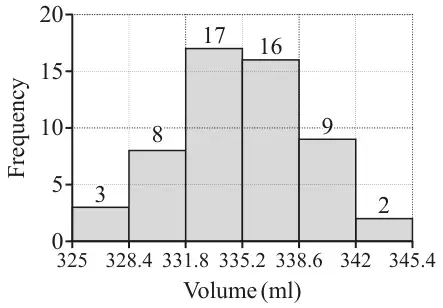
The researcher uses software to produce a histogram with equal class intervals, which is shown below.

Histogram of volume in ml with equal class widths of 3.4 from 325 to 345.4; frequencies 3, 8, 17, 16, 9, 2
(b) Explain why the researcher decides that the Normal distribution is a suitable model for the volume of drink in a bottle of Fizzipop. [2]
(c) Use your answers to parts (a) and (b) to determine the expected number of bottles which contain less than 330 ml in a random sample of 100 bottles. [3]

In order to comply with new regulations, no more than 1% of bottles of Fizzipop should contain less than 330 ml.

The manufacturer decides to meet the new regulations by adjusting the manufacturing process so that the mean volume of drink in a bottle of Fizzipop is increased.

The standard deviation is unaltered.

(d) Determine the minimum mean volume of drink in a bottle of Fizzipop which should ensure that the new regulations are met. Give your answer to 3 significant figures. [3]

The mean volume of drink in a bottle of Fizzipop is set to 340 ml. After several weeks the quality control manager suspects the mean volume may have reduced. She collects a random sample of 100 bottles of Fizzipop.

The mean volume of drink in a bottle in the sample is found to be 339.37 ml.

(e) Assuming the standard deviation is unaltered, conduct a hypothesis test at the 5% level to determine whether there is any evidence to suggest that the mean volume of drink in a bottle of Fizzipop is less than 340 ml. [7]

June 2023 Paper 2 Q18

OCR MEICurrent spec11 marksData ProcessingNormal Distribution

18 Riley is investigating the daily water consumption, in litres, of his household.
He records the amount used for a random sample of 120 days from the previous twelve-month period.

The daily water consumption, in litres, is denoted by \(x\).

Summary statistics for Riley’s sample are given below.

\(\sum x = 31164.7 \quad \sum x^2 = 8\,101\,050.91 \quad n = 120\)

(a) Calculate the sample mean giving your answer correct to 3 significant figures. [1]

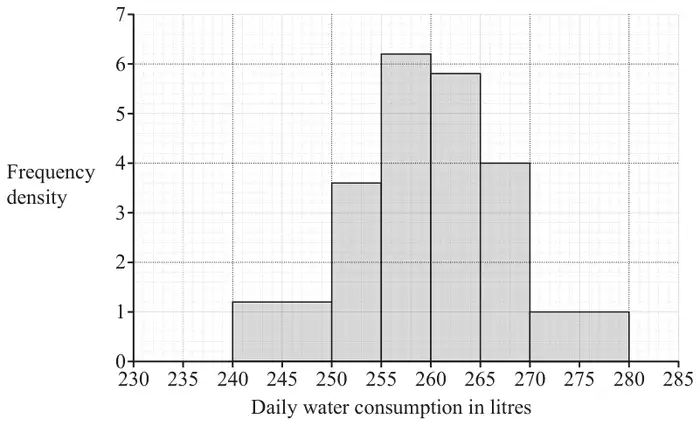
Riley displays the data in a histogram.

Histogram of daily water consumption in litres (230 to 285) with frequency density: 240–250 at 1.2, 250–255 at 3.6, 255–260 at 6.2, 260–265 at 5.8, 265–270 at 4, 270–280 at 1
(b) Find the number of days on which between 255 and 260 litres were used. [1]
(c) Give two reasons why a Normal distribution may be an appropriate model for the daily consumption of water. [2]

Riley uses the sample mean and the sample variance, both correct to 3 significant figures, as parameters of a Normal distribution to model the daily consumption of water.

(d) Use Riley’s model to calculate the probability that on a randomly chosen day the household uses less than 255 litres of water. [2]
(e) Calculate the probability that the household uses less than 255 litres of water on at least 5 days out of a random sample of 28 days. [2]

The company which supplies the water makes charges relating to water consumption which are shown in the table below.

Standing charge per day in pence7.8
Charge per litre in pence0.18
(f) Adapt Riley’s model for daily water consumption to model the daily charges for water consumption. [3]

June 2023 Paper 2 Q13

OCR MEICurrent spec9 marksIncludes hypothesis testingNormal Distribution

13 A large supermarket chain advertises that the mean mass of apples of a certain variety on sale in their stores is 0.14 kg.

Following a poor growing season, the head of quality control believes that the mean mass of these apples is less than 0.14 kg and she decides to carry out a hypothesis test at the 5% level of significance.

She collects a random sample of this variety of apple from the supermarket chain and records the mass, in kg, of each apple. She uses software to analyse the data. The results are summarised in the output below.

n80
Mean0.1316
\(\sigma\)0.0198
s0.0199
\(\Sigma x\)10.525
\(\Sigma x^2\)1.4161
Min0.1
Q10.12
Median0.132
Q30.1435
Max0.19
(a) State the null hypothesis and the alternative hypothesis for the test, defining the parameter used. [2]
(b) Write down the distribution of the sample mean for this hypothesis test. [2]
(c) Determine the critical region for the test. [2]
(d) Carry out the test, giving your conclusion in context. [3]

June 2022 Paper 2 Q12

OCR MEICurrent spec8 marksIncludes hypothesis testingNormal Distribution

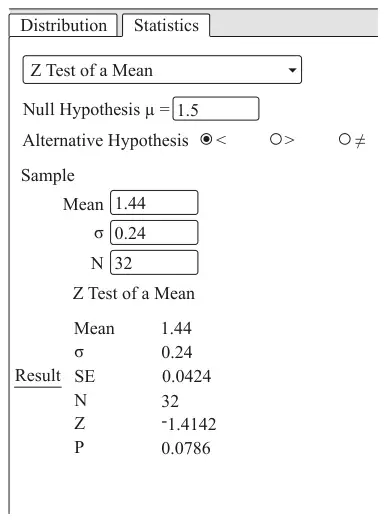
12 A retailer sells bags of flour which are advertised as containing 1.5 kg of flour. A trading standards officer is investigating whether there is enough flour in each bag. He collects a random sample and uses software to carry out a hypothesis test at the 5% level. The analysis is shown in the software printout below.

Software printout, Z Test of a Mean: null hypothesis μ = 1.5, alternative hypothesis μ < 1.5; sample mean 1.44, σ 0.24, N 32. Result: Mean 1.44, σ 0.24, SE 0.0424, N 32, Z −1.4142, P 0.0786
(a) State the hypotheses the officer uses in the test, defining any parameters used. [2]
(b) State the distribution used in the analysis. [3]
(c) Carry out the hypothesis test, giving your conclusion in context. [3]

June 2022 Paper 2 Q9

OCR MEICurrent spec9 marksData ProcessingNormal Distribution

9 At the beginning of the academic year, all the pupils in year 12 at a college take part in an assessment. Summary statistics for the marks obtained by the 2021 cohort are given below.

\(n = 205\quad \sum x = 23\,042\quad \sum x^2 = 2\,591\,716\)

Marks may only be whole numbers, but the Head of Mathematics believes that the distribution of marks may be modelled by a Normal distribution.

(a) Calculate
  • The mean mark
  • The variance of the marks
[2]
(b) Use your answers to part (a) to write down a possible Normal model for the distribution of marks. [2]

One candidate in the cohort scored less than 105.

(c) Determine whether the model found in part (b) is consistent with this information. [3]
(d) Use the model to calculate an estimate of the number of candidates who scored 115 marks. [2]

June 2022 Paper 2 Q6

OCR MEICurrent spec2 marksNormal Distribution

6 \(X\) is a continuous random variable such that \(X \sim \mathrm{N}(\mu, \sigma^2)\).

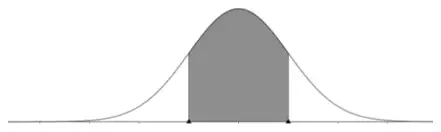
On the sketch of this Normal distribution in the Printed Answer Booklet, shade the area bounded by the curve, the \(x\)-axis and the lines \(x = \mu \pm \sigma\). [2]

October 2021 Paper 2 Q11

OCR MEICurrent spec8 marksIncludes hypothesis testingNormal Distribution

11 In 2010 the heights of adult women in the UK were found to have mean \(\mu = 161.6\) cm and variance \(\sigma^2 = 1.96\,\text{cm}^2\).

It is believed that the mean height of adult women in 2020 in the UK is greater than in 2010.

In 2020 a researcher collected a random sample of the heights of 200 adult women in the UK.

The researcher calculated the sample mean height and carried out a hypothesis test at the 5% level to investigate whether there was any evidence to suggest that the mean height of adult women in the UK had increased.

The researcher assumed that the variance was unaltered.

(a)
  • State suitable hypotheses for the test, defining any variables you use.
  • Explain whether the researcher conducted a 1-tail or a 2-tail test.
[3]
(b) Determine the critical region for the test. [2]

The researcher found that the sample mean was 161.9 cm and made the following statements.

  • The sample mean is in the critical region.
  • The null hypothesis is accepted.
  • This proves that the mean height of adult women in the UK is unaltered at 161.6 cm.
(c) Explain whether each of these statements is correct. [3]

October 2021 Paper 2 Q8

OCR MEICurrent spec4 marksNormal Distribution

8 The Normal variable \(X\) is transformed to the Normal variable \(Y\).

The transformation is \(y = a + bx\), where \(a\) and \(b\) are positive constants.

You are given that \(X \sim N(42, 6.8)\) and \(Y \sim N(57.2, 11.492)\).

Determine the values of \(a\) and \(b\). [4]

October 2020 Paper 2 Q9

OCR MEICurrent spec9 marksIncludes hypothesis testingIncludes samplingData ProcessingNormal Distribution

9 A company supplies computers to businesses. In the past the company has found that computers are kept by businesses for a mean time of 5 years before being replaced. Claud, the manager of the company, thinks that the mean time before replacing computers is now different.

(a) Describe how Claud could obtain a cluster sample of 120 computers used by businesses the company supplies. [1]

Claud decides to conduct a hypothesis test at the 5% level to test whether there is evidence to suggest that the mean time that businesses keep computers is not 5 years. He takes a random sample of 120 computers. Summary statistics for the length of time computers in this sample are kept are shown in Fig. 9.

Statistics
n120
Mean4.8855
σ2.6941
s2.7054
Σx586.2566
Σx23735.1475
Min0.1213
Q12.5472
Median4.8692
Q37.0349
Max9.9856

Fig. 9

(b) In this question you must show detailed reasoning.
  • State the hypotheses for this test, explaining why the alternative hypothesis takes the form it does.
  • Use a suitable distribution to carry out the test.
[8]

October 2020 Paper 2 Q8

OCR MEICurrent spec12 marksIncludes samplingData ProcessingNormal Distribution

8 Rosella is carrying out an investigation into the age at which adults retire from work in the city where she lives. She collects a sample of size 50, ensuring this comprises of 25 randomly selected retired men and 25 randomly selected retired women.

(a) State the name of the sampling method she uses. [1]

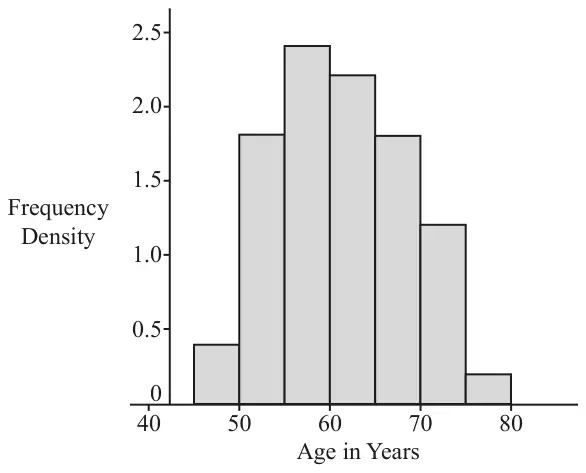
Fig. 8.1 shows the data she obtains in a frequency table and Fig. 8.2 shows these data displayed in a histogram.

Age in years at retirement45 –50 –55 –60 –65 –70 –75 – 80
Frequency density0.41.82.42.21.81.20.2

Fig. 8.1

Fig. 8.2: histogram of frequency density against age in years, bars from 45 to 80 with heights 0.4, 1.8, 2.4, 2.2, 1.8, 1.2, 0.2
Fig. 8.2
(b) How many people in the sample are aged between 50 and 55? [1]

Rosella obtains a list of the names of all 4960 people who have retired in the city during the previous month.

(c) Describe how Rosella could collect a sample of size 200 from her list using
  • systematic sampling such that every item on the list could be selected,
  • simple random sampling.
[4]

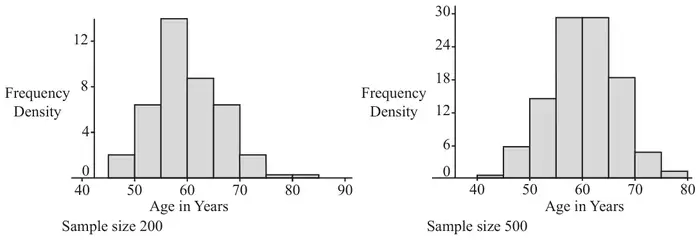
Rosella collects two simple random samples, one of size 200 and one of size 500, from her list. The histograms in Fig. 8.3 show the data from the sample of size 200 on the left and the data from the sample of 500 on the right.

Fig. 8.3: two histograms of frequency density against age in years, for the sample of size 200 (ages 45 to 85) and the sample of size 500 (ages 40 to 80); both are roughly symmetrical and bell-shaped, peaking between 55 and 65
Fig. 8.3
(d) With reference to the histograms shown in Fig. 8.2 and Fig. 8.3, explain why it appears reasonable to model the age of retirement in this city using the Normal distribution. [1]

Summary statistics for the sample of 500 are shown in Fig. 8.4.

Statistics
n500
Mean60.0515
σ6.5717
s6.5783
Σx30025.7601
Σx21824686.322
Min36.0793
Q155.2573
Median59.9202
Q364.4239
Max81.742

Fig. 8.4

(e) Use an appropriate Normal model based on the information in Fig. 8.4 to estimate the number of people aged over 65 who retired in the city in the previous month. [4]
(f) Identify a limitation in using this model to predict the number of people aged over 65 retiring in the following month. [1]