
June 2023 Paper 2 Q18
18 Riley is investigating the daily water consumption, in litres, of his household.
He records the amount used for a random sample of 120 days from the previous twelve-month period.
The daily water consumption, in litres, is denoted by \(x\).
Summary statistics for Riley’s sample are given below.
\(\sum x = 31164.7 \quad \sum x^2 = 8\,101\,050.91 \quad n = 120\)
Riley displays the data in a histogram.
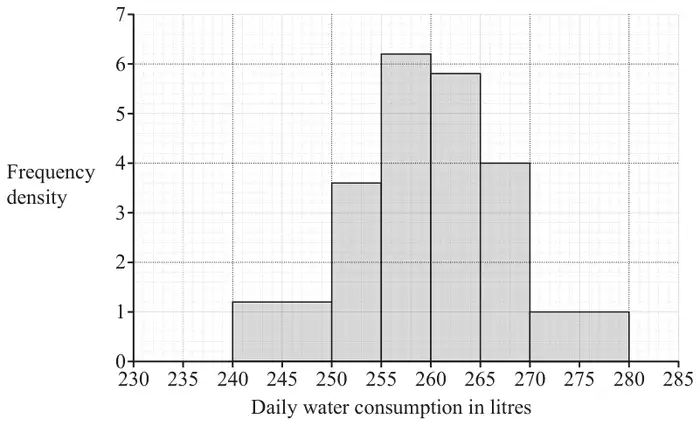
Riley uses the sample mean and the sample variance, both correct to 3 significant figures, as parameters of a Normal distribution to model the daily consumption of water.
The company which supplies the water makes charges relating to water consumption which are shown in the table below.
| Standing charge per day in pence | 7.8 |
| Charge per litre in pence | 0.18 |
| Scheme | Marks | AO |
|---|---|---|
| 260 cao | B1 | 1.1 |
| [1] |
| Scheme | Marks | AO |
|---|---|---|
| 31 cao | B1 | 1.1 |
| [1] |
Notes
B1: mark the final answer
| Scheme | Marks | AO |
|---|---|---|
| any 2 distinct reasons eg (approximately) symmetrical (about the mean) | B1 | 3.5a |
| eg approximately bell-shaped / unimodal eg data is continuous | B1 | 3.5a |
| [2] |
Notes
B1: ignore extra comments unless they contradict an otherwise correct answer
| Scheme | Marks | AO |
|---|---|---|
| [variance is] awrt 62.2 or [sd is] 7.89 seen BC | M1 | 3.3 |
| \(0.26287 - 0.263134\) or 0.26 | A1 | 3.4 |
| [2] |
Notes
M1: NB 62.15567…may be implied by sd = 7.88 or 7.89
NB 0.263047…from \(\sqrt{62.2}\) or 0.263133… from 7.89
NB 0.262871… from 7.88, 0.262973…from unrounded sd
A1: allow B2 for correct answer unsupported
| Scheme | Marks | AO |
|---|---|---|
| B(28, \(p\)) used, where \(p\) is value calculated in (d) | M1 | 3.1a |
| \(0.888 \leqslant p < 0.896\) | A1 | 1.1 |
| [2] |
Notes
A1: may be given to 2 sf; allow B2 for correct answer unsupported
| Scheme | Marks | AO |
|---|---|---|
| \(7.8 + 0.18 \times 260\) | M1 | 3.1a |
| \(0.18^2 \times 62.2\) oe | M1 | 3.5c |
| \(\mathrm{N}(54.6,\ 2.0138 - 2.02)\) | A1 | 1.1 |
| [3] |
Notes
M1: or \(0.18 \times \sqrt{62.2}\)
A1: allow eg \(1.42^2\) for variance