
June 2024 Paper 2 Q3
3 The histogram shows the amount spent on electricity in pounds in a sample of households in March 2023.
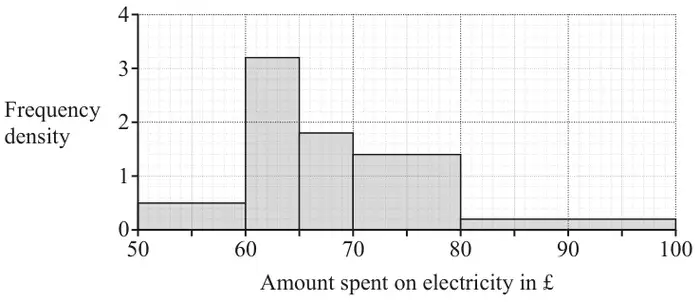
(a) Describe the shape of the distribution. [1]
A total of 16 households each spent between £60 and £65 on electricity.
(b) Determine how many households were in the sample altogether. [2]
| Scheme | Marks | AO |
|---|---|---|
| positively skewed | B1 | 1.2 |
| [1] |
| Scheme | Marks | AO |
|---|---|---|
| \(10 \times 0.5 + 5 \times 3.2 + 5 \times 1.8 + 10 \times 1.4 + 20 \times 0.2\) oe | M1 | 1.1 |
| 48 | A1 | |
| [2] |
Notes
M1: allow 1 incorrect class width or one incorrect frequency density
may be implied by 5 + 16 + 9 + 14 + 4;
A1: allow SCB1 for correct answer unsupported