
June 2024 Paper 3 Q17
17 In 2019, the lengths of new-born babies at a clinic can be modelled by a normal distribution with mean 50 cm and standard deviation 4 cm.
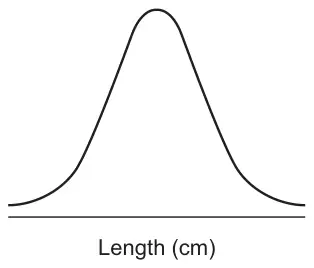
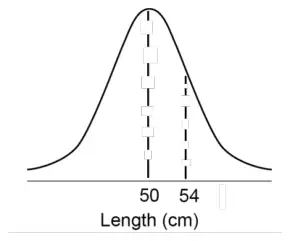
Label the values 50 and 54 on the horizontal axis. [2 marks]
The total length of the 40 new-born babies was 2060 cm.
Carry out a hypothesis test at the 10% significance level to investigate whether the mean length of a new-born baby at the clinic in 2020 has increased compared to 2019.
You may assume that the length of a new-born baby is still normally distributed with standard deviation 4 cm. [7 marks]
| Scheme | Marks | AO |
|---|---|---|
| Labels 50 on the horizontal axis below the vertex Condone label at the vertex | B1 | 3.3 |
| Labels 54 on the horizontal axis below the right-hand point of inflection Condone label at the right-hand point of inflection | B1 | 3.3 |
| (2) |
Typical solution
| Scheme | Marks | AO |
|---|---|---|
| States 0.5 | B1 | 1.2 |
| (1) |
Typical solution
0.5
| Scheme | Marks | AO |
|---|---|---|
| Obtains AWFW [0.0668, 0.067] | B1 | 1.1b |
| (1) |
Typical solution
0.0668
| Scheme | Marks | AO |
|---|---|---|
| Obtains AWFW [0.987, 0.99] | B1 | 1.1b |
| (1) |
Typical solution
0.9876
| Scheme | Marks | AO |
|---|---|---|
| Forms \(\dfrac{x - 50}{4} = -1.6449\) or forms \(50 + 4 \times (-1.6449)\) PI by correct answer or AWFW [56.56, 56.6] cm or 57 cm Allow [−4, 4] except ±0.95 or ±0.05 or 0 for −1.6449 | M1 | 3.1b |
| Obtains AWFW [43.4, 43.44] cm or 43 cm Condone missing units | A1 | 1.1b |
| (2) |
Typical solution
\[\frac{x - 50}{4} = -1.6449\]Minimum length is 43.4 cm
| Scheme | Marks | AO |
|---|---|---|
| States \(\mathrm{H_0}: \mu = 50\) \(\mathrm{H_1}: \mu \gt 50\) | B1 | 2.5 |
| Obtains 51.5 OE | B1 | 1.1b |
| States or uses correct model PI by normal with mean 50 and variance \(\dfrac{4^2}{40}\) or 0.4 or standard deviation \(\sqrt{0.4}\) or 0.63 or better OE or by correct probability AWFW [0.0086, 0.009] or test statistic \((\pm)\dfrac{51.5 - 50}{\frac{4}{\sqrt{40}}}\) FT their 51.5 for test statistic or test statistic value AWFW (±)[2.37, 2.4] or critical value AWFW [50.8, 51] | M1 | 1.1a |
| Obtains AWFW [0.0086, 0.009] or the correct value of the test statistic AWFW [2.37, 2.4] or acceptance region \(\leqslant\) AWFW [50.8, 51] allow strict inequality or critical region \(\geqslant\) AWFW [50.8, 51] allow strict inequality or critical value AWFW [50.8, 51] | A1 | 1.1b |
| Correctly compares their value of \(P\)(\(\gt\) or \(\geqslant\) their sample mean) with 0.1 or correctly compares their positive test statistic with AWFW [1.28, 1.282] or correctly compares 51.5 with their acceptance region or critical region or critical value FT their sample mean May be seen on a diagram | M1 | 3.5a |
| Infers \(\mathrm{H_0}\) rejected FT their comparison Condone accept \(\mathrm{H_1}\) | A1F | 2.2b |
| Concludes, from a fully correct comparison, in context by referring to an increase in the mean length of new-born baby at the clinic. Conclusion must not be definite, eg use of ‘suggest’, ‘support’ etc To be awarded R1, marks B0B1M1A1M1A1 must be scored as the minimum | R1 | 3.2a |
| (7) | ||
| (14 marks) |
Typical solution
\(X\) = length of new-born baby
\[\mathrm{H_0}: \mu = 50\]\[\mathrm{H_1}: \mu \gt 50\]\[\bar{x} = 51.5\]\[\bar{X} \sim \mathrm{N}\left(50, \frac{4^2}{40}\right)\]\[P\left(\bar{X} \gt 51.5\right) = 0.0089\]\[0.0089 \lt 0.1\]Reject \(\mathrm{H_0}\)
There is sufficient evidence to suggest that the mean length of a new-born baby at the clinic in 2020 has increased compared to 2019.