
October 2020 Paper 2 Q8
8 Rosella is carrying out an investigation into the age at which adults retire from work in the city where she lives. She collects a sample of size 50, ensuring this comprises of 25 randomly selected retired men and 25 randomly selected retired women.
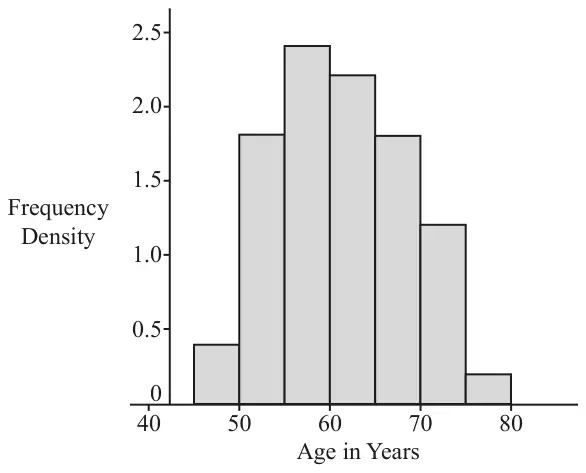
Fig. 8.1 shows the data she obtains in a frequency table and Fig. 8.2 shows these data displayed in a histogram.
| Age in years at retirement | 45 – | 50 – | 55 – | 60 – | 65 – | 70 – | 75 – 80 |
|---|---|---|---|---|---|---|---|
| Frequency density | 0.4 | 1.8 | 2.4 | 2.2 | 1.8 | 1.2 | 0.2 |
Fig. 8.1
Rosella obtains a list of the names of all 4960 people who have retired in the city during the previous month.
- systematic sampling such that every item on the list could be selected,
- simple random sampling.
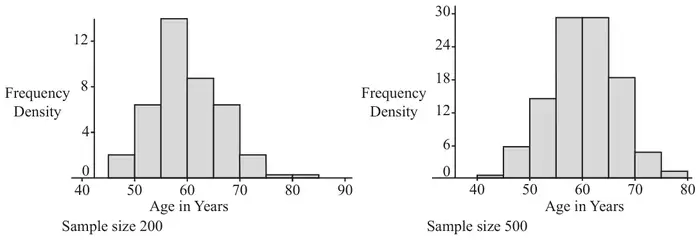
Rosella collects two simple random samples, one of size 200 and one of size 500, from her list. The histograms in Fig. 8.3 show the data from the sample of size 200 on the left and the data from the sample of 500 on the right.
Summary statistics for the sample of 500 are shown in Fig. 8.4.
| Statistics | |
|---|---|
| n | 500 |
| Mean | 60.0515 |
| σ | 6.5717 |
| s | 6.5783 |
| Σx | 30025.7601 |
| Σx2 | 1824686.322 |
| Min | 36.0793 |
| Q1 | 55.2573 |
| Median | 59.9202 |
| Q3 | 64.4239 |
| Max | 81.742 |
Fig. 8.4
| Scheme | Marks | AO |
|---|---|---|
| Quota sampling | B1 | 1.2 |
| [1] |
| Scheme | Marks | AO |
|---|---|---|
| 9 | B1 | 1.1 |
| [1] |
Notes
B1: from \(5 \times 1.8\)
| Scheme | Marks | AO |
|---|---|---|
| Systematic: select every 24th number on the list | M1 | 2.4 |
| start randomly between \(n = 1\) and \(n \geqslant 184\) and stop when 200 have been selected (if \(n > 184\), must cycle through list) | A1 | 1.1 |
| Simple random sampling: assign each item in the list a unique number (eg from 1 to 4960) | E1 | 2.4 |
| generate random numbers until a sample of 200 has been selected soi | E1 | 1.1 |
| [4] |
Notes
M1: alternatively select every 25th number on the list
alternatively select every 24.8th value on list, rounding as appropriate
A1: alternatively start randomly between \(n = 1\) and \(n \geqslant 25\), and cycle through the list again, stopping when 200 have been selected
alternatively start randomly with any value on list. Cycle through the list repeatedly until 200 items have been selected
E1: alternatively allow any process where each member of the population has an equal chance of being selected
E1: allow any process where each possible sample has an equal chance of being selected
| Scheme | Marks | AO |
|---|---|---|
| as the size of the sample increases, the shape of the distribution appears more and more “Normal” oe | B1 | 2.4 |
| [1] |
Notes
B1: must refer to shape and closer to Normal shape for larger sample
| Scheme | Marks | AO |
|---|---|---|
| use of \(\mathrm{N}(60.0515,\ 6.5783^2)\) to find \(\mathrm{P}(X > 65)\) | M1 | 3.3 |
| awrt 0.23 | A1 | 3.4 |
| \(4960 \times\) their 0.226 | M1 | 3.1b |
| 1121 or 1120 or 1119 | A1 | 3.5a |
| [4] |
Notes
M1: condone use of \(6.5717^2\) or parameters rounded to 3 sf
M0 if continuity correction used or eg \(\mathrm{P}(X > 64)\) found
| Scheme | Marks | AO |
|---|---|---|
| eg there may be seasonal fluctuations such as teachers retiring in August | B1 | 3.5b |
| [1] |
Notes
B1: allow any sensible reason in context
do not allow eg mean and sd may be different