Binomial Distribution

Includes hypothesis testingIncludes sampling

Edexcel

AQA

OCR A

OCR MEI

June 2025 Paper 3 Q3

EdexcelCurrent spec6 marksIncludes hypothesis testingBinomial Distribution

3. A manufacturer makes components for the car industry.

On average 1.5% of the components made are defective.

(a) Using a suitable model, find the probability that in a random sample of 36 components there are
(i) exactly 2 defective components,
(ii) more than 3 defective components. (3)

Once every six months, the manufacturer tests whether the proportion of defective components has changed using hypotheses \(\mathrm{H}_0 : p = 0.015\) and \(\mathrm{H}_1 : p \neq 0.015\)

A random sample of 260 components is taken and 8 are found to be defective.

(b) Using a 5% level of significance, complete the test. (3)

June 2024 Paper 3 Q4

EdexcelCurrent spec6 marksIncludes hypothesis testingBinomial Distribution

4. The proportion of left-handed adults in a country is 10%
Freya believes that the proportion of left-handed adults under the age of 25 in this country is different from 10%
She takes a random sample of 40 adults under the age of 25 from this country to investigate her belief.

(a) Find the critical region for a suitable test to assess Freya’s belief.
You should
  • state your hypotheses clearly
  • use a 5% level of significance
  • state the probability of rejection in each tail
(4)
(b) Write down the actual significance level of your test in part (a) (1)

In Freya’s sample 7 adults were left-handed.

(c) With reference to your answer in part (a) comment on Freya’s belief. (1)

June 2024 Paper 3 Q1

EdexcelCurrent spec11 marksBinomial DistributionNormal Distribution

1. Xian rolls a fair die 10 times.

The random variable \(X\) represents the number of times the die lands on a six.

(a) Using a suitable distribution for \(X\), find
(i) \(\mathrm{P}(X = 3)\)
(ii) \(\mathrm{P}(X \lt 3)\) (3)

Xian repeats this experiment each day for 60 days and records the number of days when \(X = 3\)

(b) Find the probability that there were at least 12 days when \(X = 3\) (3)
(c) Find an estimate for the total number of sixes that Xian will roll during these 60 days. (1)
(d) Use a normal approximation to estimate the probability that Xian rolls a total of more than 95 sixes during these 60 days. (4)

June 2025 Paper 3 Q17

AQACurrent spec7 marksIncludes samplingBinomial DistributionData Processing

17 A maths teacher holds a revision session every Wednesday.

In a random sample of eight Wednesdays, the number of students who attended is listed below.

24314523
(a) Find the mean of these eight values. [1 mark]
(b) Find the variance of these eight values. [1 mark]
(c) The teacher believes that the number of students who attended a revision session each Wednesday can be modelled by the binomial distribution \(\mathrm{B}(30, 0.1)\).

Comment on whether the mean and variance found in parts (a) and (b) support the teacher’s belief.

Fully justify your answer.

[3 marks]
(d) The teacher wanted to decide if a Saturday morning revision session was worth doing.

The teacher asked the first 10 students who entered the classroom if they would attend a Saturday session.

(i) Name this method of sampling. [1 mark]
(ii) Describe one advantage of this method of sampling. [1 mark]

June 2025 Paper 3 Q15

AQACurrent spec5 marksBinomial Distribution

15 The proportion of diners at a restaurant who are vegan is 20%

The number of diners at the restaurant who are vegan can be modelled by a binomial distribution.

(a) In a random sample of 25 diners:
(i) find the probability that no diner is a vegan. [1 mark]
(ii) find the probability that fewer than 6 diners are vegan. [1 mark]
(iii) find the probability that at least 9 diners are vegan. [2 marks]
(b) State one assumption necessary for the binomial distribution to be valid in the context of this question. [1 mark]

June 2024 Paper 3 Q19

AQACurrent spec9 marksIncludes hypothesis testingBinomial DistributionLarge Data Set

19 It is known that 80% of all diesel cars registered in 2017 had carbon monoxide (CO) emissions less than 0.3 g/km.

Talat decides to investigate whether the proportion of diesel cars registered in 2022 with CO emissions less than 0.3 g/km has changed.

Talat will carry out a hypothesis test at the 10% significance level on a random sample of 25 diesel cars registered in 2022.

(a)
(i) State suitable null and alternative hypotheses for Talat’s test. [1 mark]
(ii) Using a 10% level of significance, find the critical region for Talat’s test. [5 marks]
(iii) In his random sample, Talat finds 18 cars with CO emissions less than 0.3 g/km.

State Talat’s conclusion in context. [1 mark]

(b) Talat now wants to use his random sample of 25 diesel cars, registered in 2022, to investigate whether the proportion of diesel cars in England with CO emissions more than 0.5 g/km has changed from the proportion given by the Large Data Set.

Using your knowledge of the Large Data Set, give two reasons why it is not possible for Talat to do this. [2 marks]

June 2024 Paper 3 Q15

AQACurrent spec9 marksBinomial Distribution

15 It is given that

\[X \sim \mathrm{B}(48, 0.175)\]
(a) Find the mean of \(X\) [1 mark]
(b) Show that the variance of \(X\) is 6.93 [1 mark]
(c) Find \(\mathrm{P}(X \lt 10)\) [1 mark]
(d) Find \(\mathrm{P}(X \geqslant 6)\) [2 marks]
(e) Find \(\mathrm{P}(9 \leqslant X \leqslant 15)\) [2 marks]
(f) The aeroplanes used on a particular route have 48 seats.

The proportion of passengers who use this route to travel for business is known to be 17.5%

Make two comments on whether it would be appropriate to use \(X\) to model the number of passengers on an aeroplane who are travelling for business using this route. [2 marks]

June 2023 Paper 3 Q17

AQACurrent spec6 marksIncludes hypothesis testingBinomial Distribution

17 A council found that 70% of its new local businesses made a profit in their first year.

The council introduced an incentive scheme for its residents to encourage the use of new local businesses.

At the end of the scheme, a random sample of 25 new local businesses was selected and it was found that 21 of them had made a profit in their first year.

Using a binomial distribution, investigate, at the 2.5% level of significance, whether there is evidence of an increase in the proportion of new local businesses making a profit in their first year. [6 marks]

June 2023 Paper 3 Q12

AQACurrent spec8 marksBinomial Distribution

12 It is known that, on average, 40% of the drivers who take their driving test at a local test centre pass their driving test.

Each day 32 drivers take their driving test at this centre.

The number of drivers who pass their test on a particular day can be modelled by the distribution \(\mathrm{B}(32, 0.4)\)

(a) State one assumption, in context, required for this distribution to be used. [1 mark]
(b) Find the probability that exactly 7 of the drivers on a particular day pass their test. [1 mark]
(c) Find the probability that, at most, 16 of the drivers on a particular day pass their test. [1 mark]
(d) Find the probability that more than 12 of the drivers on a particular day pass their test. [2 marks]
(e) Find the mean number of drivers per day who pass their test. [1 mark]
(f) Find the standard deviation of the number of drivers per day who pass their test. [2 marks]

June 2022 Paper 3 Q19

AQACurrent spec6 marksIncludes hypothesis testingBinomial Distribution

19 A bank runs a campaign to promote Internet banking accounts to their customers.

Before the campaign, 42% of their customers had an Internet banking account.

One week after the campaign started, 35 customers were surveyed at random and 18 of them were found to have registered for an Internet banking account.

Using a binomial distribution, carry out a hypothesis test at the 10% significance level to investigate the claim that, since the campaign, there has been an increase in the proportion of customers registered for an Internet banking account. [6 marks]

June 2022 Paper 3 Q14

AQACurrent spec10 marksBinomial Distribution

14 A customer service centre records every call they receive.

It is found that 30% of all calls made to this centre are complaints.

A sample of 20 calls is selected.

The number of calls in the sample which are complaints is denoted by the random variable \(X\).

(a) State two assumptions necessary for \(X\) to be modelled by a binomial distribution. [2 marks]
(b) Assume that \(X\) can be modelled by a binomial distribution.
(i) Find \(\mathrm{P}(X = 1)\) [1 mark]
(ii) Find \(\mathrm{P}(X \lt 4)\) [2 marks]
(iii) Find \(\mathrm{P}(X \geqslant 10)\) [2 marks]
(c) In a random sample of 10 calls to a school, the number of calls which are complaints, \(Y\), may be modelled by a binomial distribution\[Y \sim \mathrm{B}(10, p)\]

The standard deviation of \(Y\) is 1.5

Calculate the possible values of \(p\). [3 marks]

June 2025 Paper 2 Q11

OCR ACurrent spec8 marksIncludes hypothesis testingBinomial Distribution

11 A train company claims that a particular daily service arrives on time on 95% of days. Riley suspects that the true percentage is less than 95%. Riley tests the company’s claim by choosing a random sample of 50 days during the period November 2023 to March 2024. Riley finds that the service arrived on time on 44 of these days.

(a) Use a binomial distribution to test at the 5% significance level whether Riley’s suspicion is justified. [7]
(b) By referring to one of the necessary assumptions for using a binomial distribution, suggest a reason why the conclusion may not be reliable. [1]

June 2025 Paper 2 Q10

10

(a) The random variable \(W\) has the distribution \(\mathrm{B}\left(12, \frac{1}{3}\right)\).

Find \(\mathrm{P}(W \geqslant 7)\). [2]
(b) The random variable \(X\) has the distribution \(\mathrm{N}\left(45, 4^2\right)\).

Find \(\mathrm{P}(X \gt 50)\). [1]
(c) The random variable \(Y\) has the distribution \(\mathrm{N}\left(25, \sigma^2\right)\).

Given that \(\mathrm{P}(Y \lt 30) = 0.75\), find \(\sigma\). [2]

June 2024 Paper 2 Q13

OCR ACurrent spec5 marksIncludes hypothesis testingBinomial DistributionNormal Distribution

13 At an election last year, 20% of voters in Aytown voted for the Now Party. A researcher plans to test whether the proportion of voters in Aytown who support the Now Party this year is greater than 0.2. The hypotheses for the test will be \(\mathrm{H}_0: p = 0.2\) and \(\mathrm{H}_1: p \gt 0.2\).

The researcher surveys a random sample of 200 voters in Aytown and notes the number \(X\) who say they support the Now Party.

The random variable \(Y\) has a normal distribution which is a good approximation to the distribution of \(X\) when the null hypothesis is correct.

The significance level of the test is 5%.

(a) Find the value of \(y\) such that \(\mathrm{P}(Y \gt y) = 0.05\). [2]
(b) Use your answer to part (a) to determine the smallest value of \(X\) that would result in rejecting the null hypothesis. [3]

June 2024 Paper 2 Q8

OCR ACurrent spec6 marksBinomial Distribution

8 Sweets from a certain manufacturer are sold in packets. Thirty per cent of the sweets are orange, and these are randomly distributed amongst the packets. Each packet contains 15 sweets.

The number of orange sweets in a randomly chosen packet is denoted by \(X\).

(a) Find the following probabilities.
(i) \(\mathrm{P}(X = 4)\) [1]
(ii) \(\mathrm{P}(X \geqslant 4)\) [2]
(b)
(i) Write down an expression for \(\mathrm{P}(X = r)\). [1]
(ii) Explain the connection between the expression in part (b)(i) and the binomial expansion of \((0.7 + 0.3)^n\), for a specific value of \(n\) which should be stated. [2]

June 2023 Paper 2 Q12

OCR ACurrent spec4 marksIncludes hypothesis testingBinomial Distribution

12 A student has an ordinary six-sided dice. The student suspects that it is biased against six, so that when it is thrown, it is less likely to show a six than if it were fair.

In order to test this suspicion, the student plans to carry out a hypothesis test at the 5% significance level.

The student throws the dice 100 times and notes the number of times, \(X\), that it shows a six.

(a) Determine the largest value of \(X\) that would provide evidence at the 5% significance level that the dice is biased against six. [3]

Later another student carries out a similar test, at the 5% significance level. This student also throws the dice 100 times.

(b) It is given that the dice is fair.
Find the probability that the conclusion of the test is that there is significant evidence that the dice is biased against six. [1]

June 2023 Paper 2 Q9

OCR ACurrent spec6 marksIncludes samplingBinomial DistributionData Processing

9 A school contains 500 students in years 7 to 11 and 250 students in years 12 and 13. A random sample of 20 students is selected to represent the school at a parents’ evening. The number of students in the sample who are from years 12 and 13 is denoted by \(X\).

(a) State a suitable binomial model for \(X\). [1]

Use your model to answer the following.

(b)
(i) Write down an expression for \(\mathrm{P}(X = x)\). [1]
(ii) State, in set notation, the values of \(x\) for which your expression is valid. [1]
(c) Find \(\mathrm{P}(5 \leqslant X \leqslant 9)\). [2]
(d) State one disadvantage of using a random sample in this context. [1]

June 2022 Paper 2 Q12

OCR ACurrent spec6 marksIncludes hypothesis testingBinomial Distribution

12 A firm claims that no more than 2% of their packets of sugar are underweight. A market researcher believes that the actual proportion is greater than 2%. In order to test the firm’s claim, the researcher weighs a random sample of 600 packets and carries out a hypothesis test, at the 5% significance level, using the null hypothesis \(p = 0.02\).

(a) Given that the researcher’s null hypothesis is correct, determine the probability that the researcher will conclude that the firm’s claim is incorrect. [5]
(b) The researcher finds that 18 out of the 600 packets are underweight. A colleague says

“18 out of 600 is 3%, so there is evidence that the actual proportion of underweight bags is greater than 2%.”

Criticise this statement. [1]

June 2025 Paper 2 Q13

OCR MEICurrent spec9 marksIncludes hypothesis testingBinomial Distribution

13 According to the Office for National Statistics, in 2022 the proportion of people in England and Wales aged 16 or over who were married or in a civil partnership was 0.494.

In 2024 a researcher collected a random sample of 78 people aged 16 or over.

The researcher decided to conduct a hypothesis test at the 1% level to see if there was any evidence to suggest that the proportion of people aged 16 or over who are married or in a civil partnership was lower in 2024.

(a) State the hypotheses for the test. You must define the parameter used to carry out the test. [2]
(b) Determine the critical region for the test. [3]

The researcher found that 26 of the 78 people in the random sample were married or in a civil partnership.

(c) Use your answer to part (b) to carry out the hypothesis test. [3]
(d) State the probability that the null hypothesis is incorrectly rejected. [1]

June 2025 Paper 2 Q11

OCR MEICurrent spec7 marksBinomial DistributionData Processing

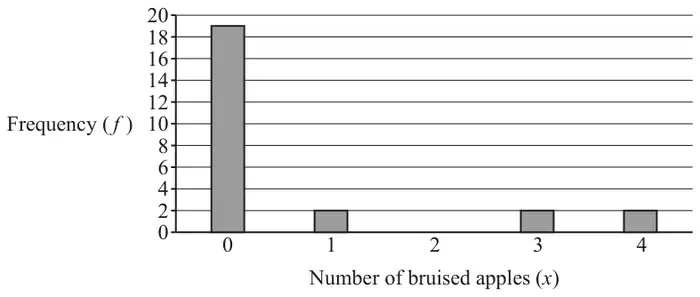
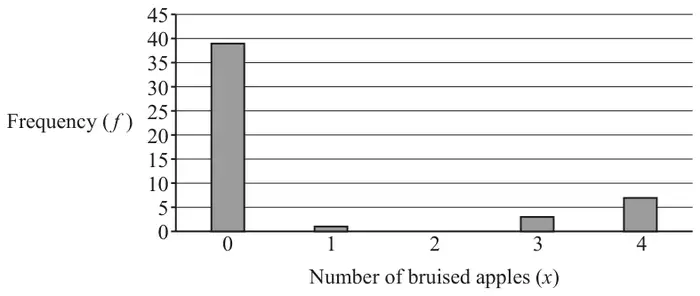
11 Apples are sold in packets of 4. Ling and Sam are investigating the frequency, \(f\), of the number of bruised apples in a packet, \(x\). They each collect a random sample of packets, note the number of bruised apples in each packet and draw a diagram to represent their data.

Ling’s results are shown in Table 11.1 and Fig. 11.1.

Table 11.1

\(x\)01234
\(f\)192022
Fig. 11.1: bar chart of frequency against number of bruised apples for Ling: 19, 2, 0, 2, 2 for x = 0 to 4
Fig. 11.1

Sam’s results are shown in Table 11.2 and Fig. 11.2.

Table 11.2

\(x\)01234
\(f\)391037
Fig. 11.2: bar chart of frequency against number of bruised apples for Sam: 39, 1, 0, 3, 7 for x = 0 to 4
Fig. 11.2
(a) Explain why Sam’s diagram is likely to be a better representation of the true distribution of the number of bruised apples in a packet than Ling’s diagram. [1]
(b) Calculate the mean number of bruised apples per packet for Sam’s data. [1]

Sam thinks that the distribution of bruised apples may be modelled by a binomial distribution.

(c) Use your answer to part (b) to calculate the value of \(p\), the probability that an apple selected at random is bruised, for Sam’s model. [1]
(d) Calculate the theoretical frequency distribution of the number of bruised apples per packet for Sam’s model, giving your answers correct to 2 decimal places. [3]
(e) Comment on whether Sam’s model appears to be a good fit for the data. [1]

June 2024 Paper 2 Q12

OCR MEICurrent spec7 marksIncludes hypothesis testingBinomial Distribution

12 A survey conducted in 2021 showed that 10% of British adults were vegetarians.

A dietitian believes that the proportion of British adults who are vegetarians may have changed, so decides to conduct a hypothesis test at the 5% level of significance.

In a random sample of 112 adults, the dietitian finds that there are 19 vegetarians.

Carry out the hypothesis test to determine whether there is any evidence to support the dietitian’s belief. [7]

June 2023 Paper 2 Q4

OCR MEICurrent spec5 marksBinomial DistributionDRVs

4 A biased octagonal dice has faces numbered from 1 to 8. The discrete random variable \(X\) is the score obtained when the dice is rolled once. The probability distribution of \(X\) is shown in the table below.

\(x\)12345678
\(\mathrm{P}(X = x)\)\(p\)\(p\)\(p\)\(p\)\(p\)\(p\)\(p\)\(3p\)
(a) Determine the value of \(p\). [2]
(b) Find the probability that a score of at least 4 is obtained when the dice is rolled once. [1]

The dice is rolled 30 times.

(c) Determine the probability that a score of 8 occurs exactly twice. [2]

June 2022 Paper 2 Q13

OCR MEICurrent spec8 marksIncludes hypothesis testingBinomial Distribution

13 Records from the 1950s showed that 35% of human babies were born without wisdom teeth. It is believed that as part of the evolutionary process more babies are now born without wisdom teeth. In a random sample of 140 babies, collected in 2020, a researcher found that 61 were born without wisdom teeth.

The researcher made the following statement.

“This shows that the percentage of babies born without wisdom teeth has increased from 35%.”

(a) Explain whether this statement can be fully justified. [1]
(b) Conduct a hypothesis test at the 5% level to determine whether there is any evidence to suggest that more than 35% of babies are now born without wisdom teeth. [7]

June 2022 Paper 2 Q11

OCR MEICurrent spec10 marksBinomial DistributionDRVs

11 A die in the form of a dodecahedron has its faces numbered from 1 to 12. The die is biased so that the probability that a score of 12 is achieved is different from any other score. The probability distribution of \(X\), the score on the die, is given in the table in terms of \(p\) and \(k\), where \(0 \lt p \lt 1\) and \(k\) is a positive integer.

\(x\)123456789101112
\(\mathrm{P}(X = x)\)\(p\)\(p\)\(p\)\(p\)\(p\)\(p\)\(p\)\(p\)\(p\)\(p\)\(p\)\(kp\)

Sam rolls the die 30 times, Leo rolls the die 60 times and Nina rolls the die 120 times. They each plot their scores on bar line graphs.

(a) Explain whose graph is most likely to give the best representation of the theoretical probability distribution for the score on the die. [1]
(b) Find \(p\) in terms of \(k\). [2]
(c) Determine, in terms of \(k\), the expected number of times Nina rolls a 12. [3]
(d) Given that Nina rolls a 12 on 32 occasions, calculate an estimate of the value of \(k\). [2]

Nina rolls the die a further 30 times.

(e) Use your answer to part (d) to calculate an estimate for the probability that she obtains a 12 exactly 8 times in these 30 rolls. [2]

October 2021 Paper 2 Q13

OCR MEICurrent spec7 marksBinomial DistributionData Processing

13 At a certain factory Christmas tree decorations are packed in boxes of 10.

The quality control manager collects a random sample of 100 boxes of decorations and records the number of decorations in each box which are damaged.

His results are displayed in Fig. 13.1.

Number of damaged decorations012345 or more
Number of boxes1935281350

Fig. 13.1

(a) Calculate
  • the mean number of damaged decorations per box,
  • the standard deviation of the number of damaged decorations per box.
[2]

It is believed that the number of damaged decorations in a box of 10, \(X\), may be modelled by a binomial distribution such that \(X \sim \mathrm{B}(n, p)\).

(b) State suitable values for \(n\) and \(p\). [1]
(c) Use the binomial model to complete the copy of Fig. 13.2 in the Printed Answer Booklet, giving your answers correct to 1 decimal place. [3]
Number of damaged decorations012345 or more
Observed number of boxes1935281350
Expected number of boxes

Fig. 13.2

(d) Explain whether the model is a good fit for these data. [1]

October 2021 Paper 2 Q5

OCR MEICurrent spec3 marksBinomial Distribution

5 It is known that 40% of people in Britain carry a certain gene.

A random sample of 32 people is collected.

(a) Calculate the probability that exactly 12 people carry the gene. [1]
(b) Calculate the probability that at least 8 people carry the gene, giving your answer correct to 3 decimal places. [2]

October 2020 Paper 2 Q12

OCR MEICurrent spec15 marksIncludes hypothesis testingBinomial DistributionDRVs

12 In this question you must show detailed reasoning.

A 5-sided spinner can give scores of 1, 2, 3, 4 or 5. After observing a large number of spins, Elaine models the probability distribution of \(X\), the score on the spinner, as shown in Fig. 12.

\(x\)12345
\(\mathrm{P}(X = x)\)0.20.3\(p\)\(p\)\(q\)

Fig. 12

When the spinner is spun twice, the probability of obtaining a total score of 9 is 0.06.

(a) Given that \(q < 2p\), determine the values of \(p\) and \(q\). [6]
(b) The spinner is spun 10 times. Calculate the probability that exactly one 5 is obtained. [2]

Elaine’s teacher believes that the probability that the spinner shows a 1 is greater than 0.2. The spinner is spun 100 times and gives a score of 1 on 28 occasions.

(c) Conduct a hypothesis test at the 5% level to determine whether there is any evidence to suggest that the probability of obtaining a score of 1 is greater than 0.2. [7]