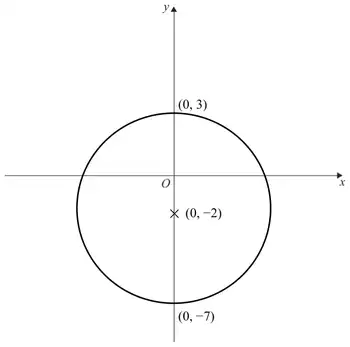
Circle A is translated by the vector \(\begin{pmatrix} 0 \\ -2 \end{pmatrix}\) to give circle B.
Sketch circle B. Show the coordinates of the centre of circle B and the points where circle B meets the \(y\)-axis. (3)
Mark scheme
Answer
Mark
Mark scheme
Circle radius 5 centre \((0, -2)\) and \((0, 3)\) and \((0, -7)\) labelled
B3
for a correct sketch of a circle with centre \((0, -2)\) and intercepts \((0, 3)\) and \((0, -7)\) labelled
(B2
for a sketch of a circle with two of the 3 points indicated, or for a sketch of a circle with correct centre and radius of 5 labelled or stated)
(B1
for a sketch of a circle with the correct centre or states correct centre and radius, but does not sketch)
Additional guidance
See diagram at end of scheme Allow freehand circles Ignore intersections with \(x\) axis for all marks Accepts points marked with correct \(y\)-coordinate, eg \(-2\) on \(y\)-axis for centre
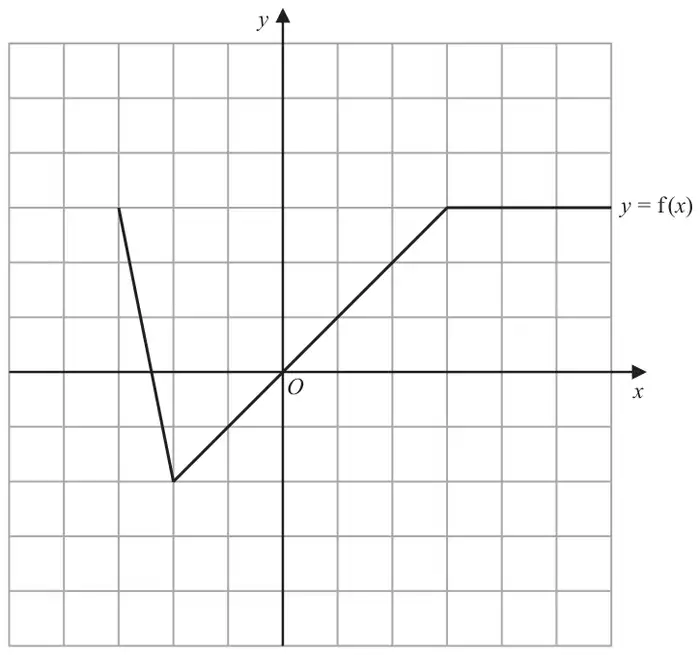
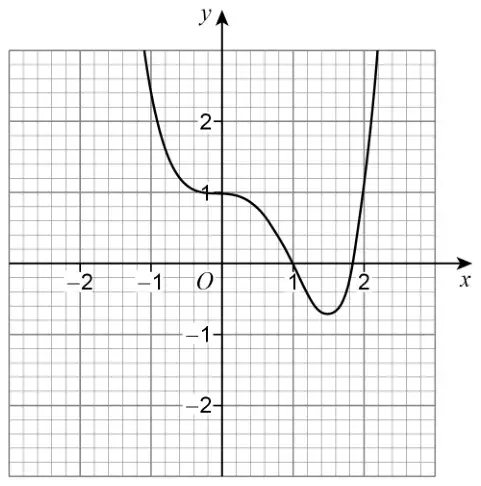
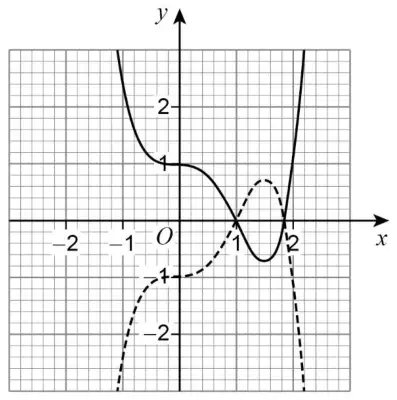
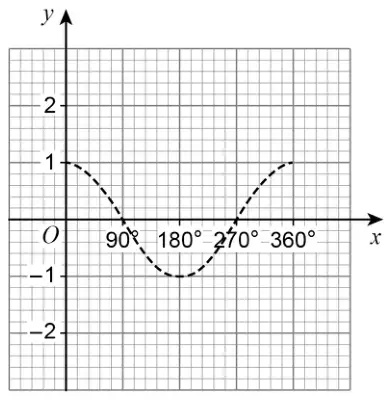
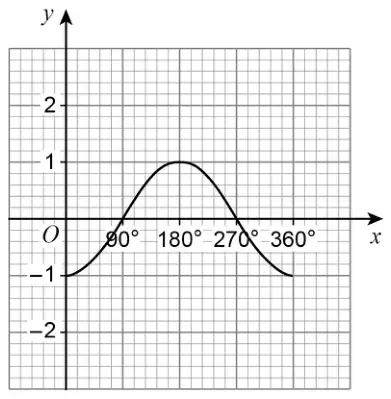
(a) On the grid, draw the graph of \(y = -\mathrm{f}(x)\) (1)
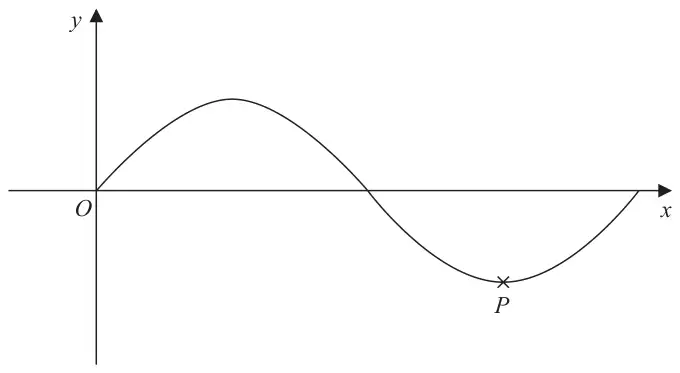
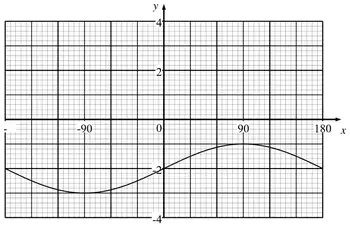
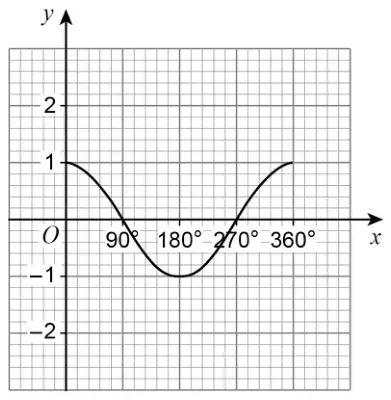
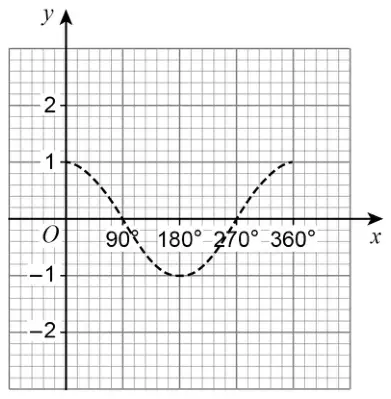
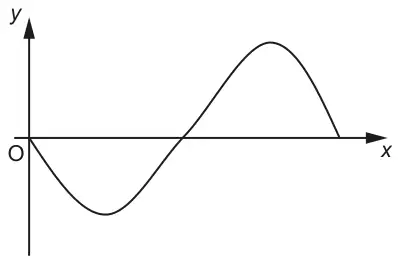
Here is a sketch of the graph of \(y = \sin x^\circ\)
The point marked \(P\) is a turning point on the graph.
The graph of \(y = \sin x^\circ\) is translated to give the graph of \(y = \sin(x + 180)^\circ + 4\)
Following the translation the point \(P\), shown on the graph above, moves to point \(R\).
(b) Find the coordinates of \(R\). (3)
Mark scheme (a)
Answer
Mark
Mark scheme
Sketch
B1
for an appropriate sketch, ie reflection in \(x\) axis
Additional guidance
Allow some tolerance on the points and in drawing the function if the intention is clear
Graph at end of mark scheme
Mark scheme (b)
Answer
Mark
Mark scheme
(90, 3)
M1
for coordinates of \(P = (270, -1)\)
M1
for describing part of the translation, eg \(\text{``}270\text{''} - 180\), or \(\text{``}{-}1\text{''} + 4\) or \([x_P] - 180\), or \([y_P] + 4\) or for an answer of \((90, b)\) or an answer of \((a, 3)\)
A1
cao
Additional guidance
May see 270 and −1 marked in the correct positions on the axes
[\(x_P\)], [\(y_P\)] must be a numerical value and clearly identified as point \(P\) by labelling or on the diagram with no contradiction
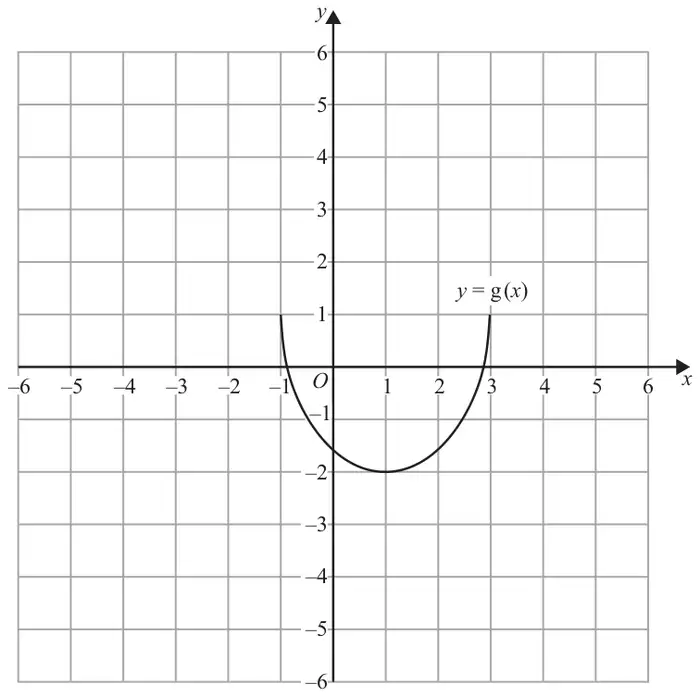
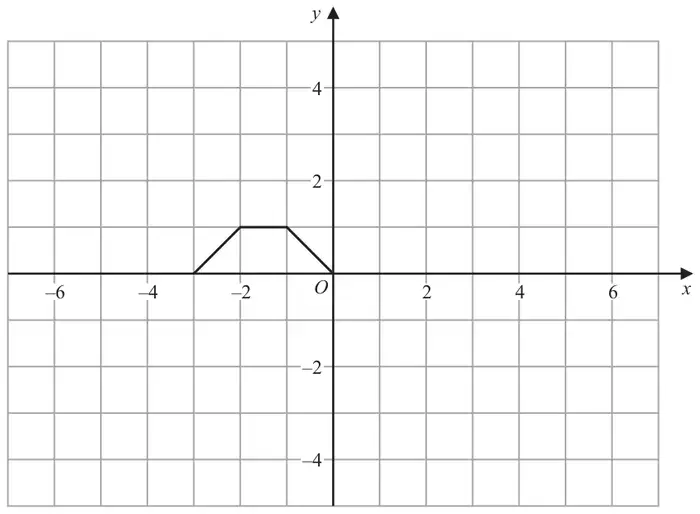
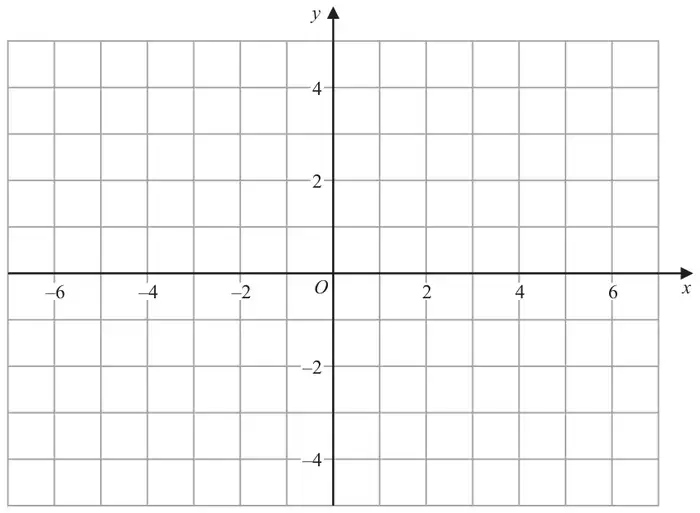
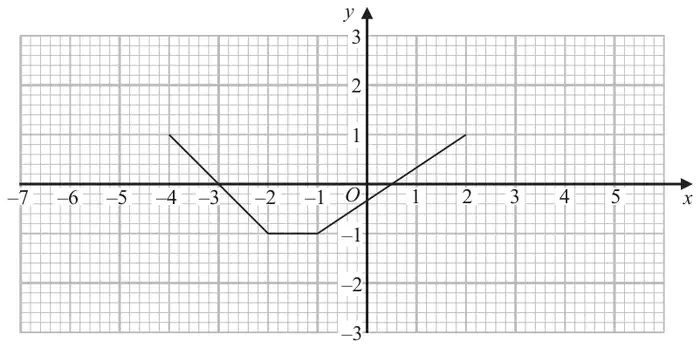
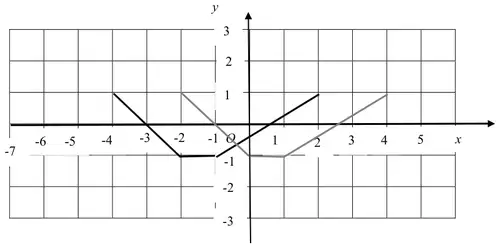
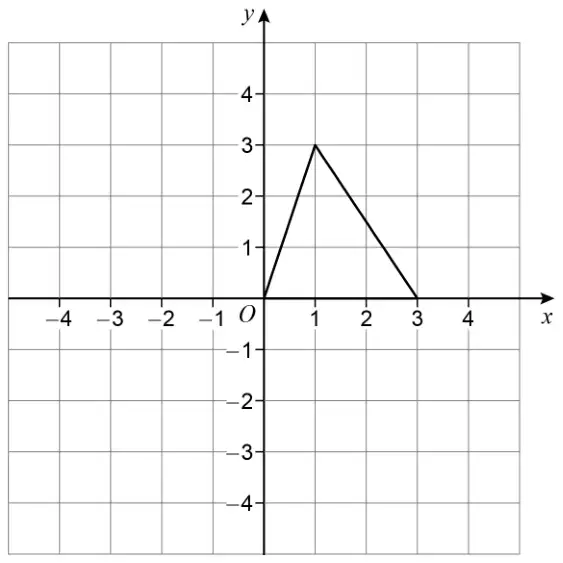
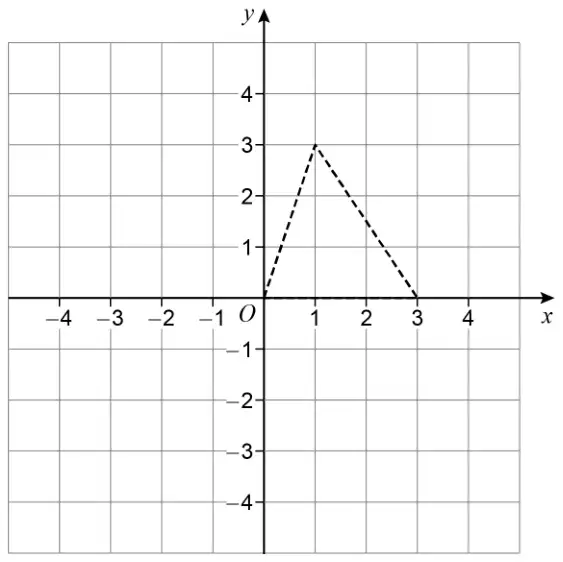
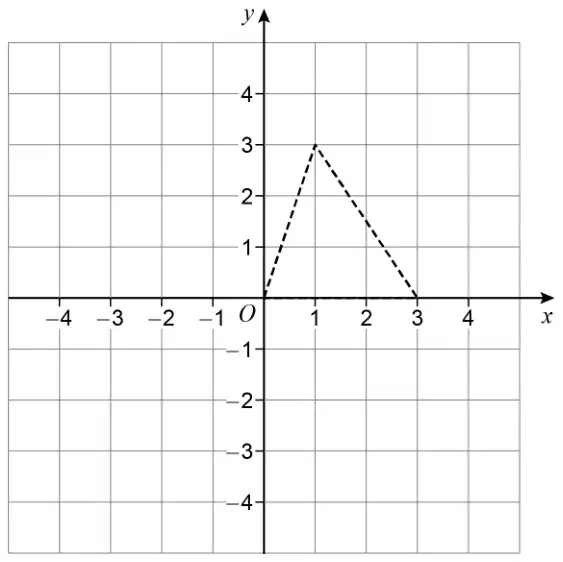
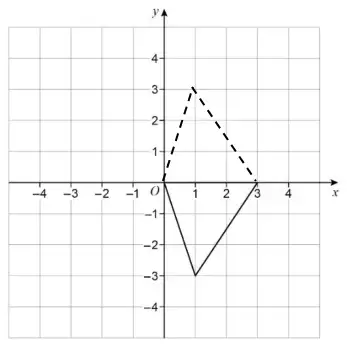
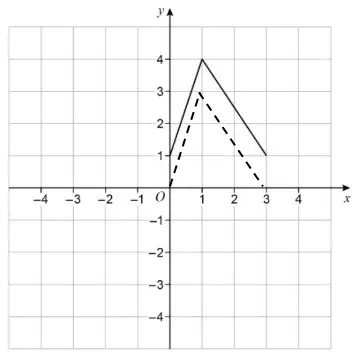
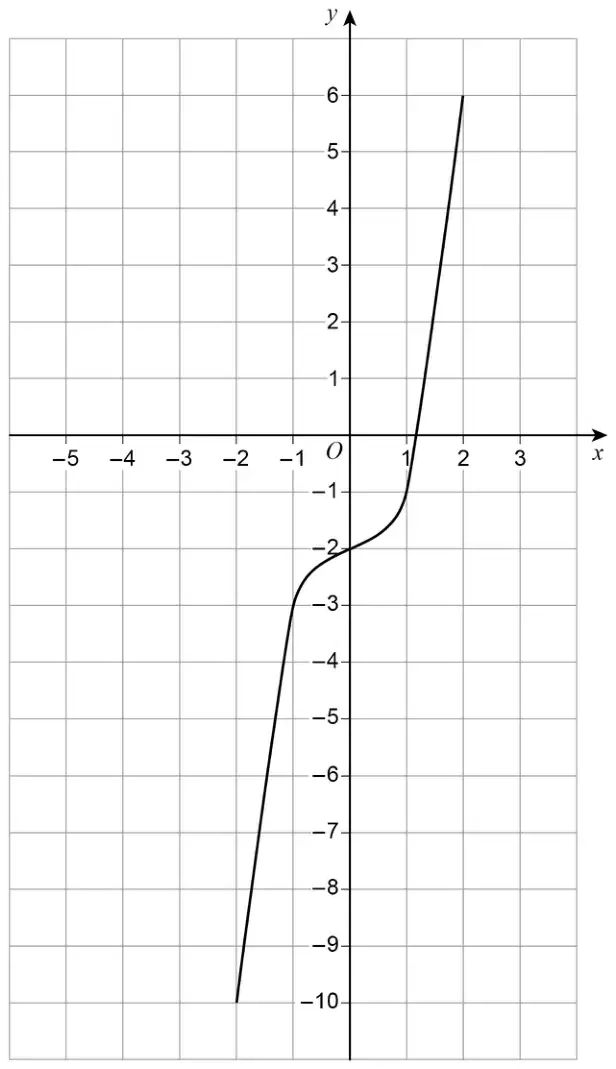
21 The graph of \(y = \mathrm{g}(x)\) is shown on the grid.
On the grid, draw the graph of \(y = \mathrm{g}(-x) + 2\) (2)
Mark scheme
Answer
Mark
Mark scheme
Graph
C2
for a fully correct transformation
(C1
for a correct translation of \(\mathrm{g}(x)\) of 2 units in the positive \(y\)-direction or a correct reflection of \(\mathrm{g}(x)\) in the \(y\)-axis or for at least 2 of the points \((-1, 1), (1, -2), (3, 1)\) transformed to the correct final position, eg \((1, 3), (-1, 0), (-3, 3)\))
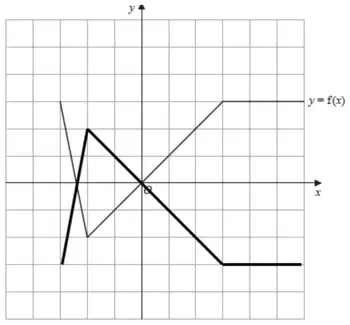
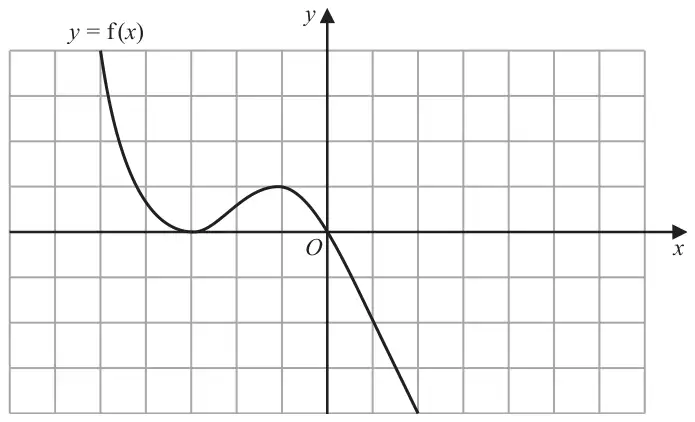
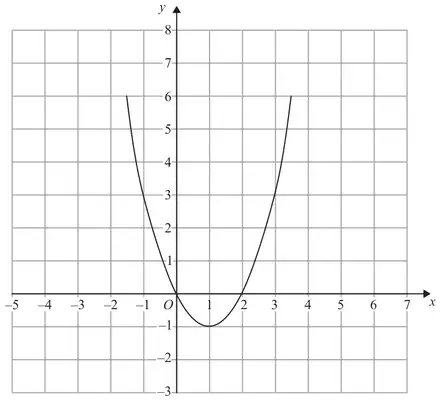
21 The graph of \(y = \mathrm{f}(x)\) is shown on the grid below.
(a) On the grid above, sketch the graph of \(y = \mathrm{f}(-x)\) (1)
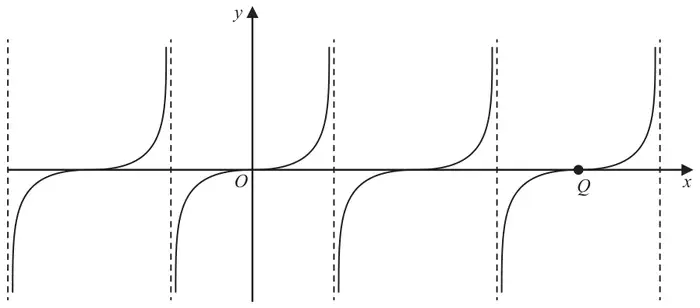
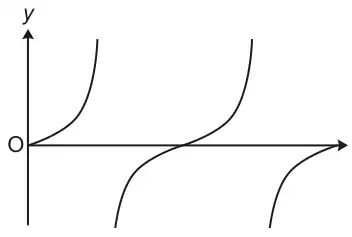
Here is a sketch of the graph of \(y = \tan x^\circ\)
The graph of \(y = \tan x^\circ\) is translated to give the graph of \(y = \mathrm{g}(x)\)
Following the translation the point \(Q\), shown on the graph above, moves to point \(R\). Point \(R\) has coordinates \((90, -5)\)
(b) Find an expression for \(\mathrm{g}(x)\) in terms of \(x\). (2)
Mark scheme (a)
Answer
Mark
Mark scheme
Sketch
B1
for an appropriate sketch, ie reflection in \(y\) axis
Additional guidance
Must go through \((-2, -4)\ (0, 0)\ (1, 1)\ (3, 0)\ (5, 4)\)
Mark scheme (b)
Answer
Mark
Mark scheme
\(\tan(x + 270)^\circ - 5\)
M1
for describing one part of the translation, eg \(360 - 90\ (= 270)\) or \(\tan(x + 270)\) or \((y =)\ \tan(kx + a) - 5\) where \(k\) and \(a\) are numbers and \(k \neq 0\)
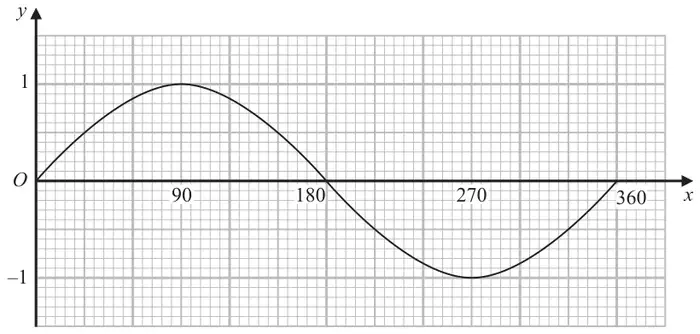
18 Here is a graph of \(y = \sin x^\circ\) for \(0 \leqslant x \leqslant 360\)
(a) Using this graph, find estimates of all four solutions of \(\sin x^\circ = 0.6\) for \(0 \leqslant x \leqslant 720\) (2)
The graph of \(y = \sin x^\circ\) is reflected in the \(x\)-axis.
(b) Write down an equation of the reflected graph. (1)
Here is a graph of \(y = \mathrm{f}(x)\)
(c) On the grid, draw the graph of \(y = \mathrm{f}(x - 2)\) (1)
Mark scheme (a)
Answer
Mark
Mark scheme
37, 143, 397, 503
M1
for any two correct angles within the ranges below or for a correct method to find a solution beyond 360, eg. “angle read from 0 to 360” + 360
A1
for all 4 angles in the range, 35 to 40, 140 to 145, 395 to 400 and 500 to 505
Additional guidance
Accept given as coordinates for M1 only
Mark scheme (b)
Answer
Mark
Mark scheme
\(y = -\sin x^\circ\)
B1
for any acceptable equations, eg. \(y = -\sin x^\circ\) or \(y = \sin(-x^\circ)\) or \(-y = \sin x^\circ\) or \(y = \cos(x^\circ + 360n + 90)\) or for any positive integer \(n\), \(y = \sin(x^\circ - (2n - 1)180)\) or \(y = \cos(x^\circ + 360n)\)
Additional guidance
Quoted are just the more likely solutions but check all attempts
Condone missing degrees sign
Mark scheme (c)
Answer
Mark
Mark scheme
graph
C1
for correct graph shown translated 2 in the positive \(x\)-direction
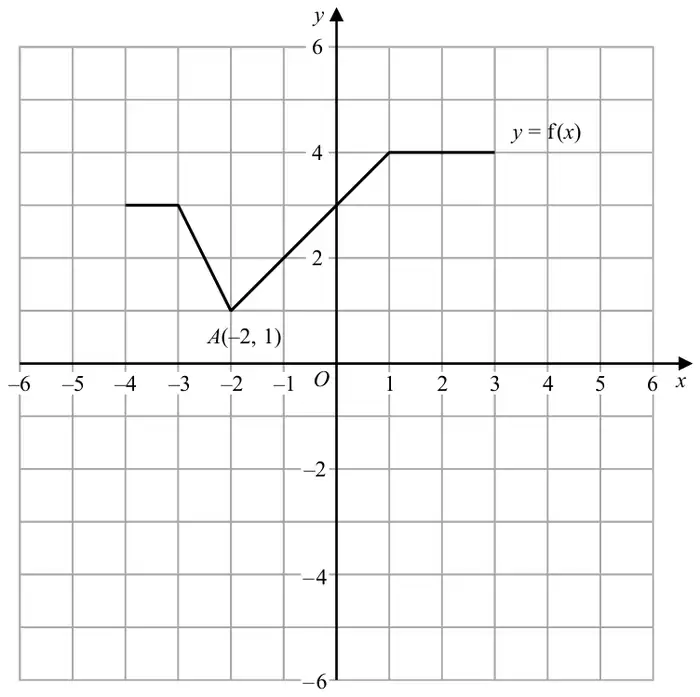
20 The graph of \(y = \mathrm{f}(x)\) is shown on the grid.
(a) On the grid, draw the graph with equation \(y = \mathrm{f}(x + 1) - 3\) (2)
Point \(A(-2, 1)\) lies on the graph of \(y = \mathrm{f}(x)\).
When the graph of \(y = \mathrm{f}(x)\) is transformed to the graph with equation \(y = \mathrm{f}(-x)\), point \(A\) is mapped to point \(B\).
(b) Write down the coordinates of point \(B\). (1)
Mark scheme (a)
Answer
Mark
Mark scheme
graph
C2
for a translation of the graph by the vector \(\begin{pmatrix}-1\\-3\end{pmatrix}\)
(C1
for a translation of the graph by the vector \(\begin{pmatrix}-1\\b\end{pmatrix}\) where \(b \neq -3\) or \(\begin{pmatrix}a\\-3\end{pmatrix}\) where \(a \neq -1\) or for a translation by the vector \(\begin{pmatrix}-1\\-3\end{pmatrix}\) of 3 or 4 critical points)
Additional guidance
Condone graph of \(y = \mathrm{f}(-x)\) also being drawn on the grid
15 The graph of the curve C with equation \(y = \mathrm{f}(x)\) is transformed to give the graph of the curve S with equation \(y = \mathrm{f}(-x) - 3\)
The point on C with coordinates \((7, 2)\) is mapped to the point \(Q\) on S.
Find the coordinates of \(Q\). (2)
Mark scheme
Answer
Mark
Mark scheme
\((-7, -1)\)
M1
for a method which shows understanding of the type of transformation eg reflection in the \(y\) axis or translation \(\begin{pmatrix} 0 \\ -3 \end{pmatrix}\) or “(0 units right and) 3 units down” or for \(x\) coordinate as \(-7\) or \(y\) coordinate as \(-1\)
A1
for \((-7, -1)\)
Additional guidance
“Reflection” or “Translation” alone is insufficient.
Note that the \(-7\) or the \(-1\) may appear in the working space, not necessarily in the final answer.
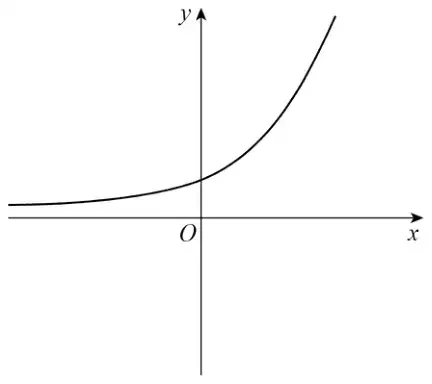
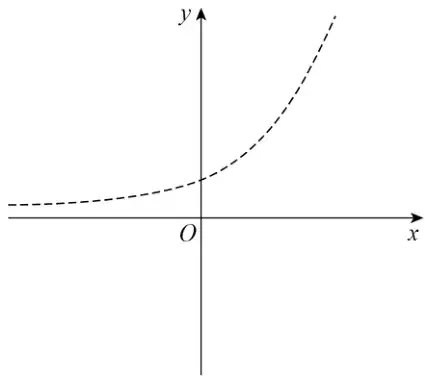
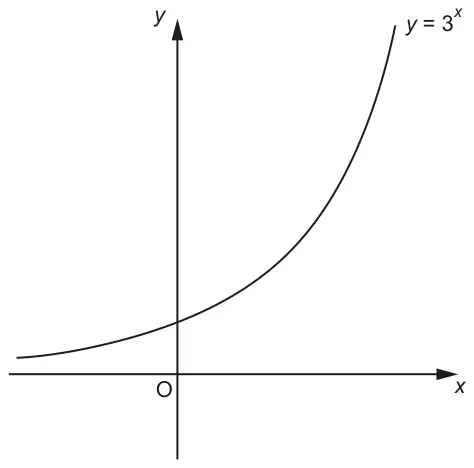
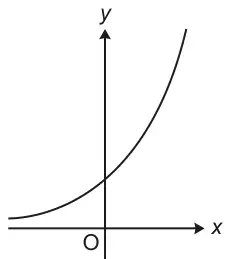
20 The equation of a curve is \(y = a^x\) \(A\) is the point where the curve intersects the \(y\)-axis.
(a) State the coordinates of \(A\). (1)
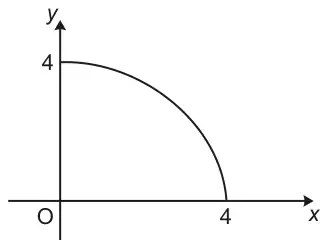
The equation of circle C is \(x^2 + y^2 = 16\)
The circle C is translated by the vector \(\begin{pmatrix} 3 \\ 0 \end{pmatrix}\) to give circle B.
(b) Draw a sketch of circle B. Label with coordinates the centre of circle B and any points of intersection with the \(x\)-axis. (3)
Mark scheme (a)
Answer
Mark
Notes
(0, 1)
B1
(0, 1)
Mark scheme (b)
Answer
Mark
Notes
Circle radius 4 Centre (3, 0) and (−1, 0) and (7, 0) labelled
M1
For centre (3, 0) implied by drawing or label or a circle of radius 4 or intersections on the \(x\)-axis at \(-1\) or 7 implied by drawing or labels
M1
for 2 of centre (3, 0) implied by drawing or label intersections on the \(x\)-axis at \(-1\) and 7 implied by drawing or label circle drawn with radius 4
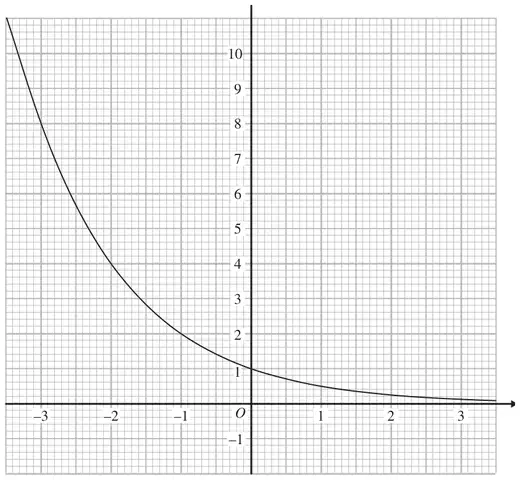
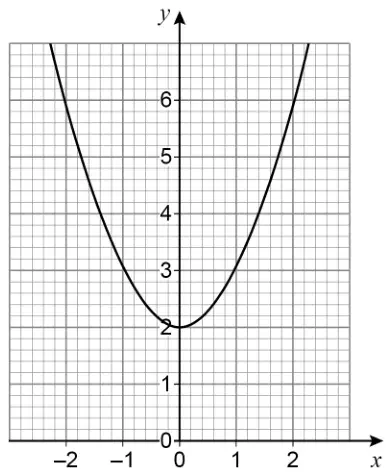
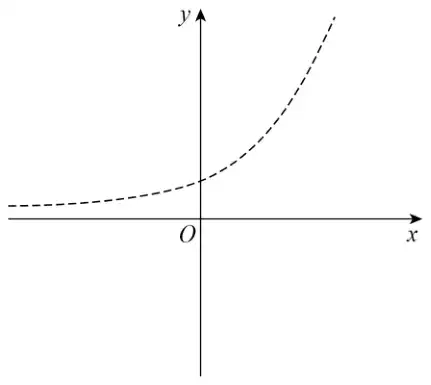
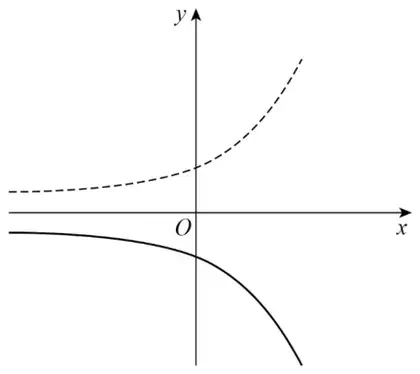
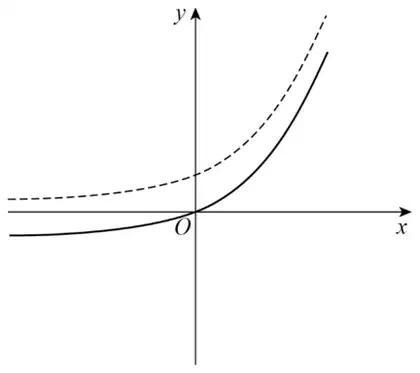
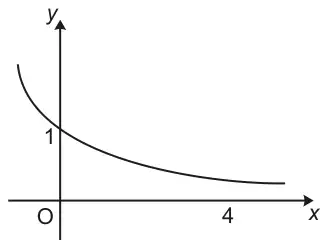
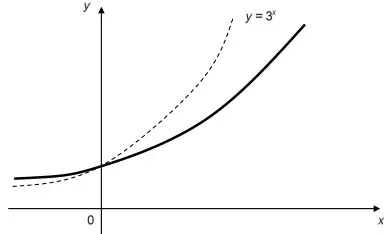
The graph of \(y = k^x\), where \(k\) is a positive constant, is shown above.
(a) Find the value of \(k\). (2)
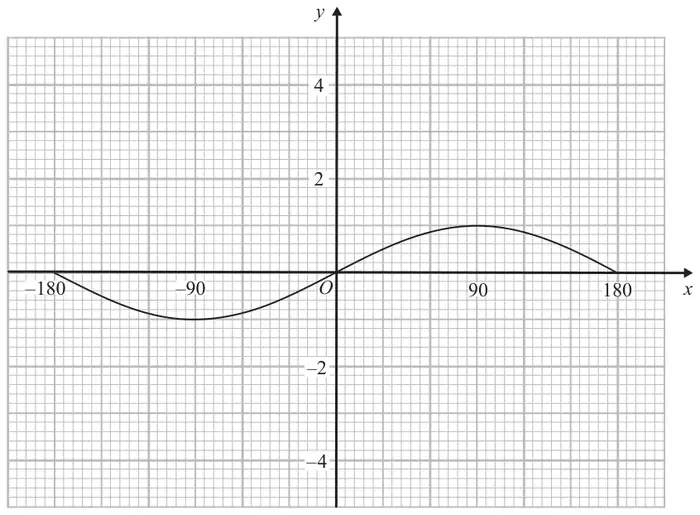
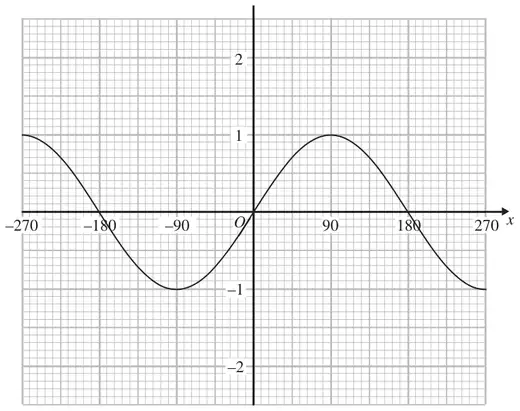
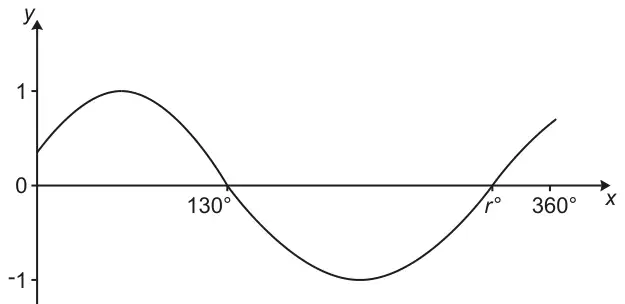
The graph of \(y = \sin x^\circ\) for values of \(x\) from \(-270\) to \(+270\) is shown above.
(b) On the same axes, draw the graph of \(y = 1 - \sin x^\circ\) for values of \(x\) from \(-270\) to \(+270\) (2)
Mark scheme (a)
Working
Answer
Mark
Notes
\(2 = k^{-1}\)
\(\tfrac{1}{2}\)
2
M1 for reading off and substituting a pair of values from the graph (excluding 0, 1) into the equation, eg \(x = -1\), \(y = 2\) A1 for \(\tfrac{1}{2}\) oe
Mark scheme (b)
Answer
Mark
Notes
correct graph
2
B2 cao (B1 for correct general shape, eg \(y = -\sin x^\circ\))
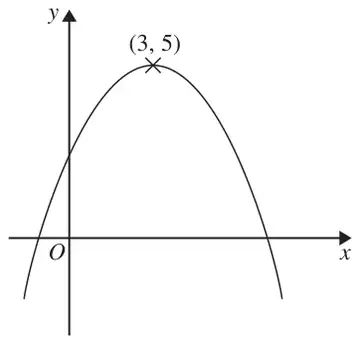
The diagram shows part of the curve with equation \(y = \mathrm{f}(x)\). The coordinates of the maximum point of the curve are (3, 5).
(a) Write down the coordinates of the maximum point of the curve with equation
(i) \(y = \mathrm{f}(x + 3)\)
(ii) \(y = 2\mathrm{f}(x)\)
(iii) \(y = \mathrm{f}(3x)\) (3)
The curve with equation \(y = \mathrm{f}(x)\) is transformed to give the curve with equation \(y = \mathrm{f}(x) - 4\)
(b) Describe the transformation. (1)
Mark scheme (a)
Answer
Mark
Notes
(i) (0, 5)
B1 cao
(ii) (3, 10)
B1 cao
(iii) (1, 5)
3
B1 cao
Mark scheme (b)
Answer
Mark
Notes
Translation of \(\begin{pmatrix} 0 \\ -4 \end{pmatrix}\) oe
1
B1 for a correct transformation, eg. translation of \(\begin{pmatrix} 0 \\ -4 \end{pmatrix}\) or translation of 4 units in the negative \(y\)-direction, oe.
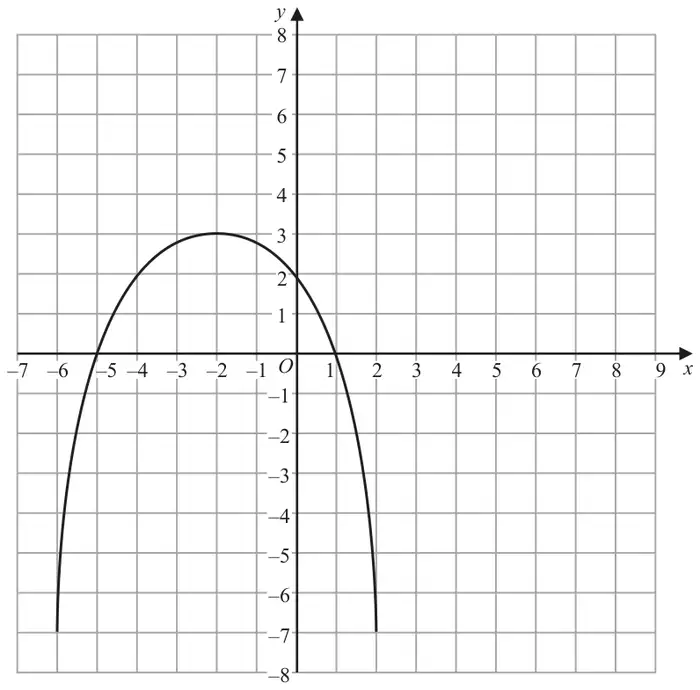
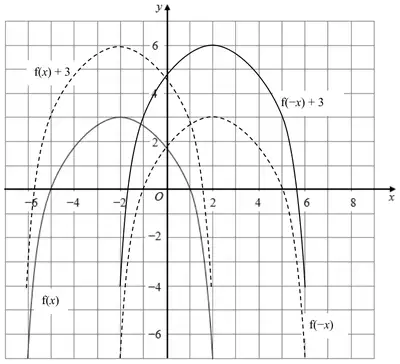
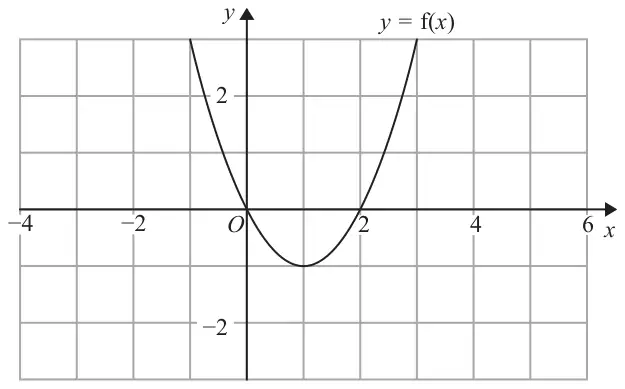
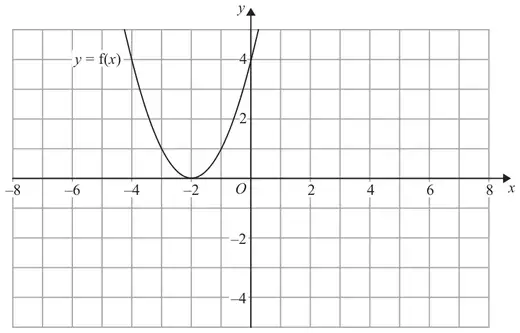
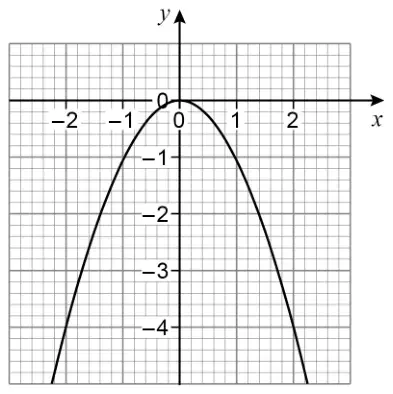
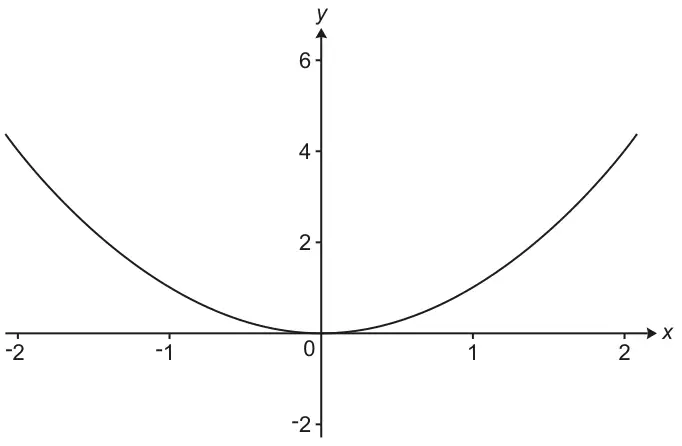
The graph of \(y = \mathrm{f}(x)\) is shown on the grid.
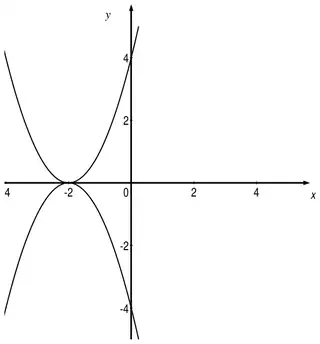
(a) On the grid above, sketch the graph of \(y = -\mathrm{f}(x)\). (2)
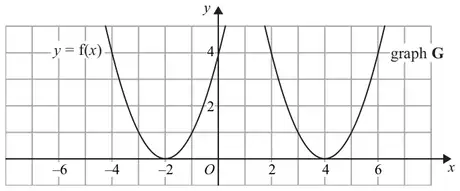
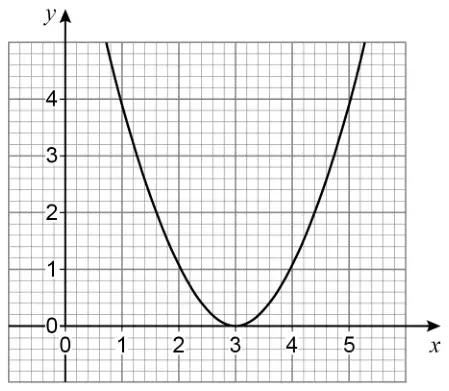
The graph of \(y = \mathrm{f}(x)\) is shown on the grid.
The graph G is a translation of the graph of \(y = \mathrm{f}(x)\).
(b) Write down the equation of graph G. (1)
Mark scheme (a)
Working
Answer
Mark
Notes
sketch
2
M1 for inverting the parabola, so maximum is at \((-2, 0)\) A1 for parabola passing through all three of the points \((-2, 0)\), \((0, -4)\), \((-4, -4)\)
Mark scheme (b)
Answer
Mark
Notes
\(y = \mathrm{f}(x - 6)\)
1
B1 for \(y = \mathrm{f}(x - 6)\) or \(y = (x - 4)^2\) oe
B2 for a parabola with min (4, –1), through (2, 3), (6, 3),(3, 0), (5, 0) (B1 for a parabola with min (4, –1) or a parabola through (2, 3) and (6, 3) or a parabola through (3, 0) and (5, 0) or a translation of the given parabola along the x-axis by any value other than +3 with the points (–1, 3) (0, 0) (1, –1) (2, 0) (3, 3) all translated by the same amount)
Mark scheme (b)
Answer
Mark
Notes
Parabola through (1, –2), (0, 0), (2, 0)
2
B2 parabola with min (1, –2), through (0, 0) and (2, 0) (B1 parabola with min (1, –2) or parabola through (0, 0), (2, 0) (-1, 6) and (3, 6))
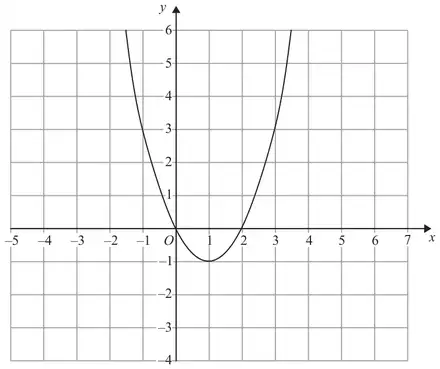
27 The grid shows the graph of \(\quad y = \mathrm{f}(x)\)
On the grid, draw the graph of \(\quad y = -\mathrm{f}(x)\) [2 marks]
Mark scheme
Answer
Mark
Comments
Reflection of given graph in the \(x\)-axis
M1
mark intention
Correct shape of graph from ([\(-1.5\), \(-1\)], \(-3\)) through (0, \(-1\)) through (1, 0) maximum at ([1.4, 1.6], [0.6, 0.8]) through (1.8, 0) to ([2, 2.5], \(-3\))
A1
Additional guidance
M1A1
Feathering or double lines or a split line, but intention to reflect in the \(x\)-axis
oe full expansion of their 4 terms by \((x - 4)\) with at least 4 terms correct or full expansion of their 3 terms by \((x - 4)\) with at least 3 terms correct ft \((x + 4)^3\) only
\(x^3 - 12x^2 + 48x - 58\)
A1
Additional guidance
Using \((x + 4)^3\) can score a maximum of B0M1M1A0 \(x^2 + 4x + 4x + 16\) with 3 terms correct or \(x^2 + 8x + k\) where \(k\) is a non-zero constant \(x^3 + 4x^2 + 4x^2 + 16x + 4x^2 + 16x + 16x + 64\ (+ 6)\) or \(x^3 + 8x^2 + 16x + 4x^2 + 32x + 64\ (+ 6)\) or \(x^3 + 12x^2 + 48x + 64\) or \(x^3 + 12x^2 + 48x + 70\)
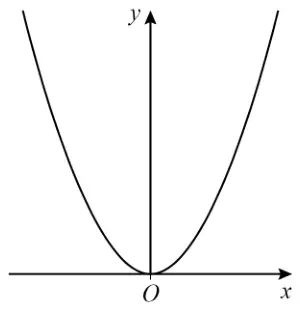
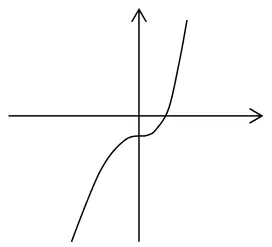
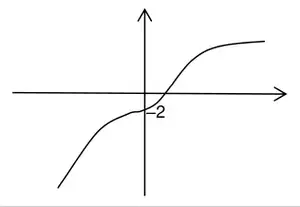
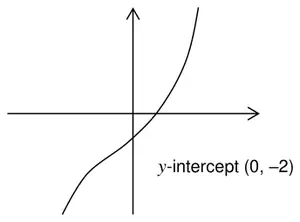
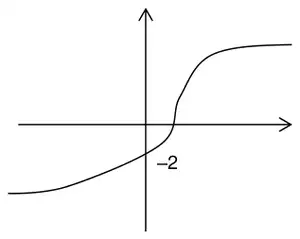
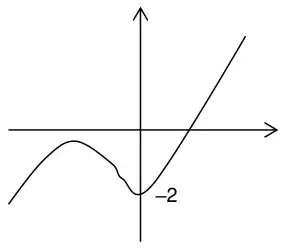
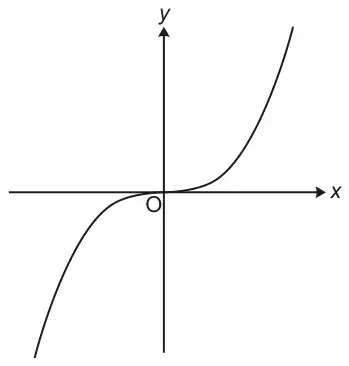
8 On the axes, sketch the curve \(\quad y = x^3 - 2\)
You must show the coordinates of the \(y\)-intercept. [2 marks]
Mark scheme
Answer
Mark
Comments
Fully correct curve and point \((0, -2)\) indicated
B2
B1 fully correct curve or partially correct curve with point \((0, -2)\) indicated
Additional guidance
A partially correct curve must start in the 3rd quadrant and finish in the 1st quadrant, passing through the 4th quadrant not include a section with negative gradient
A fully correct curve must have all the properties of a partially correct curve have only a decreasing gradient to the left of the \(y\)-axis have only an increasing gradient to the right of the \(y\)-axisCondone a positive gradient at the \(y\)-intercept Condone straight line segments at each end of the curve
Fully correct curve with \(y\)-intercept labelled \(-2\)
B2
Partially correct curve with \(y\)-intercept labelled \(-2\)
B1
\(y\)-intercept labelled \((-2, 0)\) is incorrect and can score a maximum of B1
Ignore any numbers on the axes other than the \(y\)-intercept
\(y\)-intercept \((0, -2)\) stated does indicate the point \((0, -2)\)
Unlabelled notches do not indicate the point \((0, -2)\)
A table of values does not indicate the point \((0, -2)\)
Graph consisting only of straight lines
B0
A fully correct curve but point \((0, -2)\) is not indicated
B1
Partially correct curve with point \((0, -2)\) indicated
B1
Fully correct curve with point \((0, -2)\) indicated
B2
Partially correct curve with point \((0, -2)\) indicated
B1
Curve includes a negative gradient so not partially correct
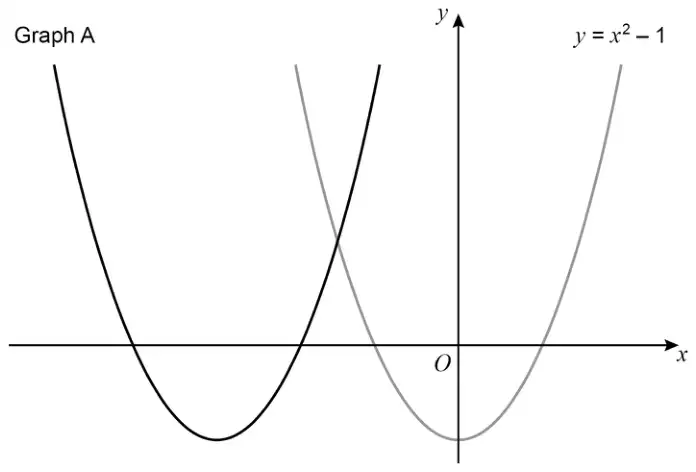
B3 for translation \(\begin{pmatrix} -3 \\ k \end{pmatrix}\) or translation \(\begin{pmatrix} k \\ -14 \end{pmatrix}\) OR M2 for [\(y =\)] \((x + 3)^2 - 5 - 3^2\) or better or M1 for [\(y =\)] \((x + 3)^2\) seen B1 for translation
If more than one transformation given then M2 maximum
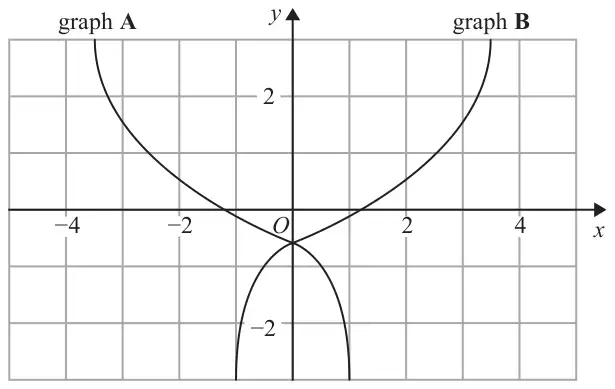
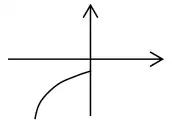
Other acceptable answers include: [The sketch is a] reflection of \(y = \sin x\) [in the \(x\)-axis]; First turning point should be a maximum; \(\sin x\) has a maximum at 90 [and then a minimum at 270].
(ii) eg. \(y = -\sin x\)
1
Accept any other possibly correct equations such as: \(y = -k \sin x\) or \(y = \sin(-x)\) or \(y = k\cos(x + 90)\)