5. A football team scores goals at an average rate of 1.8 goals per match.
(a) Give two assumptions that would be necessary to use a Poisson distribution to model the number of goals scored in a match by the team. (2)
Given that in their next match the team scores exactly 3 goals,
(b) find the exact probability that 2 of these goals were scored in the first half of the match. (4)
A hockey team plays 2 games each week during a 40-week season. Each game consists of 2 periods. The probability that the team concedes no goals in a period is 0.55
The random variable \(X\) represents the number of periods in a week in which the team concedes no goals.
(c)
(i) Write down a suitable distribution for \(X\)
(ii) For this 40-week season, use the Central Limit Theorem to estimate \(\mathrm{P}(\overline{X} \gt 2)\) (4)
Mark scheme (a)
Scheme
Marks
AO
One correct assumption in context from below
B1
3.5b
Two correct assumptions from below, with goals or matches mentioned at least once
Goals are scored at a constant rate
Goals are scored independently/randomlyormatches are independent
Goals are scored not scored simultaneouslyorGoals are scored singly
B1
3.5b
(2)
Notes
B1: One contextual correct assumption relating to independence/constant rate/singly Must mention goals or match, or equivalent context.
B1: Two correct contextual assumptions with goals/matches mentioned at least once. Assumptions relating to probability or number of goals are B0, but do not penalise if two correct assumptions also given.
Mark scheme (b)
Scheme
Marks
AO
\(A_{0.5} \sim \mathrm{Po}(0.9)\) and \(A_1 \sim \mathrm{Po}(1.8)\)
B1: Stating or using both correct Poisson distributions [0.164… or 0.365… implies \(\mathrm{Po}(0.9)\), 0.160… implies \(\mathrm{Po}(1.8)\). Both are required for this mark] or writing or using \(\mathrm{B}(3, 0.5)\)
M1: Correct use of conditional probability formula. Implied by \(\dfrac{0.164\ldots \times 0.365\ldots}{0.160\ldots}\) Or writing or using any binomial distribution and \(\mathrm{P}(X = 2)\)
M1: Correct expression with probabilities or writing or using \(\mathrm{B}(3, 0.5)\) and \(\mathrm{P}(X = 2)\)
A1: Correct exact answer. Do not award if there is clear evidence of rounding.
Mark scheme (c)
Scheme
Marks
AO
(i) \(X \sim \mathrm{B}(4, 0.55)\)
B1
3.3
(ii) \(\mathrm{E}(X) = \text{‘}4\text{’} \times \text{‘}0.55\text{’}\ [= 2.2]\) or \(\mathrm{Var}(X) = \text{‘}4\text{’} \times \text{‘}0.55\text{’} \times (1 - \text{‘}0.55\text{’})\ [= 0.99]\)
(ii) M1: Correct method to find the mean or variance of \(X\) (a mean of 2.2 from Poisson is M1) ft their \(n\) and \(p\)
M1: Correct approximate normal distribution [condone using \(X\) not \(\overline{X}\)]. Allow variance awrt 0.0248
A1: awrt 0.898 NB: awrt 0.898 implies the M1M1A1
AS June 2025 Q3
EdexcelAS paperCurrent spec11 marksIncludes hypothesis testingPoisson Distribution
3. Raoul, Steffi and Taro are catching butterflies for research.
The number of butterflies caught by Raoul per hour may be assumed to follow a Poisson distribution with mean 4.2
Find the probability that Raoul catches
(a)
(i) exactly 6 butterflies in a randomly selected one-hour period, (1)
(ii) exactly 1 butterfly in a randomly selected 10-minute period. (2)
Following a long period without rain, Raoul believes there will now be a change to the rate at which he catches butterflies. To test his belief, he uses the random variable \(R\) to represent the number of butterflies he catches in a 4-hour period.
A hypothesis test is to be carried out to determine whether or not there is support for Raoul’s belief. The null hypothesis of the test will be rejected if \(R \leqslant 9\) or \(R \gt 25\)
(b) Stating the hypotheses clearly, find the actual level of significance of the test. (4)
The number of butterflies caught by Steffi per hour may be assumed to follow a Poisson distribution with mean 3.2
(c) Find the probability that in exactly 2 of the next 4 hours, Steffi catches less than or equal to 3 butterflies each hour. (3)
The number of butterflies caught by Taro per hour may be assumed to follow a Poisson distribution with mean 2.7
Steffi and Taro both go to catch butterflies in a field one day.
Taro models the total number of butterflies caught per hour with a Poisson distribution with mean 3.2 + 2.7 = 5.9
(d) State a condition that would be needed for Taro’s model to be valid. (1)
Actual level of significance [\(= 0.02896\ldots + 0.02230\ldots\)] = awrt 0.0513
A1
1.1b
(4)
Notes
B1: Both hypotheses correct in terms of \(\lambda\) or \(\mu\) Allow 4.2 or 16.8
M1: Writing or using a \(\mathrm{Po}(16.8)\) model (may be implied by awrt 0.029 or awrt 0.022 or awrt 0.98)
A1: Either correct tail probability awrt 0.029 or awrt 0.022
A1: Correct level of significance awrt 0.0513 (allow equivalent percentage but isw once a correct answer is seen)
Mark scheme (c)
Scheme
Marks
AO
\(\mathrm{P}(S \leqslant 3) = 0.6025\ldots\)
B1
1.1b
\(J \sim \mathrm{B}(4, \text{“}0.6025\ldots\text{”})\) or \(6 \times (\text{“}0.6025\text{”})^2(1 - \text{“}0.6025\text{”})^2\)
M1
3.3
\(\mathrm{P}(J = 2) = 0.34413\ldots\) awrt 0.344
A1
1.1b
(3)
Notes
B1: awrt 0.603 (may be implied by a correct answer awrt 0.344)
M1: Writing or using \(\mathrm{B}(4, \text{“}0.6025\ldots\text{”})\) where “their 0.6025…” must be a probability
A1: awrt 0.344
Mark scheme (d)
Scheme
Marks
AO
Only valid if they are catchingbutterfliesindependently of each other
B1
3.5b
(1)
(11 marks)
Notes
B1: A correct comment in context on the validity of the model which must include underlined words or equivalent Ignore extraneous non-contradictory comments.
M1: Realising \(T = 7\), 11 (and 14) are needed If extra incorrect totals are stated, then M0
M1: Attempting \(\mathrm{P}(T = 7)\) and \(\mathrm{P}(T = 11)\) (at least one correct or both with missing ×2) May be embedded in the calculation for \(\mathrm{E}(T)\), eg \(7 \times 2 \times 0.6 \times 0.3 + 11 \times 2 \times 0.6 \times 0.1 + \ldots\)
M1: Attempting \(\mathrm{E}(T)\) for their values with at least 2 non-zero products for two of the \(T\) values correct or correct ft eg \(7 \times 0.18 + 7 \times 0.18\) only counts as 1 product Must be for their totals, simply calculating \(\mathrm{E}(X) = 2 \times 0.6 + 5 \times 0.3 + 9 \times 0.1\) here is M0
A1: 4.68 oe Correct answer with no obvious incorrect working scores 4 out of 4
Mark scheme (d)
Scheme
Marks
AO
\(Y \sim \mathrm{B}(150, 0.06)\)
M1
3.3
\(\approx \mathrm{Po}(9)\)
M1
1.1b
\(\mathrm{P}(Y = 4) \approx 0.0337\)
A1
3.4
(3)
(12 marks)
Notes
M1: Selecting the correct binomial model (may be implied by sight of \(\mathrm{Po}(9)\))
M1: Writing or using \(\mathrm{Po}(9)\) allow ft \(\mathrm{Po}(np)\) from their stated binomial distribution
2. The number of errors made by a secretary is modelled by a Poisson distribution with a mean of 2.4 per 100 words.
A 100-word piece of work completed by the secretary is selected at random.
(a) Find the probability that
(i) there are exactly 3 errors,
(ii) there are fewer than 2 errors. (2)
After a long holiday, a randomly selected piece of work containing 250 words completed by the secretary is examined to see if the rate of errors has changed.
(b) Stating your hypotheses clearly, and using a 5% level of significance, find the critical region for a suitable test. (4)
(c) Find \(\mathrm{P}(\text{Type I error})\) for the test in part (b) (1)
\(\mathrm{P}(E \leqslant 1) = 0.0174\) or \(\mathrm{P}(E \leqslant 2) = 0.0620\) and \(\mathrm{P}(E \leqslant 11) = 0.980\) or \(\mathrm{P}(E \geqslant 12) = 0.0201\)
M1
3.4
Critical region: \(E \leqslant 1\) or \(E \geqslant 12\)
A1
1.1b
(4)
Notes
B1 for both hypotheses correct in terms of \(\lambda\) or \(\mu\) (allow \(\lambda = 6\) etc)
1st M1 for selecting the correct model. Sight or use of \(\mathrm{Po}(6)\)
2nd M1 for use of the correct model with two probs correct to 2.s.f. (accept \(\mathrm{P}(E \geqslant 12) = 0.02\)) Must see attempt at lower and upper limit. Probabilities may be seen in (c).
A1 for correct critical region (both parts). Allow \(E \leqslant 1\) and \(E \geqslant 12\) or \(E \leqslant 1, E \geqslant 12\) etc Writing CR as probability statements is A0 NB: Completely correct CR implies M1M1A1
SC: 1-tailed test B0 as hypotheses are incorrect M1 for sight or use of \(\mathrm{Po}(6)\) M1 (dep on \(\mathrm{H}_1\)) for sight of \(\mathrm{P}(E \leqslant 1) = 0.0174\) or \(\mathrm{P}(E \geqslant 11) = 0.0426\), in line with their \(\mathrm{H}_1\) A1 for CR: \(E \leqslant 1\) or CR: \(E \geqslant 11\), in line with their hypotheses
B1ft for 0.0375 or 0.0374 or summing their two appropriate probs (ft their CR) NB: If candidate uses a 1-tailed test, this mark cannot be gained
AS June 2024 Q2
EdexcelAS paperCurrent spec13 marksIncludes hypothesis testingPoisson Distribution
2. A manager keeps a record of accidents in a canteen.
Accidents occur randomly with an average of 2.7 per month. The manager decides to model the number of accidents with a Poisson distribution.
(a) Give a reason why a Poisson distribution could be a suitable model in this situation. (1)
(b) Assuming that a Poisson model is suitable, find the probability of
(i) at least 3 accidents in the next month, (1)
(ii) no more than 10 accidents in a 3-month period, (2)
(iii) at least 2 months with no accidents in an 8-month period. (4)
One day, two members of staff bump into each other in the canteen and each report the accident to the manager. The canteen manager is unsure whether to record this as one or two accidents.
Given that the manager still wants to model the number of accidents per month with a Poisson distribution,
(c) state
a property of the Poisson distribution that the manager should consider when deciding how to record this situation
whether the manager should record this as one or two accidents
(1)
The manager introduces some new procedures to try and reduce the average number of accidents per month.
During the following 12 months the total number of accidents is 22 The manager claims that the accident rate has been reduced.
(d) Use a 5% level of significance to carry out a suitable test to assess the manager’s claim. You should state your hypotheses clearly and the p-value used in your test. (4)
Mark scheme (a)
Scheme
Marks
AO
Since accidents occur randomly/independently / at a constant/average rate
B1
2.4
(1)
Notes
B1 for a suitable reason picking up the underlined words from the context.
Mark scheme (b)
Scheme
Marks
AO
(i) [\(A\) = no. of accidents in a month. \(A \sim \mathrm{Po}(2.7)\)] [\(\mathrm{P}(A \geqslant 3) = 1 - \mathrm{P}(A \leqslant 2) = 1 - 0.49362\ldots = 0.50637\ldots =\)] awrt 0.506
B1
1.1b
(1)
(ii) [\(T\) = no. of accidents in a 3-month period.] \(T \sim \mathrm{Po}(3 \times 2.7 = [8.1])\)
(ii) M1 for selecting the \(\mathrm{Po}(8.1)\) model (sight of or implied by a correct answer)
A1 for awrt 0.806
(iii) 1st M1 for selecting a suitable binomial model e.g. \(\mathrm{B}(8, p)\) or \(\mathrm{B}(n, 0.067\ldots)\)
1st A1 for the correct model (\(p = \mathrm{e}^{-2.7}\) or 0.067 or better) seen or implied by a correct answer.
2nd M1 for using their binomial model to attempt \(\mathrm{P}(M \geqslant 2)\) or \(1 - \mathrm{P}(M \leqslant 1)\) awrt 0.0964 is evidence for this M1 mark
2nd A1 for awrt 0.0965
Mark scheme (c)
Scheme
Marks
AO
For a Poisson model accidents (events) must occur singly/independently so manager should record as one accident
B1
3.5b/2.4
(1)
Notes
B1 for stating the accidents (events) “occur singly” oe or accidents (events) are “independent” AND should record as one accident
[\(Y\) = no. of accidents in a year.] \(Y \sim \mathrm{Po}(32.4)\)
M1
3.3
\(\mathrm{P}(Y \leqslant 22) = 0.03512\ldots\)
A1
3.4
[Significant result so reject \(\mathrm{H}_0\)] there is evidence to support the manager’s claim / there is evidence that the number of accidents per month has decreased
A1
2.2b
(4)
(13 marks)
Notes
B1 for both correct hypotheses in terms of \(\lambda\) or \(\mu\) (accept \(\mu = 2.7\) etc)
M1 for selecting the correct model (sight of or implied by the correct probability) \(\mathrm{P}(Y = 22) =\) awrt 0.0129 is evidence for M1
1st A1 for awrt 0.035 (accept 0.04 if \(\mathrm{P}(Y \leqslant 22)\) and \(\mathrm{Po}(32.4)\) are explicitly seen)
2nd A1 dep on M1A1 indep of hyp’s for a correct conclusion in context number of accidents reduced is A0 must be rate / per month / average number
AS June 2023 Q3
EdexcelAS paperCurrent spec16 marksIncludes hypothesis testingPoisson Distribution
3. A machine produces cloth. Faults occur randomly in the cloth at a rate of 0.4 per square metre.
The machine is used to produce tablecloths, each of area \(A\) square metres. One of these tablecloths is taken at random.
The probability that this tablecloth has no faults is 0.0907
(a) Find the value of \(A\) (3)
The tablecloths are sold in packets of 20
A randomly selected packet is taken.
(b) Find the probability that more than 1 of the tablecloths in this packet has no faults. (3)
A hotel places an order for 100 tablecloths each of area \(A\) square metres.
The random variable \(X\) represents the number of these tablecloths that have no faults.
(c) Find
(i) \(\mathrm{E}(X)\)
(ii) \(\mathrm{Var}(X)\) (3)
(d) Use a Poisson approximation to estimate \(\mathrm{P}(X = 10)\) (2)
It is claimed that a new machine produces cloth with a rate of faults that is less than 0.4 per square metre.
A piece of cloth produced by this new machine is taken at random. The piece of cloth has area 30 square metres and is found to have 6 faults.
(e) Stating your hypotheses clearly, use a suitable test to assess the claim made for the new machine. Use a 5% level of significance. (4)
(f) Write down the p-value for the test used in part (e). (1)
Mark scheme (a)
Scheme
Marks
AO
[\(F\) = no of faults in \(A\) m2] \(F \sim \mathrm{Po}(A \times 0.4)\)
(i) M1 for \(X \sim \mathrm{B}(100, 0.0907)\) used, or seen if only distribution in (c). May be implied by correct \(\mathrm{E}(X)\) or \(\mathrm{Var}(X)\)
A1 for 9.07
(ii) A1 for awrt 8.25 SC - award M0A1A0 for:
using \(X \sim \mathrm{B}(100, 0.4)\) leading to \(\mathrm{E}(X) = 40\), \(\mathrm{Var}(X) = 24\)
using \(X \sim \mathrm{B}(100, p)\), \(0 \lt p \lt 1\) and \(\mathrm{E}(X) = 100p\), \(\mathrm{Var}(X) = 100p(1-p)\)
Mark scheme (d)
Scheme
Marks
AO
\(X \approx\ \sim \mathrm{Po}(9.07)\);
M1
3.4
\(\mathrm{P}(X = 10) \approx 0.11947\ldots\) 0.1195 or awrt 0.119
A1
1.1b
(2)
Notes
M1 for selecting the correct Poisson model – ft their answer to (c)(i)
2. Telephone calls arrive at a call centre randomly, at an average rate of 1.7 per minute. After the call centre was closed for a week, in a random sample of 10 minutes there were 25 calls to the call centre.
(a) Carry out a suitable test to determine whether or not there is evidence that the rate of calls arriving at the call centre has changed. Use a 5% level of significance and state your hypotheses clearly. (4)
Only 1.2% of the calls to the call centre last longer than 8 minutes.
One day Tiang has 70 calls.
(b) Find the probability that out of these 70 calls Tiang has more than 2 calls lasting longer than 8 minutes. (3)
The call centre records show that 95% of days have at least one call lasting longer than 30 minutes. On Wednesday 900 calls arrived at the call centre and none of them lasted longer than 30 minutes.
(c) Use a Poisson approximation to estimate the proportion of calls arriving at the call centre that last longer than 30 minutes. (4)
[\(0.04.. \gt 0.025\) / 25 is not in CR so not significant] insufficient evidence of a change in rate of calls
A1
2.2b
(4)
Notes
B1 for both hypotheses correct which must be attached to \(\mathrm{H}_0\) and \(\mathrm{H}_1\) must be in terms of \(\lambda\) or \(\mu\) allow either 1.7 or 17
M1 for stating or using the correct Poisson model. may be implied by sight of awrt 0.0406/7 or awrt 0.959 or 0.9747… or better
1st A1 for correct prob of awrt 0.04 or for correct CR found \(X \geqslant 27\) (\(X \gt 26\)) (ignore lower tail CR if found) allow CV \(X = 27\)
2nd A1 (dep on M1A1) for a correct conclusion in context mentioning “rate of calls” o.e. Allow e.g. ‘The rate of calls is 1.7 per minute/17 per 10 minutes’ Must be rate o.e. not “number” A0 if inconsistent comments are seen e.g. “reject \(\mathrm{H}_0\), no change in rate of calls”
Mark scheme (b)
Scheme
Marks
AO
[\(T\) = no. of calls longer than 8 minutes] \(\quad T \sim \mathrm{B}(70, 0.012)\)
1st M1 for sight or use of \(\mathrm{Po}(900p)\) (as a suitable approx. to \(\mathrm{B}(900, p)\)) (may be implied by correct answer awrt 0.00333)
2nd M1 for a correct equation in \(p\) or correct use of \(\mathrm{P}(C = 0)\) from Po e.g. \(\mathrm{e}^{-\lambda} = 0.05\)
3rd M1 for a correct method to solve for \(p\) (allow \(p = \pm\ln(0.05)/900\)) or to solve for \(\lambda\), i.e. \(\lambda =\) awrt 3(.00)
A1 for \(p\) = awrt 0.00333 Must see Po used condone \(\dfrac{1}{300}\) o.e. Allow standard form (awrt \(3.33 \times 10^{-3}\)) or percentage (awrt 0.333%)
SC: Use of Binomial gives 0.003323… awrt 0.00332 scores M0M0M0A1
3. During the summer, mountain rescue team \(A\) receives calls for help randomly with a rate of 0.4 per day.
(a) Find the probability that during the summer, mountain rescue team \(A\) receives at least 19 calls for help in 28 randomly selected days. (2)
The leader of mountain rescue team \(A\) randomly selects 250 summer days from the last few years. She records the number of calls for help received on each of these days.
(b) Using a Poisson approximation, estimate the probability of the leader finding at least 20 of these days when more than 1 call for help was received by mountain rescue team \(A\). (4)
Mountain rescue team \(A\) believes that the number of calls for help per day is lower in the winter than in the summer. The number of calls for help received in 42 randomly selected winter days is 8
(c) Use a suitable test, at the 5% level of significance, to assess whether or not there is evidence that the number of calls for help per day is lower in the winter than in the summer. State your hypotheses clearly. (4)
During the summer, mountain rescue team \(B\) receives calls for help randomly with a rate of 0.2 per day, independently of calls to mountain rescue team \(A\).
The random variable \(C\) is the total number of calls for help received by mountain rescue teams \(A\) and \(B\) during a period of \(n\) days in the summer. On a Monday in the summer, mountain rescue teams \(A\) and \(B\) each receive a call for help.
Given that over the next \(n\) days \(\mathrm{P}(C = 0) \lt 0.001\)
(d) calculate the minimum value of \(n\) (3)
(e) Write down an assumption that needs to be made for the model to be appropriate. (1)
Mark scheme (a)
Scheme
Marks
AO
\(W \sim \mathrm{Po}(11.2)\) and \(\mathrm{P}(W \geqslant 19) = 1 - \mathrm{P}(W \leqslant 18)\) or suitable 3sf probs
[\(0.014 \lt 0.05\) or there is sufficient evidence to reject \(\mathrm{H}_0\)] There is sufficient evidence at the 5% level of significance that the number of calls received per day is lower in winter orrate of calls is lower in winter orless callsper day in winter (o.e.)
A1
2.2b
(4)
Notes
1st B1 Both hypotheses correct using \(\lambda\) or \(\mu\) and 16.8 or 0.4 [Accept their ans to \(0.4 \times 42\)]
2nd B1 Realising \(\mathrm{Po}(16.8)\) needs to be used. Sight or use of, implied by correct prob or CR
M1 For 0.014 or better (0.0141..) or CR \(X \leqslant 9\) oe must be CR and not probability. [Allow CR \(X \leqslant 10\) with probability \(\mathrm{P}(X \leqslant 10) = 0.054\) or better]
A1Indep of 1st B1 (must see 2nd B1 and M1 scored) for a correct inference in context
Mark scheme (d)
Scheme
Marks
AO
\(C \sim \mathrm{Po}(0.4 \times n + 0.2 \times n)\ [= \mathrm{Po}(0.6n)]\) or \(D \sim \mathrm{B}(n, \mathrm{e}^{-0.6}\) or awrt 0.549)
M1
3.1b
\(\mathrm{e}^{-0.6n} \lt 0.001\) or \(-0.6n \lt \ln(0.001)\) or \(n \gt 11.5\ldots\)
M1
1.1b
\(n = \underline{12}\)
A1
1.1b
(3)
Notes
1st M1 Selecting a suitable model. Sight of \(\mathrm{Po}(0.6n)\) or \(\mathrm{B}(n, \mathrm{e}^{-0.6})\) or implied by 2nd M1
2nd M1 For a correct inequality or equality involving \(n\) [Condone slips in solving] Allow MR i.e. misread of 0.01 for 0.001 (or similar) to score M1M1A0
A1 \(n = 12\) cao [Correct answer with no incorrect working seen scores 3/3]
Mark scheme (e)
Scheme
Marks
AO
The rate of calls per day is constantor the number of calls occurring in non-overlapping time intervals is independent. ornumber of calls per day is independent (o.e.)
B1
2.4
(1)
Total 14
Notes
B1 Allow equivalent statements. Underlined words required.
AS June 2022 Q2
EdexcelAS paperCurrent spec10 marksIncludes hypothesis testingPoisson Distribution
2. Xena catches fish at random, at a constant rate of 0.6 per hour.
(a) Find the probability that Xena catches exactly 4 fish in a 5-hour period. (2)
The probability of Xena catching no fish in a period of \(t\) hours is less than 0.16
(b) Find the minimum value of \(t\), giving your answer to one decimal place. (3)
Independently of Xena, Zion catches fish at random with a mean rate of 0.8 per hour.
Xena and Zion try using new bait to catch fish. The number of fish caught in total by Xena and Zion after using the new bait, in a randomly selected 4-hour period, is 12
(c) Use a suitable test to determine, at the 5% level of significance, whether or not there is evidence that the rate at which fish are caught has increased after using the new bait. State your hypotheses clearly and the p-value used in your test. (5)
Mark scheme (a)
Scheme
Marks
AO
\(X \sim \mathrm{Po}(3)\)
M1
3.3
\(\mathrm{P}(X = 4) = 0.1680\ldots\)
A1
1.1b
(2)
Notes
M1: Writing or using \(\mathrm{Po}(3)\)
A1: awrt 0.168
Mark scheme (b)
Scheme
Marks
AO
\(\mathrm{e}^{-0.6 \times t} \lt 0.16\) oe
M1
3.1b
\(-0.6 \times t \lt \ln 0.16\)
dM1
1.1b
[\(t \gt 3.054\ldots\)] \(t = 3.1\)
A1
1.1b
(3)
Notes
M1: Forming a correct equation from the information given. Condone \(\mathrm{e}^{-0.6 \times t} = 0.16\) or finding \(\mathrm{P}(X = 0)\) for [\(t = 3.1\)] 0.155… and [\(t = 3\)] 0.165… or \(\mathrm{P}(X = 0)\) for [\(\lambda = 1.84\)] 0.158… and [\(\lambda = 1.83\)] 0.1604…
dM1: Dependent on the 1st method mark. A correct method to solve their inequality/equation. Or [\(t = 3.05\)] 0.1604 or [\(\lambda = 1.835\)] 0.159…
\(0.01(24) \lt 0.05\) or \(12 \gt 11\) or 12 is in the critical region or 12 is significant or Reject \(\mathrm{H}_0\). There is evidence at the 5% level of significance that the rate of fish caught may have increased.
A1
2.2b
(5)
(10 marks)
Notes
B1: Both hypotheses in terms of \(\lambda\) or \(\mu\). Allow 5.6 instead of 1.4
B1: Writing or using \(\mathrm{Po}(5.6)\)
M1: For writing or using \(1 - \mathrm{P}(J \leqslant 11)\) Implied by a correct probability or CR Allow \(\mathrm{P}(J \leqslant 10) =\) awrt 0.972 and \(\mathrm{P}(J \leqslant 9) =\) awrt 0.941
A1: 0.01 or better (allow truncation eg 0.0124)
NB Allow M1 A1 if \(\mathrm{P}(J \leqslant 11) = 0.9875\ldots\) is written on its own
A1: Independent of hypotheses. A correct conclusion based on their probability with 0.05 conclusion in context (bold words) Do not accept contradicting statements.
4. Members of a photographic group may enter a maximum of 5 photographs into a members only competition. Past experience has shown that the number of photographs, \(N\), entered by a member follows the probability distribution shown below.
\(n\)
0
1
2
3
4
5
\(\mathrm{P}(N = n)\)
\(a\)
0.2
0.05
0.25
\(b\)
\(c\)
Given that \(\mathrm{E}(4N + 2) = 14.8\) and \(\mathrm{P}(N = 5 \mid N \gt 2) = \dfrac{1}{2}\)
(a) show that \(\mathrm{Var}(N) = 2.76\) (6)
The group decided to charge a 50p entry fee for the first photograph entered and then 20p for each extra photograph entered into the competition up to a maximum of £1 per person. Thus a member who enters 3 photographs pays 90p and a member who enters 4 or 5 photographs just pays £1
Assuming that the probability distribution for the number of photographs entered by a member is unchanged,
(b) calculate the expected entry fee per member. (3)
Bai suggests that, as the mean and variance are close, a Poisson distribution could be used to model the number of photographs entered by a member next year.
(c) State a limitation of the Poisson distribution in this case. (1)
Mark scheme (a)
Scheme
Marks
AO
\(4\mathrm{E}(N) + 2 = 14.8\) or \(\mathrm{E}(N) = 3.2\)
M1
3.1a
\(0.2 + 0.1 + 0.75 + 4b + 5c = 3.2\)
M1
1.1b
\(\dfrac{c}{0.25 + b + c} = 0.5\) or \(0.25 = c - b\)
2. On a weekday, a garage receives telephone calls randomly, at a mean rate of 1.25 per 10 minutes.
(a) Show that the probability that on a weekday at least 2 calls are received by the garage in a 30-minute period is 0.888 to 3 decimal places. (2)
(b) Calculate the probability that at least 2 calls are received by the garage in fewer than 4 out of 6 randomly selected, non-overlapping 30-minute periods on a weekday. (2)
The manager of the garage randomly selects 150 non-overlapping 30-minute periods on weekdays. She records the number of calls received in each of these 30-minute periods.
(c) Using a Poisson approximation show that the probability of the manager finding at least 3 of these 30-minute periods when exactly 8 calls are received by the garage is 0.664 to 3 significant figures. (4)
(d) Explain why the Poisson approximation may be reasonable in this case. (1)
The manager of the garage decides to test whether the number of calls received on a Saturday is different from the number of calls received on a weekday. She selects a Saturday at random and records the number of telephone calls received by the garage in the first 4 hours.
(e) Write down the hypotheses for this test. (1)
The manager found that there had been 40 telephone calls received by the garage in the first 4 hours.
(f) Carry out the test using a 5% level of significance. (4)
M1: For calculating the mean and setting up the correct model. Poisson may be implied by 0.8883 or better or 1 – awrt 0.1117 but must see 3.75 or \(1.25 \times 3\)
A1*cso: \(\mathrm{P}(C \geqslant 2) =\) awrt 0.8883 or 1 – awrt 0.1117 = 0.888 Must see \(\mathrm{P}(C \geqslant 2)\) oe
\(0.046\ldots \gt 0.025\) or no evidence to reject \(\mathrm{H}_0\) There is insufficient evidence at the 5% level of significance that the number of calls received is different on a Saturday
A1
2.2b
(4)
(14 marks)
Notes
B1: Realising \(\mathrm{Po}(30)\) needs to be used. NB Implied by correct answer or \(\mathrm{P}(X = 40) = 0.0139\ldots\)
M1: Writing or using \(1 - \mathrm{P}(X \leqslant 39)\) or if CR method for \(\mathrm{P}(X \geqslant 42) = 0.0221\ldots\)
A1: 0.04… or awrt 0.05 or CR \(X \geqslant 42\) oe must be CR and not probability
A1: A fully correct solution and correct inference in context. Calls required If put this prob but then give Cr X >= 40 M1A1A0
AS October 2020 Q4
EdexcelAS paperCurrent spec8 marksIncludes hypothesis testingPoisson Distribution
4. During the morning, the number of cyclists passing a particular point on a cycle path in a 10-minute interval travelling eastbound can be modelled by a Poisson distribution with mean 8
The number of cyclists passing the same point in a 10-minute interval travelling westbound can be modelled by a Poisson distribution with mean 3
(a) Suggest a model for the total number of cyclists passing the point on the cycle path in a 10-minute interval, stating a necessary assumption. (2)
Given that exactly 12 cyclists pass the point in a 10-minute interval,
(b) find the probability that at least 11 are travelling eastbound. (3)
After some roadworks were completed, the total number of cyclists passing the point in a randomly selected 20-minute interval one morning is found to be 14
(c) Test, at the 5% level of significance, whether there is evidence of a decrease in the rate of cyclists passing the point. State your hypotheses clearly. (3)
Mark scheme (a)
Scheme
Marks
AO
[\(X \sim \mathrm{Po}(8) \qquad Y \sim \mathrm{Po}(3)\)] [\(X + Y \sim\)] \(\mathrm{Po}(11)\)
B1
3.3
The number of cyclists travelling eastbound is independent of the number of cyclists travelling westbound.
B1
3.5b
(2)
Notes
B1: Correct model
B1: Correct modelling assumption in context (must mention cyclists oe)
2. The discrete random variables \(W\), \(X\) and \(Y\) are distributed as follows
\[W \sim \mathrm{B}(10, 0.4) \qquad\qquad X \sim \mathrm{Po}(4) \qquad\qquad Y \sim \mathrm{Po}(3)\]
(a) Explain whether or not \(\mathrm{Po}(4)\) would be a good approximation to \(\mathrm{B}(10, 0.4)\) (1)
(b) State the assumption required for \(X + Y\) to be distributed as \(\mathrm{Po}(7)\) (1)
Given the assumption in part (b) holds,
(c) find \(\mathrm{P}(X + Y \lt \mathrm{Var}(W))\) (2)
Mark scheme (a)
Scheme
Marks
AO
requires large \(n\)/small \(p\) so not a good approximation
B1
3.5b
(1)
Notes
B1: Correct reason why the model would not be appropriate and correct conclusion. Condone e.g. ‘\(p\) is close to 0.5’ for \(p\) is not small. Mean is not equal to variance on its own in B0.
1. The number of customers entering Jeff’s supermarket each morning follows a Poisson distribution.
Past information shows that customers enter at an average rate of 2 every 5 minutes.
Using this information,
(a)
(i) find the probability that exactly 26 customers enter Jeff’s supermarket during a randomly selected 1-hour period one morning, (2)
(ii) find the probability that at least 21 customers enter Jeff’s supermarket during a randomly selected 1-hour period one morning. (2)
A rival supermarket is opened nearby. Following its opening, the number of customers entering Jeff’s supermarket over a randomly selected 40-minute period is found to be 10
(b) Test, at the 5% significance level, whether or not there is evidence of a decrease in the rate of customers entering Jeff’s supermarket. State your hypotheses clearly. (4)
A further randomly selected 20-minute period is observed and the hypothesis test is repeated. Given that the true rate of customers entering Jeff’s supermarket is now 1 every 5 minutes,
(c) calculate the probability of a Type II error. (5)
Not significant / Do not reject \(\mathrm{H}_0\) / 10 is not in the CR
M1
1.1b
There is not sufficient evidence to suggest a decrease/change in the rate of customers entering Jeff’s supermarket.
A1
2.2b
(4)
Notes
B1: Both hypotheses correct (must use \(\mu\) or \(\lambda\))
B1: awrt 0.0774 Allow awrt 0.08 from a correct probability statement. allow CR: \(X \leqslant 9\)
M1: Correct non-contextual conclusion (may be implied by correct contextual conclusion). Allow a f.t. comparison of ‘their \(p\)’ with 0.05 (Ignore any contradictory contextual comments for this mark)
A1: A fully correct solution drawing a correct inference in context with all previous marks in (b) scored.
Mark scheme (c)
Scheme
Marks
AO
Use of \(\mathrm{Po}(8)\) to attempt critical region
M1
2.1
Critical region is \(Y \leqslant 3\) / \(\mathrm{H}_0\) is not rejected when \(Y \geqslant 4\)
M1: Use of \(\mathrm{Po}(8)\) to attempt critical region [\(\mathrm{P}(Y \leqslant 3) = 0.0423..\ \ \mathrm{P}(Y \leqslant 4) = 0.0996..\)]
A1: Finding critical region for the test \(Y \leqslant 3\) which must come from \(\mathrm{Po}(8)\).
B1: Identifying the need to use \(\mathrm{Po}(4)\) as the true distribution. Allow \(\mathrm{Po}(4)\) seen or used for this mark.
M1: Writing or using \(\mathrm{P}(W \geqslant \text{‘}4\text{’})\) or \(1 - \mathrm{P}(W \leqslant \text{‘}3\text{’})\) from \(\mathrm{Po}(4)\). Allow f.t. on their identified CR but must be using \(\mathrm{Po}(4)\)
1. A plumbing company receives call-outs during the working day at an average rate of 2.4 per hour.
(a) Find the probability that the company receives exactly 7 call-outs in a randomly selected 3-hour period of a working day. (2)
The company has enough staff to respond to 28 call-outs in an 8-hour working day.
(b) Show that the probability that the company receives more than 28 call-outs in a randomly selected 8-hour working day is 0.022 to 3 decimal places. (2)
In a random sample of 100 working days each of 8 hours,
(c)
(i) find the expected number of days that the company receives more than 28 call-outs, (1)
(ii) find the standard deviation of the number of days that the company receives more than 28 call-outs, (2)
(iii) use a Poisson approximation to estimate the probability that the company receives more than 28 call-outs on at least 6 of these days. (3)
5. Information was collected about accidents on the Seapron bypass. It was found that the number of accidents per month could be modelled by a Poisson distribution with mean 2.5
Following some work on the bypass, the numbers of accidents during a series of 3-month periods were recorded. The data were used to test whether or not there was a change in the mean number of accidents per month.
(a) Stating your hypotheses clearly and using a 5% level of significance, find the critical region for this test. You should state the probability in each tail. (5)
(b) State \(\mathrm{P}(\text{Type I error})\) using this test. (1)
Data from the series of 3-month periods are recorded for 2 years.
(c) Find the probability that at least 2 of these 3-month periods give a significant result. (3)
Given that the number of accidents per month on the bypass, after the work is completed, is actually 2.1 per month,
(d) find \(\mathrm{P}(\text{Type II error})\) for the test in part (a) (3)
Giving Critical region of: \(\boldsymbol{X \leqslant 2}\)
A1
1.1b
\(\boldsymbol{X \geqslant 14}\)
A1
1.1b
(5)
Notes
B1 for both hypotheses in terms of \(\lambda\) or \(\mu\) (either way around)
1st M1 for selecting the correct Po model. Sight or use of \(\mathrm{Po}(7.5)\) may be implied by 2nd M1
2nd M1 for using the correct model to find one of these probs with correct label (2sf or better)
1st A1 for one end correct
2nd A1 for a fully correct CR Allow any letter, even CR \(\leqslant 2\) or set notation but not \(\mathrm{P}(X \leqslant 2)\) Can have \(X \lt 3\) and \(X \gt 13\) etc
2nd M1 for a correct probability statement using their Poisson model and their CR in (a) which may have just one tail.
A1 for awrt 0.945
AS June 2019 Q3
EdexcelAS paperCurrent spec13 marksIncludes hypothesis testingPoisson Distribution
3. Andreia’s secretary makes random errors in his work at an average rate of 1.7 errors every 100 words.
(a) Find the probability that the secretary makes fewer than 2 errors in the next 100-word piece of work. (2)
Andreia asks the secretary to produce a 250-word article for a magazine.
(b) Find the probability that there are exactly 5 errors in this article. (2)
Andreia offers the secretary a choice of one of two bonus schemes, based on a random sample of 40 pieces of work each consisting of 100 words.
In scheme A the secretary will receive the bonus if more than 10 of the 40 pieces of work contain no errors.
In scheme B the bonus is awarded if the total number of errors in all 40 pieces of work is fewer than 56
(c) Showing your calculations clearly, explain which bonus scheme you would advise the secretary to choose. (5)
Following the bonus scheme, Andreia randomly selects a single 500-word piece of work from the secretary to test if there is any evidence that the secretary’s rate of errors has decreased.
(d) Stating your hypotheses clearly and using a 5% level of significance, find the critical region for this test. (4)
Mark scheme (a)
Scheme
Marks
AO
[\(X =\) number of errors in 100-word piece] \(X \sim \mathrm{Po}(1.7)\)
Scheme B: Let \(B \sim \mathrm{Po}(40 \times 1.7)\) or \(\mathrm{Po}(68)\) \(\mathrm{P}(B \lt 56) = \mathrm{P}(B \leqslant 55) = 0.061133\ldots\)
M1
3.3
So choose scheme A (since the probability of a bonus is greater)
A1
2.4
(5)
Notes
1st M1 for choosing a correct model for scheme A i.e. \(\mathrm{B}(40, \mathrm{P}(X = 0))\), where \(X \sim \mathrm{Po}(1.7)\) Allow use of awrt 0.183 for \(\mathrm{P}(X = 0)\) … 0.183 gives answer awrt 0.101 Condone \(\mathrm{B}(0.183, 40)\) (o.e.) if it leads to a prob rounding to range (0.09~0.1) otherwise M0
2nd M1 for \(1 - \mathrm{P}(A \leqslant 10)\)
1st A1 for awrt 0.0996 [NB use of 0.183 will give awrt 0.101 and scores M1M1A0]
3rd M1 for selecting a correct Poisson model for scheme B i.e. \(\mathrm{Po}(40 \times 1.7)\) or better
2nd A1 for a correct conclusion based on comparing two probs: awrt 0.1 vs 0.061 or better So can allow 0.1 > 0.061 leading to choosing A [Probably scores M1M1A0M1A1]
NB [ Normal approx.(not on spec) leading to \(0.06477\ldots\) might score 3rd M1 if \(\mathrm{Po}(68)\) seen but 2nd A0]
B1 for both hypotheses in terms of \(\lambda\) or \(\mu\) (can be interchanged)
M1 for selecting \(\mathrm{Po}(8.5)\) (sight of or use of e.g. may be implied by 1st A1)
1st A1 for some evidence of correct use of \(\mathrm{Po}(8.5)\) i.e. either of these probs (2dp or better) May be implied by a correct critical region
2nd A1 for a correct critical region. Allow \(E \lt 4\) and allow any letter for \(E\). Two different regions (e.g. from 2 tail test) is 2nd A0
SC Use of binomial throughout: (with hypotheses \(\mathrm{H}_0: p = 0.017\) and \(\mathrm{H}_1: p \lt 0.017\) in (d)) Scores 0 in (a) 0 in (b) possibly just 2nd M1 in (c) But allow all 4 marks in (d): B1 hypotheses, M1 for \(Y \sim \mathrm{B}(500, 0.017)\), 1st A1 for \(\mathrm{P}(Y \leqslant 3) = 0.02913\ldots\) or \(\mathrm{P}(Y \leqslant 4) = 0.07266\ldots\) 2nd A1 \(Y \leqslant 3\) Allow probs to be to 2dp or better so 0.03 and 0.07 as in main scheme.
2. Indre works on reception in an office and deals with all the telephone calls that arrive. Calls arrive randomly and, in a 4-hour morning shift, there are on average 80 calls.
(a) Using a suitable model, find the probability of more than 4 calls arriving in a particular 20-minute period one morning. (3)
Indre is allowed 20 minutes of break time during each 4-hour morning shift, which she can take in 5-minute periods. When she takes a break, a machine records details of any call in the office that Indre has missed.
One morning Indre took her break time in 4 periods of 5 minutes each.
(b) Find the probability that in exactly 3 of these periods there were no calls. (2)
On another occasion Indre took 1 break of 5 minutes and 1 break of 15 minutes.
(c) Find the probability that Indre missed exactly 1 call in each of these 2 breaks. (3)
Mark scheme (a)
Scheme
Marks
AO
{Let \(C\) = no of calls in a 20 min period} \(C \sim \mathrm{Po}(\ldots)\)
M1
3.3
80 calls per 4-hour period gives \(\dfrac{20}{3}\) per 20 mins i.e. \(C \sim \mathrm{Po}\left(\dfrac{20}{3}\right)\) \([\mathrm{P}(C \gt 4)] = 1 - \mathrm{P}(C \leqslant 4)\)
M1
3.4
\(= 0.79437\ldots\) awrt 0.794
A1
1.1b
(3)
Notes
1st M1 for selecting a Poisson model – written or used. May be implied by 2nd M1 or a correct Answer.
2nd M1 for the correct Poisson \(\mathrm{Po}\left(\frac{20}{3}\right)\) or \(\mathrm{Po}(6.67)\) or better seen and writing or using \(1 - \mathrm{P}(C \leqslant 4)\)
A1 for awrt 0.794 (correct ans with no incorrect working scores 3/3)
Mark scheme (b)
Scheme
Marks
AO
{\(X\) = no. of 5 min periods with no calls} \(X \sim \mathrm{B}\left(4, \mathrm{e}^{-\frac{5}{3}}\right)\)
M1 for selecting a correct model \(\mathrm{B}(4, 0.189)\) or better (calc: \(0.188875\ldots\))
A1 for using the model to get awrt 0.0219 (correct ans with no incorrect working scores 2/2)
Mark scheme (c)
Scheme
Marks
AO
P(exactly one call) \(\mathrm{e}^{-\frac{5}{3}} \times \dfrac{5}{3}\) or \(\mathrm{e}^{-5} \times 5\)
M1
2.1
P(exactly one call in each break) \(= \left(\mathrm{e}^{-\frac{5}{3}} \times \dfrac{5}{3}\right) \times \left(\mathrm{e}^{-5} \times 5\right)\)
M1
1.1b
\(= 0.0106052\ldots\) awrt 0.0106
A1
1.1b
(3)
(8 marks)
Notes
1st M1 for a correct prob of 1 call (expressions in e or values) (allow \(0.31479\ldots\) or awrt 0.315 or \(0.033689\ldots\) or awrt 0.0337)
2nd M1 for a correct probability statement or expression. E.g. \(\mathrm{P}\left(S = 1 \mid S \sim \mathrm{Po}\left(\frac{5}{3}\right)\right) \times \mathrm{P}(T = 1 \mid T \sim \mathrm{Po}(5))\)
SC e.g. \(F \sim \mathrm{Po}(\lambda)\) used in (b) to find \(\mathrm{P}(F = 0)\) Then if we see \(Y \sim \mathrm{Po}(3\lambda)\) and statement \(\mathrm{P}(F = 1) \times \mathrm{P}(Y = 1)\) award M0M1
A1 for awrt 0.0106 (correct ans with no incorrect working scores 3/3)
AS June 2018 Q2
EdexcelAS paperCurrent spec11 marksIncludes hypothesis testingPoisson Distribution
2. The number of heaters, \(H\), bought during one day from Warmup supermarket can be modelled by a Poisson distribution with mean 0.7
(a) Calculate \(\mathrm{P}(H \geqslant 2)\) (1)
The number of heaters, \(G\), bought during one day from Pumraw supermarket can be modelled by a Poisson distribution with mean 3, where \(G\) and \(H\) are independent.
(b) Show that the probability that a total of fewer than 4 heaters are bought from these two supermarkets in a day is 0.494 to 3 decimal places. (2)
(c) Calculate the probability that a total of fewer than 4 heaters are bought from these two supermarkets on at least 5 out of 6 randomly chosen days. (3)
December was particularly cold. Two days in December were selected at random and the total number of heaters bought from these two supermarkets was found to be 14
(d) Test whether or not the mean of the total number of heaters bought from these two supermarkets had increased. Use a 5% level of significance and state your hypotheses clearly. (5)
Mark scheme (a)
Scheme
Marks
AO
\(\mathrm{P}(H \geqslant 2) = 0.1558\) awrt 0.156
B1
1.1b
(1)
Notes
B1: awrt 0.156
Mark scheme (b)
Scheme
Marks
AO
\(H \sim \mathrm{Po}(0.7) \qquad G \sim \mathrm{Po}(3)\)
\(Y = H + G \rightarrow Y \sim \mathrm{Po}(3.7)\)
M1
3.4
\(\mathrm{P}(Y \leqslant 3) = 0.494\)*
A1cso*
1.1b
(2)
Notes
M1: For combining distributions and use of \(\mathrm{Po}(3.7)\)
A1*cso: \(\mathrm{P}(Y \leqslant 3) = 0.494\) we need to see \(\mathrm{P}(Y \leqslant 3)\) or \(\mathrm{P}(Y \lt 4)\) allow different letters.
\(0.0195 \lt 0.05\) or \(14 \geqslant 13\) or 14 is in the critical region or 14 is significant or Reject \(\mathrm{H}_0\). There is evidence at the 5% level of significance that the number of heaters brought in total from the two supermarkets has increased.
A1
2.2b
(5)
(11 marks)
Notes
B1: Both hypotheses correct using \(\lambda\) or \(\mu\). ft \(\text{“}3.7\text{”}\) from their 3.7 in part (b) and allow \(2 \times \text{“their 3.7”}\) Ignore any words
B1: Realising that \(\mathrm{Po}(2 \times \text{“their 3.7”})\) is to be used. This may be stated or used.
M1: writing or using \(1 - \mathrm{P}(J \leqslant 13)\) or \(1 - \mathrm{P}(J \lt 14)\) or if finding a CR for writing \(\mathrm{P}(J \geqslant 12) = 0.0735\ldots\) and \(\mathrm{P}(J \geqslant 13) = 0.0391\ldots\)
A1: awrt 0.0195 or CR \(J \geqslant 13\) or \(J \gt 12\)
A1: A fully correct solution and drawing a correct inference in context.
1. A researcher is investigating the distribution of orchids in a field. He believes that the Poisson distribution with a mean of 1.75 may be a good model for the number of orchids in each square metre. He randomly selects 150 non-overlapping areas, each of one square metre, and counts the number of orchids present in each square.
The results are recorded in the table below.
Number of orchids in each square metre
0
1
2
3
4
5
6
Number of squares
30
42
35
26
11
6
0
He calculates the expected frequencies as follows
Number of orchids in each square metre
0
1
2
3
4
5
More than 5
Number of squares
26.07
45.62
39.91
23.28
10.19
3.57
\(r\)
(a) Find the value of \(r\) giving your answer to 2 decimal places. (1)
The researcher will test, at the 5% level of significance, whether or not the data can be modelled by a Poisson distribution with mean 1.75
(b) State clearly the hypotheses required to test whether or not this Poisson distribution is a suitable model for these data. (1)
The test statistic for this test is 2.0 and the number of degrees of freedom to be used is 4
(c) Explain fully why there are 4 degrees of freedom. (2)
(d) Stating your critical value clearly, determine whether or not these data support the researcher’s belief. (2)
The researcher works in another field where the number of orchids in each square metre is known to have a Poisson distribution with mean 1.5
He randomly selects 200 non-overlapping areas, each of one square metre, in this second field, and counts the number of orchids present in each square.
(e) Using a Poisson approximation, show that the probability that he finds at least one square with exactly 6 orchids in it is 0.506 to 3 decimal places. (4)
Mark scheme (a)
Scheme
Marks
AO
1.36 or 1.37
B1
1.1b
(1)
Notes
B1: accept 1.36 or 1.37
Mark scheme (b)
Scheme
Marks
AO
\(\mathrm{H}_0\): \(\mathrm{Po}(1.75)\) is a suitable model \(\mathrm{H}_1\): \(\mathrm{Po}(1.75)\) is not a suitable model
B1
3.4
(1)
Notes
B1: For both hypotheses correct. Must have \(\mathrm{Po}(1.75)\) or Poisson with mean 1.75 and be attached to \(\mathrm{H}_0\) and \(\mathrm{H}_1\) the right way round.
Mark scheme (c)
Scheme
Marks
AO
Cells are combined for expected frequencies < 5 so combine the last 3 cells
B1
2.4
subtract 1 since totals agree
B1
2.4
(2)
Notes
B1: Explaining why there are 5 classes. Must mention combine the 3 cells when frequencies < 5 or to combine the 3 cells to make frequency > 5
B1: Explaining why 1 is subtracted. Must say/show 1 is subtracted and Totals agree or Total frequency must be 150 or only need 4 pieces of data to find the other or \(\lambda\) is known or 1.75 is given.
NB B0 for “only 1 constraint” on its own.
Mark scheme (d)
Scheme
Marks
AO
\(\chi^2_4 = 9.488\)
B1
1.1b
therefore, the researcher’s belief is supported or evidence that Po(1.75) is a good model for the number of orchids in each square metre
B1ft
3.5a
(2)
Notes
B1: awrt 9.49
B1ft: ft their critical value only. For drawing the correct conclusion – condone missing 1.75. If hypotheses are the wrong way round or there are no hypotheses in (b) award B0
B1: awrt 0.00353. May be implied by awrt 0.706 for mean.
M1: Selecting the model \(\mathrm{B}(200, \text{“their P(exactly 6 orchids)”})\) and using \(np\) (\(0 \lt p \lt 1\)) to find the mean. May be implied by awrt 0.706
M1:Using the model Po(their \(np\)) and using or writing \(1 - \mathrm{P}(Y = 0)\) or \(1 - \mathrm{P}(Y \leqslant 0)\) or \(1 - \mathrm{e}^{-\text{“}0.706\text{”}}\)
A1*: only award if the previous 3 marks have been awarded. and 0.506 stated.
\(\approx \mathrm{P}(Z \lt -0.44)\) \(= 1 - 0.670\) \(= 0.33\) or 0.330 or awrt 0.331
A1
(5)
Notes
M1 Using normal approximation with mean = variance = 378 or sd = \(\sqrt{378}\) (awrt 19.4) or writing N(378,378) May be seen in standardisation.
M1 \(\pm\left(\dfrac{(369 \text{ or } 370 \text{ or } 369.5 \text{ or } 370.5) - \text{their mean}}{\text{their sd}}\right)\) If they have not given a mean and variance they must be correct in here. (allow 1 – standardisation)
M1d dep on previous method mark being awarded. Using a continuity correction \(370 \pm 0.5\)
A1ft standardisation with correct CC ie \(\pm\dfrac{369.5 - \text{"their 378"}}{\sqrt{\text{"their 378"}}}\) or awrt \(\pm\)0.44 or implied by 0.330 or 0.331 (allow 1 – standardisation) (0.33 must be from correct standardisation) NB 0.33 with no working gains NO marks. 0.330 or 0.331 with no working gains full marks.
Mark scheme (c)
Scheme
Marks
\(W\) represents number of days which have fewer than 370 telephone calls
M1 writing \(\mathrm{B}(5, \text{"}0.33\text{"})\) or \(\mathrm{B}(5, 1 - \text{"}0.33\text{"})\) or seeing \({}^5C_n(\text{"}0.33\text{"})^n(1 - \text{"}0.33\text{"})^{5-n}\) where \(1 \leqslant n \leqslant 4\) Allow if \({}^nC_r\) calculated or in factorial form
M1 \(1 - (1 - \text{"}0.33\text{"})^5 - 5(\text{"}0.33\text{"})^1(1 - \text{"}0.33\text{"})^4 - 10(\text{"}0.33\text{"})^2(1 - \text{"}0.33\text{"})^3 - 10(\text{"}0.33\text{"})^3(1 - \text{"}0.33\text{"})^2\) oe Allow if using \({}^nC_r\) form or factorial form
NB awrt 0.044 with no incorrect working gains M1M1A1
2. The number of accidents per year in Daftstown follows a Poisson distribution with mean \(\lambda\). The value of \(\lambda\) has previously been 6 but Jonty claims that since the Council increased the speed limit, the value of \(\lambda\) has increased.
Jonty records the number of accidents in Daftstown in the first year after the speed limit was increased. He plans to test, at the 5% significance level, whether or not there is evidence of an increase in the mean number of accidents in Daftstown per year.
(a) Stating your hypotheses clearly, calculate the probability of a Type I error for this test. (4)
Given that there were 9 accidents in the first year after the speed limit was increased,
(b) state, giving a reason, whether or not there is evidence to support Jonty’s claim. (2)
(c) Given that the value of \(\lambda\) has actually increased to 8, calculate the probability of drawing the conclusion, using this test, that the number of accidents per year in Daftstown has not increased. (2)
M1 \(\mathrm{P}(X \leqslant c - 1 \mid \lambda = 8)\) with \(c - 1\) being correct or using their \(c\). Allow if a CR is stated in the form \(X \leqslant c\) for \(1 - \mathrm{P}(X \leqslant c \mid \lambda = 8)\)
2. A company receives telephone calls at random at a mean rate of 2.5 per hour.
(a) Find the probability that the company receives
(i) at least 4 telephone calls in the next hour,
(ii) exactly 3 telephone calls in the next 15 minutes. (5)
(b) Find, to the nearest minute, the maximum length of time the telephone can be left unattended so that the probability of missing a telephone call is less than 0.2 (3)
The company puts an advert in the local newspaper. The number of telephone calls received in a randomly selected 2 hour period after the paper is published is 10
(c) Test at the 5% level of significance whether or not the mean rate of telephone calls has increased. State your hypotheses clearly. (5)
(i) M1 writing or using \(1 - \mathrm{P}(X \leqslant 3)\) implied by awrt 0.242 A1 awrt 0.242
(ii) B1 Using Po(0.625) M1 finding \(\mathrm{P}(X = 3)\) with any \(\lambda\) e.g \(\dfrac{\mathrm{e}^{-\lambda}\lambda^3}{3!}\) or \(\mathrm{P}(X \leqslant 3) - \mathrm{P}(X \leqslant 2)\) – may be implied by awrt 0.0218 A1 awrt 0.0218
\(\mathrm{e}^{-2.5t} \gt 0.8\) \(t \lt 0.089\ldots\) hours = 5.36 mins
M1
\([t \lt]\) 5 mins
A1cso
(3)
Notes
1st M1 for writing or using \(1 - \mathrm{P}(X = 0) \lt 0.2\) or \(\mathrm{P}(X = 0) \gt 0.8\) oe allow use of = instead of > or <. May be implied by \(\mathrm{e}^{-\lambda} = 0.8\) or \(\mathrm{e}^{-\lambda} \gt 0.8\) or by awrt 5.36 or 0.089
2nd M1 writing an inequality of the form \(\mathrm{e}^{-\lambda} \gt 0.8\) using any \(\lambda\). May be implied by or by awrt 5.36 or 0.089 Do not allow \(\mathrm{e}^{-\lambda} = 0.8\)
A1cso both the method marks must be awarded. Accept 5 or \(t = 5\) or \(t \lt 5\)
Sufficient evidence to reject \(\mathrm{H}_0\), Accept \(\mathrm{H}_1\), significant. 10 does lie in the Critical region.
M1d
There is sufficient evidence that the mean rate of telephone calls has increased (oe)
A1cso
(5)
(13 marks)
Notes
B1 both hypotheses using \(\lambda\) or \(\mu\) - allow 5 or 2.5 and it must be clear which is \(\mathrm{H}_0\) and which is \(\mathrm{H}_1\)
1st M1 writing or using Po(5) and \(1 - \mathrm{P}(X \leqslant 9)\) May be implied by a correct CR. Do not allow for writing \(\mathrm{P}(X \geqslant 10)\)
NB allow M1A1 if not using CR route for \(\mathrm{P}(X \leqslant 9)\) = awrt 0.968
2nd M1 dependent on previous M being awarded. A correct statement (do not allow if there are contradicting non-contextual statements). ft their Prob/CR compared with 0.05/10 (0.95 if using 0.968)
2nd A1 A correct contextual statement must include the word calls and the idea the rate has increased. (do not allow “it has changed” on its own oe). All previous marks must be awarded for this mark to be awarded. M1A1 is awarded for a correct contextual statement on its own provided previous marks have been awarded
1. A student is investigating the numbers of cherries in a Rays fruit cake. A random sample of Rays fruit cakes is taken and the results are shown in the table below.
Number of cherries
0
1
2
3
4
5
\(\geqslant 6\)
Frequency
24
37
21
12
4
2
0
(a) Calculate the mean and the variance of these data. (3)
(b) Explain why the results in part (a) suggest that a Poisson distribution may be a suitable model for the number of cherries in a Rays fruit cake. (1)
The number of cherries in a Rays fruit cake follows a Poisson distribution with mean 1.5
A Rays fruit cake is to be selected at random.
Find the probability that it contains
(c)
(i) exactly 2 cherries,
(ii) at least 1 cherry. (4)
Rays fruit cakes are sold in packets of 5
(d) Show that the probability that there are more than 10 cherries, in total, in a randomly selected packet of Rays fruit cakes, is 0.1378 correct to 4 decimal places. (3)
Twelve packets of Rays fruit cakes are selected at random.
(e) Find the probability that exactly 3 packets contain more than 10 cherries. (3)
Mark scheme (a)
Note: if a correct answer is given with no incorrect working award full marks unless the markscheme says otherwise.
Scheme
Marks
Mean = 1.41
B1
Variance \(= \dfrac{343}{100} - 1.41^2\)
M1
\(= 1.4419 \qquad (s^2 = 1.456)\)
A1
(3)
Notes
B1: Cao Allow 141/100
M1: using \(\dfrac{\sum fx^2}{100} - (\text{their mean})^2\) or \(\dfrac{100}{99}\left(\dfrac{\sum fx^2}{100} - (\text{their mean})^2\right)\) oe NB Allow the square root of this for the M mark. If no working shown for \(\sum fx^2\) then you must see 343, 3.43 or a correct answer
A1: awrt 1.44 or 1.46 for \(s^2\)
Mark scheme (b)
Scheme
Marks
The mean is close to the variance
B1
(1)
Notes
B1: Cao - allow alternative wording Allow mean equals variance
5. Liftsforall claims that the lift they maintain in a block of flats breaks down at random at a mean rate of 4 times per month. To test this, the number of times the lift breaks down in a month is recorded.
(a) Using a 5% level of significance, find the critical region for a two-tailed test of the null hypothesis that ‘the mean rate at which the lift breaks down is 4 times per month’. The probability of rejection in each of the tails should be as close to 2.5% as possible. (3)
Over a randomly selected 1 month period the lift broke down 3 times.
(b) Test, at the 5% level of significance, whether Liftsforall’s claim is correct. State your hypotheses clearly. (2)
(c) State the actual significance level of this test. (1)
The residents in the block of flats have a maintenance contract with Liftsforall. The residents pay Liftsforall £500 for every quarter (3 months) in which there are at most 3 breakdowns. If there are 4 or more breakdowns in a quarter then the residents do not pay for that quarter.
Liftsforall installs a new lift in the block of flats.
Given that the new lift breaks down at a mean rate of 2 times per month,
(d) find the probability that the residents do not pay more than £500 to Liftsforall in the next year. (6)
There is evidence that Liftsforall’s claim is true or There is insufficient evidence to doubt Liftforall’s claim
B1ft
Notes
B1: both hypotheses correct, labelled \(\mathrm{H}_0\) or NH or \(\mathrm{H}_n\) and \(\mathrm{H}_1\) or AH or \(\mathrm{H}_a\) may use \(\lambda\) or \(\mu\). These must be seen in part (b)
B1: ft their CR only, Do not ft hypotheses. Needs to include the word Liftsforall. If no Critical region stated in part (a) award B0 or \(\mathrm{P}(X \leqslant 3)\) = awrt 0.434 and a correct conclusion.
Mark scheme (c)
Scheme
Marks
\(0.0183 + 0.0214 = 0.0397\)
B1
Notes
B1: Awrt 0.0397
Mark scheme (d)
Scheme
Marks
\(\mathrm{P}(B \leqslant 3 \mid B \sim \mathrm{Po}(6)) = 0.1512\)
M1: for a single term of the form \(\dfrac{\mathrm{e}^{-\lambda}\lambda^2}{2!}\) with any value for \(\lambda\) or \(\mathrm{P}(X \leqslant 2) - \mathrm{P}(X \leqslant 1)\)
M1: Using or writing, normal approximation with mean = 450
M1: Using or writing the mean = variance. Does not need to be 450. May be seen in the standardisation calculation.
M1: \(\pm\left(\dfrac{(470 \text{ or } 469.5 \text{ or } 470.5) - \text{their mean}}{\text{their sd}}\right)\) May be implied by a correct answer or \(z\) = awrt 0.92
M1: dep on previous method mark being awarded. Using a continuity correction \(470 \pm 0.5\) May be implied by a correct answer or \(z\) = awrt 0.92
A1: correct standardisation no need to subtract from 1. Award for \(\dfrac{469.5 - 450}{\sqrt{450}}\) or awrt 0.92 or a correct answer
5. Sammy manufactures wallpaper. She knows that defects occur randomly in the manufacturing process at a rate of 1 every 8 metres. Once a week the machinery is cleaned and reset. Sammy then takes a random sample of 40 metres of wallpaper from the next batch produced to test if there has been any change in the rate of defects.
(a) Stating your hypotheses clearly and using a 10% level of significance, find the critical region for this test. You should choose your critical region so that the probability of rejection is less than 0.05 in each tail. (4)
(b) State the actual significance level of this test. (2)
Thomas claims that his new machine would reduce the rate of defects and invites Sammy to test it. Sammy takes a random sample of 200 metres of wallpaper produced on Thomas’ machine and finds 19 defects.
(c) Using a suitable approximation, test Thomas’ claim. You should use a 5% level of significance and state your hypotheses clearly. (7)
[> 0.05] not significant, there is insufficient evidence to support Thomas’ claim. Or The number/rate/amount of defects is not decreased/less/reduced
A1cso
(7)
(13 marks)
Notes
B1 for suitable hypotheses
1st M1 for normal approximation
1st A1 for mean = 25 and variance = 25 or sd = 5 may be seen in the standardisation formula or implied by a correct answer
2nd M1 for attempting a continuity correction (Method 1: \(19 \pm 0.5\) / Method 2: \(x \pm 0.5\))
3rd M1 for standardising using their mean and their standard deviation and using either Method 1 [19.5, 19, 18.5 accept \(\pm z\).] Method 2 [\((x \pm 0.5)\) and equal to a \(\pm z\) value]
2nd A1 for awrt 0.136 or 35.3 or \(-1.1 \gt -1.96\)
3rd A1 for a correct contextualised conclusion. cao for a one tailed test, must come from correct working. Condone incorrect hypotheses.
NB if finding \(\mathrm{P}(X = 19)\) ie \(\mathrm{P}(X \leqslant 19.5) - \mathrm{P}(X \leqslant 18.5)\) they can get B1 M1 A1 M1 M1 A0 A0
(Note: the printed critical-value method uses 1.96, 35.3 and −1.96, which are as printed in the mark scheme. For this one-tailed 5% test the critical value is \(z = -1.6449\), which gives \(\dfrac{x + 0.5 - 25}{5} = -1.6449\), \(x = 16.3\); 19 is not in the critical region, so the conclusion is the same.)
3. Accidents occur randomly at a road junction at a rate of 18 every year. The random variable \(X\) represents the number of accidents at this road junction in the next 6 months.
(a) Write down the distribution of \(X\). (2)
(b) Find \(\mathrm{P}(X \gt 7)\). (2)
(c) Show that the probability of at least one accident in a randomly selected month is 0.777 (correct to 3 decimal places). (3)
(d) Find the probability that there is at least one accident in exactly 4 of the next 6 months. (3)
Mark scheme (a)
Scheme
Marks
\(X \sim \mathrm{Po}(9)\)
M1A1
(2)
Notes
M1 for Poisson (accept Po). Condone P(9) A1 for mean of 9
B1 Po(1.5) written or used M1 writing or using \(1 - \mathrm{P}(Y = 0)\) or \(1 - \mathrm{P}(Y \leqslant 0)\) or \(1 - \mathrm{e}^{-\lambda}\) [may not be \(Y\)] A1 for at least (1 – 0.223) or better. No need for final comment. * answer given so 0.777 does not imply all three marks
Mark scheme (d)
Scheme
Marks
[\(A\) = no. of months with at least one accident] \(A \sim \mathrm{B}(6, 0.777)\)
1st M1 for identifying binomial with \(n = 6\) and \(p = 0.777\) or better. Condone use of \(p = 0.223\). May be implied by \((p)^4(1 - p)^2\), \(p\) = awrt 0.777 or awrt 0.223
2nd M1 Must have \({}^6\mathrm{C}_4\,(0.777)^4(1 - 0.777)^2\)
2. The cloth produced by a certain manufacturer has defects that occur randomly at a constant rate of \(\lambda\) per square metre. If \(\lambda\) is thought to be greater than 1.5 then action has to be taken.
Using \(\mathrm{H}_0 : \lambda = 1.5\) and \(\mathrm{H}_1 : \lambda \gt 1.5\) a quality control officer takes a 4 m\(^2\) sample of cloth and rejects \(\mathrm{H}_0\) if there are 11 or more defects. If there are 8 or fewer defects she accepts \(\mathrm{H}_0\). If there are 9 or 10 defects a second sample of 4 m\(^2\) is taken and \(\mathrm{H}_0\) is rejected if there are 11 or more defects in this second sample, otherwise it is accepted.
(a) Find the size of this test. (4)
(b) Find the power of this test when \(\lambda = 2\) (3)
Mark scheme (a)
Scheme
Marks
[\(X\) = no. of defects in 4 square metres.] \(X \sim \mathrm{Po}(6)\)
1st M1 for a correct expression/selection of probabilities
2nd M1 for use of Po(6) and at least one correct prob. seen May see \(\mathrm{P}(X = 9) = \dfrac{\mathrm{e}^{-6}6^9}{9!} = 0.06883\ldots\) or \(\mathrm{P}(X = 10) = \dfrac{\mathrm{e}^{-6}6^{10}}{10!} = 0.04130\ldots\)
1st A1 for a fully correct expression 2nd A1 for awrt 0.0473
3. A company claims that it receives emails at a mean rate of 2 every 5 minutes.
(a) Give two reasons why a Poisson distribution could be a suitable model for the number of emails received. (2)
(b) Using a 5% level of significance, find the critical region for a two-tailed test of the hypothesis that the mean number of emails received in a 10 minute period is 4. The probability of rejection in each tail should be as close as possible to 0.025 (2)
(c) Find the actual level of significance of this test. (2)
To test this claim, the number of emails received in a random 10 minute period was recorded.
During this period 8 emails were received.
(d) Comment on the company’s claim in the light of this value. Justify your answer. (2)
During a randomly selected 15 minutes of play in the Wimbledon Men’s Tennis Tournament final, 2 emails were received by the company.
(e) Test, at the 10% level of significance, whether or not the mean rate of emails received by the company during the Wimbledon Men’s Tennis Tournament final is lower than the mean rate received at other times. State your hypotheses clearly. (5)
Mark scheme (a)
Scheme
Marks
Any two of
Emails are independent/occur at random
Emails occur singly
Emails occur at a constant rate
B1B1d
(2)
Notes
B1 any correct statement with context of emails in
B1d Dependent on previous B1. Any correct statement, need not have context
SC for 2 correct statements without context B1 B0
Mark scheme (b)
Scheme
Marks
\(X \sim \mathrm{Po}(4)\)
\(\mathrm{P}(X = 0) = 0.0183\)
\(\mathrm{P}(X \geqslant 9) = 0.0214\)
CR \(X = 0; \quad X \geqslant 9\)
B1B1
(2)
Notes
B1 \(X = 0\) or \(X \leqslant 0\) Allow any letter.
B1 \(X \geqslant 9\) or \(X \gt 8\) Allow any letter.
SC if write correct CR’s as probability statements award B1 B0
For these 2 marks ignore any union sign (\(\cup\)) or intersection sign (\(\cap\))
Mark scheme (c)
Scheme
Marks
\(0.0183 + 0.0214 = 0.0397\) or 3.97%
M1A1
(2)
Notes
M1 adding their probabilities of ‘their’ critical regions if sum gives a probability less than 1 or award if a correct answer given
A1 awrt 0.0397
Mark scheme (d)
Scheme
Marks
8 is not in the critical region or \(\mathrm{P}(X \geqslant 8) = 0.0511\)
M1
therefore there is evidence that the company’s claim is true
A1ft
(2)
Notes
M1 correct reason ft their CR. Do not allow non-contextual contradictions.
A1 correct conclusion for their CR. Allow conclusion in context of emails are received at a rate of 2 every 5 mins
\(0.0620 \lt 0.10\) Reject \(\mathrm{H}_0\) or Significant.
M1 dep.
There is evidence at the 10% level of significance that the mean rate/number/amount of emails received is lower/ has decreased/is less. Or fewer emails are received
A1 cso
(5)
(13 marks)
Notes
(corrected from the printed mark scheme: the alternative form of \(\mathrm{H}_1\) is printed as “(or \(\lambda = 2\))”; it should be \(\lambda \lt 2\))
B1 both hypotheses correct, must have \(\lambda\) or \(\mu\) and either 2 or 6.
M1 using Po(6) may be implied by correct answer.
A1 0.062 or \(X \leqslant 2\)
M1 dependent on previous method being awarded. Do not allow conflicting non-contextual statements. Follow through their hypotheses.
Rolls of material, manufactured by a machine, contain defects at a mean rate of 6 per roll.
The machine is modified. A single roll is selected at random and a test is carried out to see whether or not the mean number of defects per roll has decreased. The significance level is chosen to be as close as possible to 5%.
(b) Calculate the probability of a Type I error for this test. (3)
(c) Given that the true mean number of defects per roll of material made by the machine is now 4, calculate the probability of a Type II error. (2)
Mark scheme (a)
Scheme
Marks
(i) Type I – \(\mathrm{H}_0\) rejected when it is true
B1
(ii) Type II – \(\mathrm{H}_0\) is accepted when it is false
B1
(2)
Mark scheme (b)
Scheme
Marks
\(\mathrm{P}(X \lt c \mid \lambda = 6) \approx 0.05\)
6. Frugal bakery claims that their packs of 10 muffins contain on average 80 raisins per pack. A Poisson distribution is used to describe the number of raisins per muffin.
A muffin is selected at random to test whether or not the mean number of raisins per muffin has changed.
(a) Find the critical region for a two-tailed test using a 10% level of significance. The probability of rejection in each tail should be less than 0.05 (4)
(b) Find the actual significance level of this test. (2)
The bakery has a special promotion claiming that their muffins now contain even more raisins.
A random sample of 10 muffins is selected and is found to contain a total of 95 raisins.
(c) Use a suitable approximation to test the bakery’s claim. You should state your hypotheses clearly and use a 5% level of significance. (8)
Mark scheme (a)
Scheme
Marks
[\(X\) = the number of raisins in a mini-muffin]
\(X \sim \mathrm{Po}(8)\)
B1
e.g. \(\mathrm{P}(X \leqslant 3) = 0.0424\), \(\mathrm{P}(X \leqslant 13) = 0.9658\) so \(\mathrm{P}(X \geqslant 14) = 0.0342\)
M1
So Critical Region is \(X \leqslant 3\) or \(X \geqslant 14\)
A1 A1
(4)
Notes
B1 for Po(8) seen or implied by use
M1 for clear evidence of use of Po(8), may be implied by a correct CR (allow written as a probability statement) or a probability seen in part(b). If they give 3 and 14
1st A1 for \(X \leqslant 3\) or \(0 \leqslant X \leqslant 3\) or 0,1,2,3 or [0,3] Allow any letter
2nd A1 for \(X \geqslant 14\) or \([14, \infty)\) condone \([14, \infty]\) Allow any letter
These A marks must be for statements with \(X\) only – not in prob statements
Mark scheme (b)
Scheme
Marks
\(0.0424 + 0.0342\)
M1
\(= \underline{\mathbf{0.0766}}\) (or better)
A1
(2)
Notes
M1 for showing they are adding together the two probabilities that correspond to their CR or allow M1 A1for correct answer
Probability is greater than 0.05 so not significant (accept \(\mathrm{H}_0\))
M1
Insufficient evidence to support the bakery’s claim Or insufficient evidence of an increase in the (mean) number of raisins per muffin
A1cso
(8)
(14 marks)
Notes
B1 for both hypotheses. Must be in terms of \(\lambda\) or \(\mu\), 8 or 80 can be swapped
1st M1 for normal approx
1st A1 E(Y) = 80 and Var(Y) = 80 (or correct st. dev seen somewhere)
2nd M1 for use of a continuity correction 94.5 or 95.5
3rd M1 Standardising using their mean and their sd, If they have not written down a mean and sd then these need to be correct here to award the mark. They must also use 94.5, 95.5 or 95 and find the correct area ie using \(1 - \mathrm{P}(Z \leqslant\) “their 1.62”)
2nd A1 for awrt 0.053 or awrt 0.947
4th M1 for a correct statement based on their probability and 0.05
3rd A1 cso for a correct contextualised statement and a fully correct solution with no errors seen. Need either bakery’s claim or Raisins and muffin
NB If Found \(\mathrm{P}(X = 95)\) they can get B1 M1 A1 M0M0A0M0A0
5. In a village shop the customers must join a queue to pay. The number of customers joining the queue in a 10 minute interval is modelled by a Poisson distribution with mean 3
Find the probability that
(a) exactly 4 customers join the queue in the next 10 minutes, (2)
(b) more than 10 customers join the queue in the next 20 minutes. (3)
When a customer reaches the front of the queue the customer pays the assistant. The time each customer takes paying the assistant, \(T\) minutes, has a continuous uniform distribution over the interval [0, 5]. The random variable \(T\) is independent of the number of people joining the queue.
(c) Find \(\mathrm{P}(T \gt 3.5)\) (1)
In a random sample of 5 customers, the random variable \(C\) represents the number of customers who took more than 3.5 minutes paying the assistant.
(d) Find \(\mathrm{P}(C \geqslant 3)\) (3)
Bethan has just reached the front of the queue and starts paying the assistant.
(e) Find the probability that in the next 4 minutes Bethan finishes paying the assistant and no other customers join the queue. (4)
Mark scheme (a)
Scheme
Marks
[\(X\) = number of customers joining the queue in the next 10 mins \(\sim \mathrm{Po}(3)\)]
3. The number of houses sold per week by a firm of estate agents follows a Poisson distribution with mean 2. The firm believes that the appointment of a new salesman will increase the number of houses sold. The firm tests its belief by recording the number of houses sold, \(x\), in the week following the appointment. The firm sets up the hypotheses \(\mathrm{H}_0 : \lambda = 2\) and \(\mathrm{H}_1 : \lambda \gt 2\), where \(\lambda\) is the mean number of houses sold per week, and rejects the null hypothesis if \(x \geqslant 3\)
(a) Find the size of the test. (2)
(b) Show that the power function for this test is \[1 - \frac{1}{2}\mathrm{e}^{-\lambda}(2 + 2\lambda + \lambda^2)\] (3)
The table below gives the values of the power function to 2 decimal places.
\(\lambda\)
2.5
3.0
3.5
4.0
5.0
7.0
Power
0.46
\(r\)
0.68
\(s\)
0.88
0.97
Table 1
(c) Calculate the values of \(r\) and \(s\). (2)
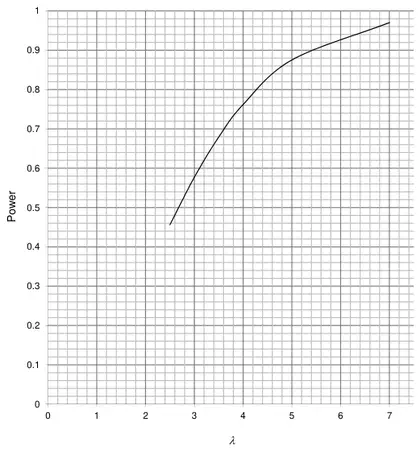
(d) Draw a graph of the power function. (2)
(e) Find the range of values of \(\lambda\) for which the power of this test is greater than 0.6 (1)
5. Water is tested at various stages during a purification process by an environmental scientist. A certain organism occurs randomly in the water at a rate of \(\lambda\) every 10 ml. The scientist selects a random sample of 20 ml of water to check whether there is evidence that \(\lambda\) is greater than 1. The criterion the scientist uses for rejecting the hypothesis that \(\lambda = 1\) is that there are 4 or more organisms in the sample of 20 ml.
(a) Find the size of the test. (2)
(b) When \(\lambda = 2.5\) find P(Type II error). (2)
A statistician suggests using an alternative test. The statistician’s test involves taking a random sample of 10 ml and rejecting the hypothesis that \(\lambda = 1\) if 2 or more organisms are present but accepting the hypothesis if no organisms are in the sample. If only 1 organism is found then a second random sample of 10 ml is taken and the hypothesis is rejected if 2 or more organisms are present, otherwise the hypothesis is accepted.
(c) Show that the power of the statistician’s test is given by \[1 - \mathrm{e}^{-\lambda} - \lambda(1 + \lambda)\mathrm{e}^{-2\lambda}\] (4)
Table 1 below gives some values, to 2 decimal places, of the power function of the statistician’s test.
\(\lambda\)
1.5
2
2.5
3
3.5
4
Power
0.59
0.75
0.86
\(r\)
0.96
0.97
Table 1
(d) Find the value of \(r\). (1)
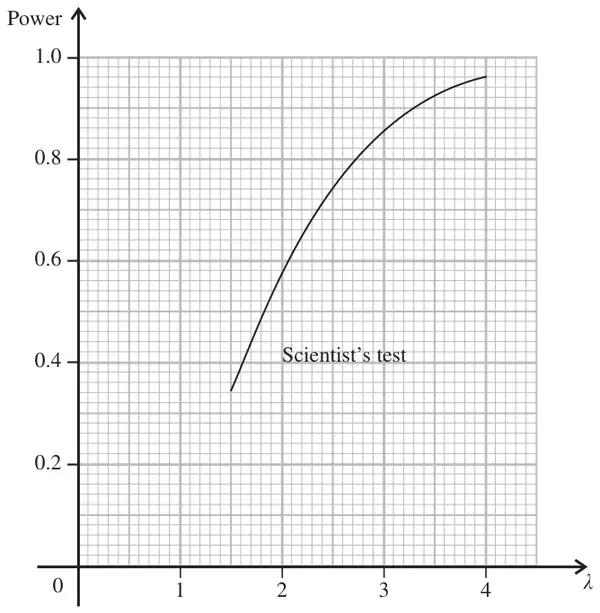
Figure 1 shows a graph of the power function for the scientist’s test.
Figure 1
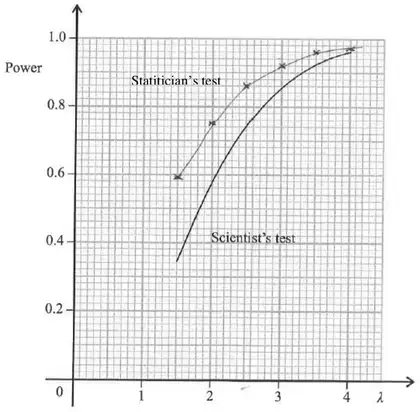
(e) On the same axes draw the graph of the power function for the statistician’s test. (2)
Given that it takes 20 minutes to collect and test a 20 ml sample and 15 minutes to collect and test a 10 ml sample
(f) show that the expected time of the statistician’s test is slower than the scientist’s test for \(\lambda\mathrm{e}^{-\lambda} \gt \dfrac{1}{3}\) (4)
(g) By considering the times when \(\lambda = 1\) and \(\lambda = 2\) together with the power curves in part (e) suggest, giving a reason, which test you would use. (2)
1stM1 for a correct expression in terms of probabilities Alternate answer \(1 - [\mathrm{P}(X = 0) + \mathrm{P}(X = 1) \times \mathrm{P}(X \leqslant 1)]\) 2ndM1 for an attempt at a correct equation in \(\lambda\) 1stA1 for a correct expression in \(\lambda\)
Mark scheme (d)
Scheme
Marks
\(r = 0.92\)
B1
(1)
Mark scheme (e)
Scheme
Marks
See Graph paper
B1B1
(2)
Notes
1stB1 points 2ndB1 curve (or straight lines)
Mark scheme (f)
Scheme
Marks
Expected time for statistician’s test: \(30 \times \mathrm{P}(X = 1) + 15 \times [1 - \mathrm{P}(X = 1)]\)
1stM1 for an attempt to calculate expected time Alternate method \(15 + 15 \times \mathrm{P}(X = 1)\) 1stA1 for a correct expression in terms of \(\lambda\) 2ndM1 for attempt at correct inequality
Mark scheme (g)
Scheme
Marks
\(\lambda\mathrm{e}^{-\lambda}\) with \(\lambda = 1\) is 0.36…, with \(\lambda = 2\) is 0.27…so second(statisticians) test is slower if \(\lambda = 1\) but faster for \(\lambda = 2\). Second test is more powerful for all \(\lambda\)
B1
Choose second test - more powerful and faster for \(\lambda \geqslant 2\)
B1
(2)
(17 marks)
Notes
1stB1 for a comment about power & timings 2ndB1 for selecting second test
3. An online shop sells a computer game at an average rate of 1 per day.
(a) Find the probability that the shop sells more than 10 games in a 7 day period. (3)
Once every 7 days the shop has games delivered before it opens.
(b) Find the least number of games the shop should have in stock immediately after a delivery so that the probability of running out of the game before the next delivery is less than 0.05 (3)
In an attempt to increase sales of the computer game, the price is reduced for six months. A random sample of 28 days is taken from these six months. In the sample of 28 days, 36 computer games are sold.
(c) Using a suitable approximation and a 5% level of significance, test whether or not the average rate of sales per day has increased during these six months. State your hypotheses clearly. (7)
Least number of games = 12 Least number of games 13
A1
(3)
Notes
M1 using or writing \(\mathrm{P}(X \gt d) \lt 0.05\) or \(\mathrm{P}(X \lt d) \gt 0.95\) (condone \(\geqslant\) instead of \(\gt\) and \(\leqslant\) instead of \(\lt\)) May be implied by correct answer. Different letters may be used.
1st A1 \(\mathrm{P}(X \leqslant 12)\)/ \(\mathrm{P}(X \lt 13) =\) awrt 0.973 or \(\mathrm{P}(X \leqslant 11)\) / \(\mathrm{P}(X \lt 12) =\) awrt 0.947 May be implied by a correct answer
2nd A1 12 or 13
NB An answer of 12/13 on its own with no working gains M1A1A1
\(= \mathrm{P}(Z \geqslant 1.42)\) \(= 0.0778\) or \(1.42 \lt 1.6449\) or CR \(X \geqslant 37.2\)
A1
\(0.0778 \gt 0.05\) so do not reject \(\mathrm{H}_0\)/not significant. Not in CR
M1
There is no evidence that the average rate of sales per day has increased.
A1cso
(7)
(13 marks)
Notes
1st B1 both hypotheses correct using \(\lambda\) or \(\mu\), and 1 or 28
2nd B1 for writing or using a normal approximation with correct mean and Var (may be given if sd correct in standardisation formula)
1st M1 for use of a continuity correction 35.5 or 36.5 or \(x \pm 0.5\)
2nd M1 Standardising using their mean and their sd. If they have not written down a mean and sd then these need to be correct here to award the mark. They must use [35.5, 36.5, 36, \(x\) or \(x \pm 0.5\)] For CR must have = awrt 1.64 or 1.65
1st A1 awrt 0.0778 or 0.9222 or the statement \(1.42 \lt\) awrt 1.65/1.64 or CR \(X \geqslant 37.2\)/ \(X \gt 37.2\)
3rd M1 a correct conclusion for their probability. May be implied by a correct contextual conclusion. NB Non contextual contradicting statements gets M0
2nd A1 a correct contextual conclusion for their hypotheses and a fully correct solution with no errors seen. Need the words “rate/average number”, “sales” and “increased”oe
NB If found \(\mathrm{P}(X = 36)\) they can get B1B10M0A0M0A0
(ii) \(\mathrm{P}(X \geqslant 4) = 1 - \mathrm{P}(X \leqslant 3)\)
M1
\(= 1 - 0.6472\)
\(= 0.3528\) awrt 0.353
A1
(5)
Notes
B1 Writing or using Po(3) in either (i) or (ii)
(i) M1 writing or using \(\mathrm{P}(X \leqslant 7) - \mathrm{P}(X \leqslant 6)\) or \(\dfrac{\mathrm{e}^{-\lambda}\lambda^7}{7!}\)
(ii) M1 writing or using \(1 - \mathrm{P}(X \leqslant 3)\). (Do not accept writing \(1 - \mathrm{P}(X \lt 4)\) unless they have used \(1 - \mathrm{P}(X \leqslant 3)\)).
1st M1 for writing or using a normal approximation
1st A1 for correct mean and sd (may be given if correct in standardisation formula)
2nd M1 Standardising using their mean and their sd and using [18.5, 19, 19.5, 20 or 20.5] and for finding correct area by doing 1 – P(\(Z \leqslant\) “their 1.92”) If they have not written down a mean and sd then these need to be correct here to award the mark
3rd M1 for attempting a continuity correction (\(19 \pm 0.5\)) i.e. 18.5 or 19.5 only.
2nd A1 for \(\pm\dfrac{19.5 - 30}{\sqrt{30}}\) or \(\pm\) awrt 1.9 or better.
3rd A1 awrt 0.0274, 0.0275 or 0.0276
SC using \(\mathrm{P}(X \lt 20.5/19.5) - \mathrm{P}(X \lt 19.5/18.5)\) can get M1A1 M0M1A0A0
(a) Write down the conditions under which the Poisson distribution can be used as an approximation to the binomial distribution. (2)
The probability of any one letter being delivered to the wrong house is 0.01
On a randomly selected day Peter delivers 1000 letters.
(b) Using a Poisson approximation, find the probability that Peter delivers at least 4 letters to the wrong house. Give your answer to 4 decimal places. (3)
Mark scheme (a)
Scheme
Marks
\(n\) large
B1
\(p\) small
B1
(2)
Notes
B1 Accept \(n\) (the number of trials) large / high / big / \(n \gt 50\) (accept any number larger than 50)
B1 Accept \(p\) (the probability) small / close to 0 / \(p \lt 0.2\) ( accept any number less than 0.2). Do not accept low.
These must appear in part (a).
Mark scheme (b)
Scheme
Marks
Let \(X\) be the random variable the number of letters delivered to the wrong house
M1 using a Poisson (\(\lambda\) need not equal 10) and for writing or using \(1 - \mathrm{P}(X \leqslant 3)\). (Do not accept writing \(1 - \mathrm{P}(X \lt 4)\) unless they have used \(1 - \mathrm{P}(X \leqslant 3)\)).
A1 0.9897 cao must be 4 dp
NB
An awrt 0.990 on its own gains B0M0A0 unless there is evidence that Po(10) is used. In which case it gets B1M1A0
Using B(1000,0.01) gives 0.989927…. and gains B0M0A0
M1 writing or attempting to use B(12,their (a(ii))) NB ft their a(ii) to at least 2sf
M1 \(\dfrac{12!}{9!3!}\)(a(ii))\(^9\)(1- a(ii))\(^3\) allow \({}^{12}\mathrm{C}_3\) or \({}^{12}\mathrm{C}_9\) or 220 instead of \(\dfrac{12!}{9!3!}\) NB ft their a(ii) to at least 1sf but an expression must be seen (No use of tables)
1st M1 for writing or using a normal approximation
1st A1 for correct mean and sd (may be given if correct in standardisation formula)
2nd M1 Standardising using their mean and their sd and using [24.5, 25, 25.5, 26 or 26.5] and for finding correct area by doing \(1 - \mathrm{P}(Z \leqslant\) “their 1.23”)
NB if they have not written down a mean and sd then they need to be correct in the standardisation to gain this mark.
3rd M1 for attempting a continuity correction (\(26 \pm 0.5\))
2nd A1 for \(\pm\dfrac{25.5 - 20}{\sqrt{20}}\) or \(\pm\) awrt 1.2 or better.
SC using \(\mathrm{P}(X \lt 26.5/25.5) - \mathrm{P}(X \lt 25.5/24.5)\) can get M1A1 M0M1A0A0
(a) Write down two conditions needed to approximate the binomial distribution by the Poisson distribution. (2)
A machine which manufactures bolts is known to produce 3% defective bolts. The machine breaks down and a new machine is installed. A random sample of 200 bolts is taken from those produced by the new machine and 12 bolts were defective.
(b) Using a suitable approximation, test at the 5% level of significance whether or not the proportion of defective bolts is higher with the new machine than with the old machine. State your hypotheses clearly. (7)
Mark scheme (a)
Scheme
Marks
\(n\) – large/high/big/ \(n \gt 50\)
B1
\(p\) – small/close to 0 / \(p \lt 0.2\)
B1
(2)
Mark scheme (b)
Scheme
Marks
\(\mathrm{H}_0 : p = 0.03 \qquad \mathrm{H}_1 : p \gt 0.03\)
\((0.0201 \lt 0.05)\) Reject \(\mathrm{H}_0\) or Significant or 12 lies in the Critical region.
M1 dep.
There is evidence that the proportion of defective bolts has increased.
A1 ft
(7)
(9 marks)
Notes
1st B1 for \(\mathrm{H}_0 : p = 0.03\)
2nd B1 for \(\mathrm{H}_1 : p \gt 0.03\)
SC If both hypotheses are correct but a different letter to \(p\) is used they get B1 B0
Also allow B1 B0 for \(\mathrm{H}_0 : \lambda = 6\) and \(\mathrm{H}_1 : \lambda \gt 6\)
B1 writing or using Po(6)
One tail
1st M1 for writing or using \(1 - \mathrm{P}(X \leqslant 11)\) or giving \(\mathrm{P}(X \leqslant 10) = 0.9574\) or giving \(\mathrm{P}(X \geqslant 11) = 0.0426\). May be implied by correct CR or probability = 0.0201
1st A1 for 0.0201 or CR \(X \geqslant 11\)/ \(X \gt 10\). NB \(\mathrm{P}(X \leqslant 11) = 0.9799\) on its own scores M1A1
2nd M1 dependent on the 1st M1 being awarded. For a correct statement based on the table below. Do not allow non-contextual conflicting statements eg “significant” and “accept \(\mathrm{H}_0\)”. Ignore comparisons.
2nd A1 ft for a correct contextualised statement. NB A correct contextual statement on its own scores M1A1.
\(0.05 \lt p \lt 0.95\)
\(p \lt 0.05\) or \(p \gt 0.95\)
2nd M1
not significant/ accept \(\mathrm{H}_0\)/ Not in CR
significant/ reject \(\mathrm{H}_0\)/ In CR
2nd A1
The proportion/number/amount/percentage oe of defective bolts has not increased/is not higher/oe
The proportion/number/amount/percentage oe of defective bolts has increased/is higher/oe
Two tail
1st M1 for writing or using \(1 - \mathrm{P}(X \leqslant 11)\) or giving \(\mathrm{P}(X \geqslant 12) = 0.0201\) or giving \(\mathrm{P}(X \leqslant 11) = 0.9799\). May be implied by correct CR or probability = 0.0201
1st A1 for 0.0201 or CR \(X \geqslant 12\)/ \(X \gt 11\). NB \(\mathrm{P}(X \leqslant 11) = 0.9799\) on its own scores M1A1
2nd M1 dependent on the 1st M1 being awarded. For a correct statement based on the table below. Do not allow non-contextual conflicting statements eg “significant” and “accept \(\mathrm{H}_0\)”. Ignore comparisons.
2nd A1 ft for a correct contextualised statement. NB A correct contextual statement on its own scores M1A1.
\(0.025 \lt p \lt 0.975\)
\(p \lt 0.025\) or \(p \gt 0.975\)
2nd M1
not significant/ accept \(\mathrm{H}_0\)/ Not in CR
significant/ reject \(\mathrm{H}_0\)/ In CR
2nd A1
The proportion/number/amount/percentage oe of defective bolts has not increased/is not higher/oe
The proportion/number/amount/percentage oe of defective bolts has increased/is higher/oe
Use of N(6,5.82) May get B1 B1 B0 M1 (must use 11.5)A0 M1dep A1 ft
(ii) the level of significance of a hypothesis test. (2)
(b) An estate agent has been selling houses at a rate of 8 per month. She believes that the rate of sales will decrease in the next month.
(i) Using a 5% level of significance, find the critical region for a one tailed test of the hypothesis that the rate of sales will decrease from 8 per month.
(ii) Write down the actual significance level of the test in part (b)(i). (3)
The estate agent is surprised to find that she actually sold 13 houses in the next month. She now claims that this is evidence of an increase in the rate of sales per month.
(c) Test the estate agent’s claim at the 5% level of significance. State your hypotheses clearly. (5)
Mark scheme (a)
Scheme
Marks
(i) The range of values/region/area/set of values of the test statistic that would lead you to reject H0
B1
(ii) The probability of incorrectly rejecting \(\mathrm{H}_0\) or Probability of rejecting \(\mathrm{H}_0\) when \(\mathrm{H}_0\) is true
B1
(2)
Notes
(i) Allow accept H1 instead of reject H0. It must be clear which hypothesis gets rejected/accepted. (ii) Allow equivalent wording.
M1 Writing or using Po(8). May be implied by correct critical region. A1 allow \(0 \leqslant X \leqslant 3\) or CR \(\leqslant 3\) or \(X \leqslant 3\). Any letter may be used but not \(\mathrm{P}(X \leqslant 3)\). This must be on its own.
so insufficient evidence to reject \(\mathrm{H}_0\) /not significant/ not in critical region
M1 dep
There in insufficient evidence of an increase/change in the rate/number of sales per month or the estate agents claim is incorrect
A1
(5)
(10 marks)
Notes
B1 both hypotheses correct. Must use \(\lambda\) or \(\mu\).
One tail 1st M1 for writing or using \(1 - \mathrm{P}(X \leqslant 12)\) or writing \(\mathrm{P}(X \leqslant 13) = 0.9658\) or \(\mathrm{P}(X \geqslant 14) = 0.0342\). May be implied by correct CR.or probability = 0.0638 A1 for 0.0638 or \(X \geqslant 14\). Allow \(X\) >13. NB \(\mathrm{P}(X \leqslant 12) = 0.9362\) on its own scores M1A1 2nd M1 dependent on the 1st M1 being awarded. For a correct statement based on the table below. Do not allow non-contextual conflicting statements eg “not significant” and “reject H0”. Ignore comparisons. 2nd A1 for a correct contextualised statement. NB A correct contextual statement on its own scores M1A1.
\(0.05 \lt p \lt 0.95\)
\(p \lt 0.05\) or \(p \gt 0.95\)
2nd M1
not significant/ accept H0/ Not in CR
significant/ reject H0/ In CR
2nd A1
Insufficient evidence of an increase/change in the rate/number of sales per month
Sufficient evidence of an increase/change in the rate/number of sales per month
Two tail 1st M1 for writing or using \(1 - \mathrm{P}(X \leqslant 12)\) or writing \(\mathrm{P}(X \leqslant 14) = 0.9827\) or \(\mathrm{P}(X \geqslant 15) = 0.0173\). May be implied by correct CR.or probability = 0.0638 A1 for 0.0638 or \(X \geqslant 15\). Allow \(X\) >14. NB \(\mathrm{P}(X \leqslant 12) = 0.9362\) on its own scores M1A1 2nd M1 dependent on the 1st M1 being awarded . For a correct statement based on the table below. Do not allow non-contextual conflicting statements eg “not significant” and “reject H0”.Ignore comparisons. 2nd A1 for a correct contextualised statement. NB A correct contextual statement on its own scores M1A1.
\(0.025 \lt p \lt 0.975\)
\(p \lt 0.025\) or \(p \gt 0.975\)
2nd M1
not significant/ accept H0/ Not in CR
significant/ reject H0/ In CR
2nd A1
Insufficient evidence of an increase/change in the rate/number of sales per month
Sufficient evidence of an increase/change in the rate/number of sales per month
B1 Writing or use of B(120,0.075) may be implied by using Po(9) or N(9,8.325) 1st M1 writing or use of Poisson 1st A1 writing or use of Po(9) 2nd M1 for writing or using \(1 - \mathrm{P}(X \leqslant 3)\) or this may be implied by an awrt 0.972 using normal approximation.
Mark scheme (b)
Scheme
Marks
P(At least 4 defective components in each box) \(= \mathrm{P}(X \gt 3) \times \mathrm{P}(X \gt 3)\)
M1
\(= 0.9788^2\) \(= 0.95804944\) awrt 0.958
A1
(2)
(7 marks)
Notes
M1 ((their (a))2 or \(0.979^2\) or \(0.9788^2\) or \(0.98^2\)
4. A website receives hits at a rate of 300 per hour.
(a) State a distribution that is suitable to model the number of hits obtained during a 1 minute interval. (1)
(b) State two reasons for your answer to part (a). (2)
Find the probability of
(c) 10 hits in a given minute, (3)
(d) at least 15 hits in 2 minutes. (3)
The website will go down if there are more than 70 hits in 10 minutes.
(e) Using a suitable approximation, find the probability that the website will go down in a particular 10 minute interval. (7)
Mark scheme (a)
Scheme
Marks
Poisson
B1
(1)
Mark scheme (b)
Scheme
Marks
Hits occur singly in time Hits are independent or Hits occur randomly Hits occur at a constant rate
B1B1
(2)
Notes
1st B1 Any one of the 3 statements - no context required. NB It must be a constant (mean) rate and not a constant probability or a constant mean. 2nd B1 A different statement with context of hits. NB random and independent are the same statement. If only one mark awarded give the 1st B1. Never award B0 B1
1st B1 for a normal approximation 2nd B1 for correct mean and sd (may be seen in standardisation formula 1st M1 for attempting a continuity correction (71 \(\pm\) 0.5) 2nd M1 Standardising using their mean and their sd and using [69.5, 70, 70.5, 71 or 71.5] allow \(\pm\) z NB if they have not written down a mean and sd then they need to be correct in the standardisation to gain this mark. 1st A1 for \(z = \pm\) awrt 2.9 or better. May be awarded for \(\pm\dfrac{70.5 - 50}{\sqrt{50}}\) 3rd M1 for 1 - tables value
SC using P(\(X\)< 70.5/71.5) – P(\(X\)<69.5/70.5) can get B1B1 M0M1A0 M0A0
1st M1 for writing or using the binomial - may be implied by use of \(nq^x(1 - q)^{6-x}\) with \(n \geqslant 1\) 1st A1ft for \(n = 6\) and \(p\) = their (a) may be implied by \(6p(1 - p)^5\) or \((1 - p)^6\) NB if they write B(6,(a)) they get M1 A1 2nd M1 for writing \(\mathrm{P}(Y \leqslant 1)\) or \(\mathrm{P}(Y = 0) + \mathrm{P}(Y = 1)\) or \((1 - q)^6 + nq(1 - q)^5\) with \(n \geqslant 1\) 2nd A1 \((1 - p)^6 + 6p(1 - p)^5\) where \(p\) = their (a) 3rd A1 for awrt 0.499
SC use of a probability in the tables – lose last two marks – could get M1A1M1 M0 A0
Mark scheme (c)
Scheme
Marks
Let \(T\) = total number of defects on 6 planks, \(T \sim \mathrm{Po}(30)\) so \(T \approx S \sim\) Normal \(S \sim \mathrm{N}(30, 30)\)
1st M1 for a normal approx 1st A1 for correct mean and sd 2nd M1 for use of continuity correction, either 17.5 or 18.5 or 42.5 or 41.5 seen 3rd M1 Standardising with their mean and their sd and 17.5 or 18 or 18.5 or 41.5 or 42 or 42.5 NB if they have not written down a mean and sd then they need to be correct in the standardisation to gain this mark.
2nd A1 for \(z = \pm 2.28\) or better. May be awarded for \(\pm\dfrac{17.5 - 30}{\sqrt{30}}\) [NB no continuity correction \(z\) = 2.19] 3rd A1 for awrt 0.0112 or 0.0113 [NB no approximation gives 0.00727…]
SC using P(\(X\)<18.5) – P(\(X\)<17.5) can get M1 A1 M1 M0A0A0
2. A traffic officer monitors the rate at which vehicles pass a fixed point on a motorway. When the rate exceeds 36 vehicles per minute he must switch on some speed restrictions to improve traffic flow.
(a) Suggest a suitable model to describe the number of vehicles passing the fixed point in a 15 s interval. (1)
The traffic officer records 12 vehicles passing the fixed point in a 15 s interval.
(b) Stating your hypotheses clearly, and using a 5% level of significance, test whether or not the traffic officer has sufficient evidence to switch on the speed restrictions. (6)
(c) Using a 5% level of significance, determine the smallest number of vehicles the traffic officer must observe in a 10 s interval in order to have sufficient evidence to switch on the speed restrictions. (3)
Mark scheme (a)
Scheme
Marks
Poisson
B1
(1)
Notes
B1 for Poisson or Po. Ignore their value for the mean.
(0.197 > 0.05) so not significant/ accept H0/ Not in CR
M1d
he does not have evidence to switch on the speed restrictions (o.e)
A1ft
(6)
Notes
1st B1 for \(\mathrm{H}_0 : \mu/\lambda = 9\) or \(\mu/\lambda = 36\) 2nd B1 for \(\mathrm{H}_1 : \mu/\lambda \gt 9\) or \(\mu/\lambda \gt 36\)
One tail 1st M1 for writing or using \(1 - \mathrm{P}(X \leqslant 11)\) or writing \(\mathrm{P}(X \leqslant 14) = 0.9585\) or \(\mathrm{P}(X \geqslant 15) = 0.0415\). May be implied by correct CR.or probability = 0.197 A1 for 0.197 or a correct CR. Allow \(X\) >14. NB \(\mathrm{P}(X \leqslant 11) = 0.8030\) on its own scores M1A1 2nd M1 dependent on the 1st M1 being awarded. For a correct statement based on the table below. Do not allow non-contextual conflicting statements eg “significant” and “accept H0”. Ignore comparisons. 2nd A1 for a correct contextualised statement. NB A correct contextual statement on its own scores M1A1.
\(0.05 \lt p \lt 0.95\)
\(p \lt 0.05\) or \(p \gt 0.95\)
2nd M1
not significant/ accept H0/ Not in CR
significant/ reject H0/ In CR
2nd A1
Insufficient evidence to switch on the speed restrictions
Sufficient evidence to switch on the speed restrictions
Two tail 1st M1 for writing or using \(1 - \mathrm{P}(X \leqslant 11)\) or writing \(\mathrm{P}(X \leqslant 15) = 0.9780\) or \(\mathrm{P}(X \geqslant 16) = 0.022\). May be implied by correct CR. or probability = 0.197 A1 for 0.197 or CR \(X \geqslant 16\). Allow \(X\) >15. NB \(\mathrm{P}(X \leqslant 11) = 0.8030\) on its own scores M1A1 2nd M1 dependent on the 1st M1 being awarded . For a correct statement based on the table below. Do not allow non-contextual conflicting statements eg“significant” and “accept H0” . Ignore comparisons. 2nd A1 for a correct contextualised statement. NB A correct contextual statement on its own scores M1A1.
\(0.025 \lt p \lt 0.975\)
\(p \lt 0.025\) or \(p \gt 0.975\)
2nd M1
not significant/ accept H0/ Not in CR
significant/ reject H0/ In CR
2nd A1
Insufficient evidence to switch on the speed restrictions
Sufficient evidence to switch on the speed restrictions
Mark scheme (c)
Scheme
Marks
Let \(Y\) = the number of vehicles in 10 s then \(Y \sim \mathrm{Po}(6)\)
B1 for identifying Po(6) - may be implied by use of correct tables M1 any one of the probs 0.9574 or 0.0426 or 0.9799 or 0.0201 may be implied by correct answer of 11 A1 cao do not accept \(X \geqslant 11\) NB answer of 11 with no working gains all three marks.
6. Cars arrive at a motorway toll booth at an average rate of 150 per hour.
(a) Suggest a suitable distribution to model the number of cars arriving at the toll booth, \(X\), per minute. (2)
(b) State clearly any assumptions you have made by suggesting this model. (2)
Using your model,
(c) find the probability that in any given minute
(i) no cars arrive,
(ii) more than 3 cars arrive. (3)
(d) In any given 4 minute period, find \(m\) such that \(\mathrm{P}(X \gt m) = 0.0487\) (3)
(e) Using a suitable approximation find the probability that fewer than 15 cars arrive in any given 10 minute period. (6)
Mark scheme (a)
Scheme
Marks
\(X \sim \mathrm{Po}(2.5)\)
M1A1
(2)
Notes
M1 Poisson A1 2.5
Mark scheme (b)
Scheme
Marks
Cars arrive at the toll booth independently/randomly Cars arriveone at a time The rate of arrival at a toll booth remains constant at 2.5 per minute
B1 B1
(2)
Notes
Any two of the statements or equivalent. At least one must be in context. Need words that imply “cars arrive” or “rate of arrival.” SC no context but 2 correct reasons B1B0 No context but 1 correct reason B0B0
B1 use of normal B1 using or seeing mean and variance of 25 These first two marks may be given if the following are seen in the correct places in the standardisation formula : 25 and \(\sqrt{25}\) or 5
M1 for attempting a continuity correction (14 \(\pm\) 0.5) or (15 \(\pm\) 0.5) M1 for standardising using their mean and their standard deviation and using [14.5, 14, 13.5, 15 or 15.5] accept \(\pm\) z. A1 correct z value \(\pm\)2.1 or \(\pm\dfrac{14.5 - 25}{5}\), A1 awrt 0.0179 NB use of calculator gets full marks if the answer is awrt 0.0179.
4. Richard regularly travels to work on a ferry. Over a long period of time, Richard has found that the ferry is late on average 2 times every week. The company buys a new ferry to improve the service. In the 4-week period after the new ferry is launched, Richard finds the ferry is late 3 times and claims the service has improved. Assuming that the number of times the ferry is late has a Poisson distribution, test Richard’s claim at the 5% level of significance. State your hypotheses clearly. (6)
Mark scheme
Scheme
Marks
\(\mathrm{H}_0\): \(\lambda = 8\) or \(\mu = 2\) \(\mathrm{H}_1\): \(\lambda \lt 8\) or \(\mu \lt 2\)
\(0.0424 \lt 0.05\), Reject \(\mathrm{H}_0\). Richard’s claim is supported.
M1A1ft
(6 marks)
Notes
B1 for H0 correct. Must use \(\lambda\) or \(\mu\) and 8 or 2 B1 for H1 correct. Must use \(\lambda\) or \(\mu\) and 8 or 2 M1 for writing or using Po(8) – may be implied by correct CR A1 awrt 0.0424 or CR \(X \leqslant 3\)
M1 need \(p\)<0.5 and: correct statement using their Probability and 0.05 if one tail test or correct statement using their Probability and 0.025 if two tail test (condone a comparison with 0.05 instead of 0.025 for a two tail test). Do not allow non-contextual conflicting statements eg “significant” and “accept H0”
A1ft correct contextual statement followed through from “their prob”. Either a comment on whether Richard’s claim was correct or on whether the service has improved.
NB if a correct contextual statement only is given for their probability then award M1 A1
\(p\)>0.5 They may compare with 0.95 (one tail method) or 0.975 (two tail method) Probability is 0.9576
6. Faults occur in a roll of material at a rate of \(\lambda\) per m2. To estimate \(\lambda\), three pieces of material of sizes 3 m2, 7 m2 and 10 m2 are selected and the number of faults \(X_1\), \(X_2\) and \(X_3\) respectively are recorded.
The estimator \(\hat{\lambda}\), where
\[\hat{\lambda} = k(X_1 + X_2 + X_3)\]
is an unbiased estimator of \(\lambda\).
(a) Write down the distributions of \(X_1\), \(X_2\) and \(X_3\) and find the value of \(k\). (4)
(b) Find \(\mathrm{Var}(\hat{\lambda})\). (3)
A random sample of \(n\) pieces of this material, each of size 4 m2, was taken. The number of faults on each piece, \(Y\), was recorded.
(c) Show that \(\dfrac{1}{4}\bar{Y}\) is an unbiased estimator of \(\lambda\). (2)
5. A company has a large number of regular users logging onto its website. On average 4 users every hour fail to connect to the company’s website at their first attempt.
(a) Explain why the Poisson distribution may be a suitable model in this case. (1)
Find the probability that, in a randomly chosen 2 hour period,
(b)
(i) all users connect at their first attempt,
(ii) at least 4 users fail to connect at their first attempt. (5)
The company suffered from a virus infecting its computer system. During this infection it was found that the number of users failing to connect at their first attempt, over a 12 hour period, was 60.
(c) Using a suitable approximation, test whether or not the mean number of users per hour who failed to connect at their first attempt had increased. Use a 5% level of significance and state your hypotheses clearly. (9)
Mark scheme (a)
Scheme
Marks
Connecting occurs at random/independently, singly or at a constant rate
B1
(1)
Notes
B1 Any one of randomly/independently/singly/constant rate. Must have context of connection/logging on/fail
Mark scheme (b)
Scheme
Marks
Po (8)
B1
(i) \(\mathrm{P}(X = 0) = 0.0003\)
M1A1
(ii) \(\mathrm{P}(X \geqslant 4) = 1 - \mathrm{P}(X \leqslant 3)\)
M1
\(= 1 - 0.0424\) \(= 0.9576\)
A1
(5)
Notes
B1 Writing or using Po(8) in (i) or (ii) (i) M1 for writing or finding \(\mathrm{P}(X = 0)\) A1 awrt 0.0003 (ii) M1 for writing or finding \(1 - \mathrm{P}(X \leqslant 3)\) A1 awrt 0.958
\(0.0485 \lt 0.05\) Reject H0. Significant. 60 lies in the Critical region
M1
The number of failed connections at the first attempt has increased.
A1 ft
(9)
(15 marks)
Notes
Method 2
Scheme
Marks
\(\dfrac{x - 0.5 - 48}{\sqrt{48}} = 1.6449\)
M1 M1 A1
\(x = 59.9\)
A1
B1 both hypotheses correct. Must use \(\lambda\) or \(\mu\) M1 identifying normal A1 using or seeing mean and variance of 48 These first two marks may be given if the following are seen in the standardisation formula : 48 and \(\sqrt{48}\) or awrt 6.93
M1 for attempting a continuity correction (Method 1: 60 \(\pm\) 0.5 / Method 2: \(x \pm 0.5\) ) M1 for standardising using their mean and their standard deviation and using either Method 1 [59.5, 60 or 60.5. accept \(\pm\) z.] Method 2 [ (\(x \pm 0.5\)) and equal to a \(\pm z\) value) A1 correct z value awrt \(\pm\)1.66 or \(\pm\dfrac{59.5 - 48}{\sqrt{48}}\), or \(\dfrac{x - 0.5 - 48}{\sqrt{48}} = 1.6449\) A1 awrt 3 sig fig in range 0.0484 – 0.0485, awrt 59.9
M1 for “reject H0” or “significant” maybe implied by “correct contextual comment” If one tail hypotheses given follow through “their prob” and 0.05 , \(p \lt 0.5\) If two tail hypotheses given follow through “their prob” with 0.025, \(p \lt 0.5\) If one tail hypotheses given follow through “their prob” and 0.95 , \(p \gt 0.5\) If two tail hypotheses given follow through “their prob” with 0.975, \(p \gt 0.5\) If no H1 given they get M0
A1 ft correct contextual statement followed through from their prob and H1. need the words number of failed connections/log ons has increased o.e. Allow “there are more failed connections” NB A correct contextual statement alone followed through from their prob and H1 gets M1 A1
B1 for using Po(10) M1 for attempting to find \(\mathrm{P}(X \leqslant 8)\) : useful values \(\mathrm{P}(X \leqslant 9)\) is 0.4579(M0), using Po(6) gives 0.8472, (M1). A1 awrt 0.333 but do not accept \(\dfrac{1}{3}\)
Mark scheme (b)
Scheme
Marks
\(Y \sim \mathrm{Po}(40)\) \(Y\) is approximately N(40,40)
1st M1 for identifying the normal approximation 1st A1 for [mean = 40] and [sd = \(\sqrt{40}\) or var = 40] NB These two marks are B1 M1 on ePEN
These first two marks may be given if the following are seen in the standardisation formula : 40 and \(\sqrt{40}\) or awrt 6.32
2nd M1 for attempting a continuity correction (50 or 30 \(\pm\) 0.5 is acceptable) 3rd M1 for standardising using their mean and their standard deviation and using either 49.5, 50 or 50.5. (29.5, 30, 30.5) accept \(\pm\)
2nd A1 correct z value awrt \(\pm\)1.66 or this may be awarded if see \(\pm\dfrac{50.5 - 40}{\sqrt{40}}\) or \(\pm\dfrac{29.5 - 40}{\sqrt{40}}\)
3. A robot is programmed to build cars on a production line. The robot breaks down at random at a rate of once every 20 hours.
(a) Find the probability that it will work continuously for 5 hours without a breakdown. (3)
Find the probability that, in an 8 hour period,
(b) the robot will break down at least once, (3)
(c) there are exactly 2 breakdowns. (2)
In a particular 8 hour period, the robot broke down twice.
(d) Write down the probability that the robot will break down in the following 8 hour period. Give a reason for your answer. (2)
Mark scheme (a)
Scheme
Marks
\(Y \sim \mathrm{Po}(0.25)\)
B1
\(\mathrm{P}(Y = 0) = \mathrm{e}^{-0.25}\)
M1
\(= 0.7788\)
A1
(3)
Notes
B1 for seeing or using Po(0.25)
M1 for finding \(\mathrm{P}(Y = 0)\) either by \(\mathrm{e}^{-a}\), where \(a\) is positive (\(a\) needn’t equal their \(\lambda\)) or using tables if their value of \(\lambda\) is in them Beware common Binomial error using, \(p = 0.05\) gives 0.7738 but scores B0 M0 A0
A1 awrt 0.779
SC Use of Binomial. Mark parts a and b as scheme. They could get (a) B0,M0,A0 (b) B0 M1 A0
M1 for finding \(\mathrm{P}(X = 2)\) e.g \(\dfrac{\mathrm{e}^{-\lambda}\lambda^2}{2!}\) with their value of \(\lambda\) in or if their \(\lambda\) is in the table for writing \(\mathrm{P}(X \leqslant 2) - \mathrm{P}(X \leqslant 1)\) A1 awrt 0.0536
SC Use of Binomial. In part c allow M1 for \({}^{n}C_2\,(p)^2(1 - p)^{n-2}\) with “their n” and “their \(p\)”. They could get (c) M1,A0 DO NOT GIVE for \(p(x \leqslant 2) - p(x \leqslant 1)\)
Mark scheme (d)
Scheme
Marks
0.3297 or answer to part (b) as Poisson events are independent
B1ft B1 dep
(2)
(10 marks)
Notes
1st B1 their answer to part(b) correct to 2 sf or awrt 0.33 2nd B1 need the word independent. This is dependent on them gaining the first B1
SC Use of Binomial. In (d) they can get the first B1 only. They could get (d) B1B0
8. A cloth manufacturer knows that faults occur randomly in the production process at a rate of 2 every 15 metres.
(a) Find the probability of exactly 4 faults in a 15 metre length of cloth. (2)
(b) Find the probability of more than 10 faults in 60 metres of cloth. (3)
A retailer buys a large amount of this cloth and sells it in pieces of length \(x\) metres. He chooses \(x\) so that the probability of no faults in a piece is 0.80
(c) Write down an equation for \(x\) and show that \(x = 1.7\) to 2 significant figures. (4)
The retailer sells 1200 of these pieces of cloth. He makes a profit of 60p on each piece of cloth that does not contain a fault but a loss of £1.50 on any pieces that do contain faults.
These values are either side of 0.80 therefore \(x = 1.7\) to 2 sf
A1
(4)
Notes
1st M1 for forming a suitable Poisson distribution of the form \(\mathrm{e}^{-\lambda} = 0.8\) 1st A1 for use of lambda as \(\dfrac{2x}{15}\) (this may appear after taking logs) 2nd M1 for attempt to consider a range of values that will prove 1.7 is correct OR for use of logs to show lambda = … 2nd A1 correct solution only. Either get 1.7 from using logs or stating values either side
S.C for \(\mathrm{e}^{-\frac{2}{15} \times 1.7} = 0.797\ldots \approx 0.80 \quad \therefore x = 1.7\) to 2 sf allow 2nd M1A0
Mark scheme (d)
Scheme
Marks
Expected number with no faults \(= 1200 \times 0.8 = 960\) Expected number with some faults \(= 1200 \times 0.2 = 240\)
1st M1 for one of the following 1200 p or 1200 (1 – p) where p = 0.8 or 2/15. 1st A1 for both expected values being correct or two correct expressions. 2nd M1 for an attempt to find expected profit, must consider with and without faults 2nd A1 correct answer only.
5. The number of goals scored by a football team is recorded for 100 games. The results are summarised in Table 1 below.
Number of goals
Frequency
0
40
1
33
2
14
3
8
4
5
Table 1
(a) Calculate the mean number of goals scored per game. (2)
The manager claimed that the number of goals scored per match follows a Poisson distribution. He used the answer in part (a) to calculate the expected frequencies given in Table 2.
Number of goals
Expected Frequency
0
34.994
1
\(r\)
2
\(s\)
3
6.752
\(\geqslant 4\)
2.221
Table 2
(b) Find the value of \(r\) and the value of \(s\) giving your answers to 3 decimal places. (3)
(c) Stating your hypotheses clearly, use a 5% level of significance to test the manager’s claim. (7)
Not in critical region Number of goals scored can follow a Poisson distribution / managers claim is justified
A1 ft
(7)
(12 marks)
Notes
1st B1 Must have both hypotheses and mention Poisson at least once inclusion of their value for mean in hypotheses is B0 but condone in conclusion
1st M1 for an attempt to pool \(\geqslant 4\)
2nd B1ft for \(n - 1 - 1 = 2\) i.e realising that they must subtract 2 from their \(n\)
3rd B1 for 5.991 only
2nd M1 for an attempt at the test statistic, at least 2 correct expressions/values (to 3sf)
1st A1 for answers in the range 4.2~4.4
2nd A1 for correct comment in context based on their test statistic and their cv that mentions goals or manager. Dependent on 2nd M1 Condone mention of Po(1.05) in conclusion Score A0 for inconsistencies e.g. “significant” followed by “manager’s claim is justified”
B1 for seeing or using Po(6) M1 for \(1 - \mathrm{P}(X \leqslant 3)\) or \(1 - [\mathrm{P}(X = 0) + \mathrm{P}(X = 1) + \mathrm{P}(X = 2) + \mathrm{P}(X = 3)]\) A1 awrt 0.849
SC If B(2000, 0.003) is used and leads to awrt 0.849 allow B0 M1 A1 If no distribution indicated awrt 0.8488 scores B1M1A1 but any other awrt 0.849 scores B0M1A1
Mark scheme (b)
Scheme
Marks
\(Y\) = the number of errors in 8000 words. \(Y \sim \mathrm{Po}(24)\) so use a Normal approx
[N.B. Exact Po gives 0.242 and no \(\pm\) 0.5 gives 0.207]
(7)
(10 marks)
Notes
1st M1 for identifying the normal approximation 1st A1 for [mean = 24] and [sd = \(\sqrt{24}\) or var = 24]
These first two marks may be given if the following are seen in the standardisation formula : 24 \(\sqrt{24}\) or awrt 4.90
2nd M1 for attempting a continuity correction (20/ 28 \(\pm\) 0.5 is acceptable) 3rd M1 for standardising using their mean and their standard deviation. 2nd A1 correct z value awrt \(\pm\)0.71 or this may be awarded if see \(\dfrac{20.5 - 24}{\sqrt{24}}\) or \(\dfrac{27.5 - 24}{\sqrt{24}}\) 4th M1 for 1 - a probability from tables (must have an answer of < 0.5) 3rd A1 answer awrt 3 sig fig in range 0.237 – 0.239
2. An effect of a certain disease is that a small number of the red blood cells are deformed. Emily has this disease and the deformed blood cells occur randomly at a rate of 2.5 per ml of her blood. Following a course of treatment, a random sample of 2 ml of Emily’s blood is found to contain only 1 deformed red blood cell.
Stating your hypotheses clearly and using a 5% level of significance, test whether or not there has been a decrease in the number of deformed red blood cells in Emily’s blood. (6)
\(\mathrm{P}(X \leqslant 1) = 0.0404\) or CR \(X \leqslant 1\)
A1
[0.0404<0.05 ] this is significant or reject \(\mathrm{H}_0\) or it is in the critical region
M1
There is evidence of a decrease in the (mean) number/rate of deformed blood cells
A1
(6)
(6 marks)
Notes
1st B1 for \(\mathrm{H}_0\) must use lambda or mu; 5 or 2.5. 2nd B1 for \(\mathrm{H}_1\) must use lambda or mu; 5 or 2.5
1st M1 for use of Po(5) may be implied by probability( must be used not just seen) eg. \(\mathrm{P}(X = 1) = 0.0404 - \ldots\) would score M1 A0
1st A1 for 0.0404 seen or correct CR
2nd M1 for a correct statement (this may be contextual) comparing their probability and 0.05 (or comparing 1 with their critical region). Do not allow conflicting statements.
2nd A1 is not a follow through. Need the word decrease, number or rate and deformed blood cells for contextual mark.
If they have used \(\ne\) in \(\mathrm{H}_1\) they could get B1 B0 M1 A1 M1A0 mark as above except they gain the 1st A1 for \(\mathrm{P}(X \leqslant 1) = 0.0404\) or CR \(X \leqslant 0\) 2nd M1 for a correct statement (this may be contextual) comparing their probability and 0.025 (or comparing 1 with their critical region)
They may compare with 0.95 (one tail method) or 0.975 (two tail method) Probability is 0.9596.
(corrected from the printed mark scheme: printed “0.975 (one tail method)”)
1. A bag contains a large number of counters of which 15% are coloured red. A random sample of 30 counters is selected and the number of red counters is recorded.
(a) Find the probability of no more than 6 red counters in this sample. (2)
A second random sample of 30 counters is selected and the number of red counters is recorded.
(b) Using a Poisson approximation, estimate the probability that the total number of red counters in the combined sample of size 60 is less than 13. (3)
[ N.B. normal approximation gives 0.897, exact binomial gives 0.894]
(3)
(5 marks)
Notes
B1 may be implied by using Po(9). Common incorrect answer which implies this is 0.9261
M1 for a correct probability statement \(\mathrm{P}(X \leqslant 12)\) or \(\mathrm{P}(X \lt 13)\) or \(\mathrm{P}(X = 0) + \mathrm{P}(X = 1) + \ldots + \mathrm{P}(X = 12)\) (may be implied by long calculation) and attempt to evaluate this probability using their Poisson distribution.
Condone \(\mathrm{P}(X \leqslant 13) = 0.8758\) for B1 M1 A1
6. A web server is visited on weekdays, at a rate of 7 visits per minute. In a random one minute on a Saturday the web server is visited 10 times.
(a)
(i) Test, at the 10% level of significance, whether or not there is evidence that the rate of visits is greater on a Saturday than on weekdays. State your hypotheses clearly.
(ii) State the minimum number of visits required to obtain a significant result. (7)
(b) State an assumption that has been made about the visits to the server. (1)
In a random two minute period on a Saturday the web server is visited 20 times.
(c) Using a suitable approximation, test at the 10% level of significance, whether or not the rate of visits is greater on a Saturday. (6)
Special case for parts a and b If they use 0.1 do not treat as misread as it makes it easier. (a) M1 A0 if they have 0.3874 (b) M1 A1ft A0 they will get 0.2639 (c) Could get B1 B0 M1 A0
For any other values of \(p\) which are in the table do not use misread. Check using the tables. They could get (a) M1 A0 (b) M1 A1ft A0 (c) B1 B0 M1 A0
1. A botanist is studying the distribution of daisies in a field. The field is divided into a number of equal sized squares. The mean number of daisies per square is assumed to be 3. The daisies are distributed randomly throughout the field.
Find the probability that, in a randomly chosen square there will be
(a) more than 2 daisies, (3)
(b) either 5 or 6 daisies. (2)
The botanist decides to count the number of daisies, \(x\), in each of 80 randomly selected squares within the field. The results are summarised below
\[\textstyle\sum x = 295 \qquad \sum x^2 = 1386\]
(c) Calculate the mean and the variance of the number of daisies per square for the 80 squares. Give your answers to 2 decimal places. (3)
(d) Explain how the answers from part (c) support the choice of a Poisson distribution as a model. (1)
(e) Using your mean from part (c), estimate the probability that exactly 4 daisies will be found in a randomly selected square. (2)
Mark scheme (a)
Scheme
Marks
The random variable \(X\) is the number of daisies in a square. Poisson(3)
6. A call centre agent handles telephone calls at a rate of 18 per hour.
(a) Give two reasons to support the use of a Poisson distribution as a suitable model for the number of calls per hour handled by the agent. (2)
(b) Find the probability that in any randomly selected 15 minute interval the agent handles
(i) exactly 5 calls,
(ii) more than 8 calls. (5)
The agent received some training to increase the number of calls handled per hour. During a randomly selected 30 minute interval after the training the agent handles 14 calls.
(c) Test, at the 5% level of significance, whether or not there is evidence to support the suggestion that the rate at which the agent handles calls has increased. State your hypotheses clearly. (6)
Mark scheme (a)
Scheme
Marks
Calls occur singly Calls occur at a constant rate Calls occur independently or randomly.
B1 B1
(2)
Notes
any two of the 3 only need calls once
B1 B1 They must use calls at least once. Independently and randomly are the same reason. Award the first B1 if they only gain 1 mark.
Special case if they don’t put in the word calls but write two correct statements award B0B1
Mark scheme (b)
Scheme
Marks
(i) \(X \sim \mathrm{Po}(4.5)\) used or seen in (i) or (ii)
(i) M1 Po (4.5) may be implied by them using it in their calculations in (i) or (ii) M1 for \(\mathrm{P}(X \leqslant 5) - \mathrm{P}(X \leqslant 4)\) or \(\dfrac{\mathrm{e}^{-\lambda}\lambda^5}{5!}\) A1 only awrt 0.171
(ii) M1 for \(1 - \mathrm{P}(X \leqslant 8)\) A1 only awrt 0.0403
Mark scheme (c)
Scheme
Marks
\(\mathrm{H}_0 : \lambda = 9\ (\lambda = 18)\) \(\mathrm{H}_1 : \lambda \gt 9\ (\lambda \gt 18)\) may use \(\lambda\) or \(\mu\)
\(0.0739 \gt 0.05\) \(14 \leqslant 15\) Accept \(\mathrm{H}_0\). or it is not significant or a correct statement in context from their values
M1
There is insufficient evidence to say that the number of calls per hour handled by the agent has increased.
A1
(6)
(13 marks)
Notes
att \(\mathrm{P}(X \geqslant 14)\) | \(\mathrm{P}(X \geqslant 15)\) awrt 0.0739
B1 both. Must be one tail test. They may use \(\lambda\) or \(\mu\) and either 9 or 18 and match \(\mathrm{H}_0\) and \(\mathrm{H}_1\)
M1 Po (9) may be implied by them using it in their calculations. M1 attempt to find \(\mathrm{P}(X \geqslant 14)\) eg \(1 - \mathrm{P}(X \leqslant 13)\) or \(1 - \mathrm{P}(X \lt 14)\) A1 correct probability or CR
To get the next2 marks the null hypothesis must state or imply that \((\lambda) = 9\) or 18
M1 for a correct statement based on their probability or critical region or a correct contextualised statement that implies that.
A1. This depends on their M1 being awarded for accepting \(\mathrm{H}_0\). Conclusion in context. Must have calls per hour has not increased. Or the rate of calls has not increased. Any statement that has the word calls in and implies the rate not increasing e.g. no evidence that the rate of calls handled has increased Saying the number of calls has not increased gains A0 as it does not imply rate NB this is an A mark on EPEN
They may also attempt to find \(\mathrm{P}(X \lt 14) = 0.9261\) and compare with 0.95
B1 cao B1 also allow 5.50, 5.497, 5.4973, do not allow 5.5
Mark scheme (c)
Scheme
Marks
\(X \sim \mathrm{Po}(5.5)\)
M1 A1
\(\mathrm{P}(X \leqslant 2) = 0.0884\)
dM1 A1
(4)
(8 marks)
Notes
M1 for Poisson A1 for using Po (5.5) M1 this is dependent on the previous M mark. It is for attempting to find \(\mathrm{P}(X \leqslant 2)\) A1 awrt 0.0884
Special case If they use normal approximation they could get M0 A0 M1 A0 if they use 2.5 in their standardisation.
M1 for using Po (9) – other values you might see which imply Po (9) are 0.0550, 0.0415, 0.9780, 0.9585, 0.9889, 0.0111, 0.0062 or may be assumed by at least one correct region. A1 for \(X \leqslant 3\) or \(X \lt 4\) condone c1 or CR instead of \(X\) A1 for \(X \geqslant 16\) or \(X \gt 15\)
They must identify the critical regions at the end and not just have them as part of their working. Do not accept \(\mathrm{P}(X \leqslant 3)\) etc gets A0
Mark scheme (b)
Scheme
Marks
P(rejecting Ho) \(= 0.0212 + 0.0220\)
M1
\(= 0.0432\) or 0.0433
A1 cao
(2)
(5 marks)
Notes
(b) if they use 0.0212 and 0.0220 they can gain these marks regardless of the critical regions in part a. If they have not got the correct numbers they must be adding the values for their critical regions. (both smaller than 0.05) You may need to look these up. The most common table values for lambda = 9 are in this table
\(x\)
2
3
4
5
14
15
16
17
18
0.0062
0.0212
0.0550
0.1157
0.9585
0.9780
0.9889
0.9947
0.9976
A1 awrt 0.0432 or 0.0433
Special case If you see 0.0432 / 0.0433 and then they go and do something else with it eg 1 – 0.0432 award M1 A0
During term time, incoming calls to a school are thought to occur at a rate of 0.45 per minute. To test this, the number of calls during a random 20 minute interval, is recorded.
(b) Find the critical region for a two-tailed test of the hypothesis that the number of incoming calls occurs at a rate of 0.45 per 1 minute interval. The probability in each tail should be as close to 2.5% as possible. (5)
(c) Write down the actual significance level of the above test. (1)
In the school holidays, 1 call occurs in a 10 minute interval.
(d) Test, at the 5% level of significance, whether or not there is evidence that the rate of incoming calls is less during the school holidays than in term time. (5)
Mark scheme (a)
Scheme
Marks
(i) A hypothesis test is a mathematical procedure to examine a value of a population parameter proposed by the null hypothesis compared with an alternative hypothesis.
B1
(ii) The critical region is the range of valuesora test statistic or region where the test is significant
B1g
that would lead to the rejection of \(\mathrm{H}_0\).
B1h
(3)
Notes
(i) B1 Method for deciding between 2 hypothesis.
(ii) B1 range of values. This may be implied by other words. Not region on its own B1 which lead you to reject \(\mathrm{H}_0\)
Give the first B1 if only one mark awarded.
Mark scheme (b)
Scheme
Marks
Let X represent the number of incoming calls : \(X \sim \mathrm{Po}(9)\)
B1
From table \(\mathrm{P}(X \geqslant 16) = 0.0220\)
M1 A1
\(\mathrm{P}(x \leqslant 3) = 0.0212\)
A1
Critical region (\(x \leqslant 3\) or \(x \geqslant 16\))
B1
(5)
Notes
B1 using \(\mathrm{P_o}(9)\)
M1 attempting to find \(\mathrm{P}(X \geqslant 16)\) or \(\mathrm{P}(x \leqslant 3)\)
A1 0.0220 or \(\mathrm{P}(X \geqslant 16)\) A1 0.0212 or \(\mathrm{P}(x \leqslant 3)\) These 3 marks may be gained by seeing the numbers in part c
B1 correct critical region
A completely correct critical region will get all 5 marks. Half of the correct critical region eg \(x \leqslant 3\) or \(x \geqslant 17\) say would get B1 M1 A0 A1 B0 if the M1 A1 A1 not already awarded.
Mark scheme (c)
Scheme
Marks
Significance level \(= 0.0220 + 0.0212\) \(= 0.0432\) or 4.32%
\(0.0611 \gt 0.05.\) \(1 \geqslant 0\) or 1 not in the critical region There is evidence to Accept \(\mathrm{H}_0\) or it is not significant
M1
There is no evidence that there are less calls during school holidays.
B1cao
(5)
(14 marks)
Notes
B1 may use \(\lambda\) or \(\mu\). Needs both \(\mathrm{H}_0\) and \(\mathrm{H}_1\)
M1 using \(\mathrm{P_o}(4.5)\)
A1 correct probability or CR only
M1 correct statement based on their probability, \(\mathrm{H}_1\) and 0.05 or a correct contextualised statement that implies that.
B1 this is not a follow through. Conclusion in context. Must see the word calls in conclusion
If they get the correct CR with no evidence of using \(\mathrm{P_o}(4.5)\) they will get M0 A0
SC If they get the critical region \(X \leqslant 1\) they score M1 for rejecting \(\mathrm{H}_0\) and B1 for concluding the rate of calls in the holiday is lower.
(a) State two conditions under which a Poisson distribution is a suitable model to use in statistical work. (2)
The number of cars passing an observation point in a 10 minute interval is modelled by a Poisson distribution with mean 1.
(b) Find the probability that in a randomly chosen 60 minute period there will be
(i) exactly 4 cars passing the observation point,
(ii) at least 5 cars passing the observation point. (5)
The number of other vehicles, other than cars, passing the observation point in a 60 minute interval is modelled by a Poisson distribution with mean 12.
(c) Find the probability that exactly 1 vehicle, of any type, passes the observation point in a 10 minute period. (4)
Mark scheme (a)
Scheme
Marks
Events occur at a constant rate. Events occur independently or randomly. Events occur singly.
B1 B1
(2)
Notes
any two of the 3
B1 B1 Need the word events at least once. Independently and randomly are the same reason. Award the first B1 if they only gain 1 mark
Special case. If they have 2 of the 3 lines without the word events they get B0 B1
Mark scheme (b)
Scheme
Marks
Let \(X\) be the random variable the number of cars passing the observation point. \(\mathrm{Po}(6)\)
B1 Attempting to find both possibilities. May be implied by doing \(\mathrm{e}^{-\lambda_1} \times \lambda_2\mathrm{e}^{-\lambda_2} + \mathrm{e}^{-\lambda_2} \times \lambda_1\mathrm{e}^{-\lambda_1}\) any values of \(\lambda_1\) and \(\lambda_2\)
M1 finding one pair of form \(\mathrm{e}^{-\lambda_1} \times \lambda_2\mathrm{e}^{-\lambda_2}\) any values of \(\lambda_1\) and \(\lambda_2\)
A1 one pair correct
A1 awrt 0.149
(corrected from the printed mark scheme: the second product is printed as \(0.3674 \times 0.1353\); \(\mathrm{e}^{-1} = 0.3679\))
alternative
Scheme
Marks
\(\mathrm{P_o}(1 + 2) = \mathrm{P_o}(3)\)
B1
\(\mathrm{P}(X = 1) = 3\mathrm{e}^{-3}\)
M1 A1
\(= 0.149\)
A1
B1 for Po(3) M1 for attempting to find \(\mathrm{P}(X = 1)\) with Po(3) A1 \(3\mathrm{e}^{-3}\) A1 awrt 0.149
5. The number of tornadoes per year to hit a particular town follows a Poisson distribution with mean \(\lambda\). A weatherman claims that due to climate changes the mean number of tornadoes per year has decreased. He records the number of tornadoes \(x\) to hit the town last year.
To test the hypotheses \(\mathrm{H}_0 : \lambda = 7\) and \(\mathrm{H}_1 : \lambda \lt 7\), a critical region of \(x \leqslant 3\) is used.
(a) Find, in terms \(\lambda\) the power function of this test. (3)
(b) Find the size of this test. (2)
(c) Find the probability of a Type II error when \(\lambda = 4\). (2)
(a) Write down the conditions under which the Poisson distribution may be used as an approximation to the Binomial distribution. (2)
A call centre routes incoming telephone calls to agents who have specialist knowledge to deal with the call. The probability of the caller being connected to the wrong agent is 0.01
(b) Find the probability that 2 consecutive calls will be connected to the wrong agent. (2)
(c) Find the probability that more than 1 call in 5 consecutive calls are connected to the wrong agent. (3)
The call centre receives 1000 calls each day.
(d) Find the mean and variance of the number of wrongly connected calls. (3)
(e) Use a Poisson approximation to find, to 3 decimal places, the probability that more than 6 calls each day are connected to the wrong agent. (2)
Mark scheme (a)
Scheme
Marks
If \(X \sim \mathrm{B}(n, p)\) and
\(n\) is large, \(n \gt 50\)
B1
\(p\) is small, \(p \lt 0.2\)
B1
then \(X\) can be approximated by \(\mathrm{Po}(np)\)
3. An engineering company manufactures an electronic component. At the end of the manufacturing process, each component is checked to see if it is faulty.
Faulty components are detected at a rate of 1.5 per hour.
(a) Suggest a suitable model for the number of faulty components detected per hour. (1)
(b) Describe, in the context of this question, two assumptions you have made in part (a) for this model to be suitable. (2)
(c) Find the probability of 2 faulty components being detected in a 1 hour period. (2)
(d) Find the probability of at least one faulty component being detected in a 3 hour period. (3)
Mark scheme (a)
Scheme
Marks
\(X \sim \mathrm{Po}(1.5)\)
B1
(1)
Notes
B1 need Po and 1.5
Mark scheme (b)
Scheme
Marks
Faulty components occur at a constant rate. Faulty components occur independently or randomly. Faulty components occur singly.
2. Bacteria are randomly distributed in a river at a rate of 5 per litre of water. A new factory opens and a scientist claims it is polluting the river with bacteria. He takes a sample of 0.5 litres of water from the river near the factory and finds that it contains 7 bacteria. Stating your hypotheses clearly test, at the 5% level of significance, the claim of the scientist. (7)
\(0.0142 \lt 0.05\) \(7 \geqslant 6\) or 7 is in critical region or 7 is significant
M1
(Reject \(\mathrm{H}_0\).) There is significant evidence at the 5% significance level that the factory is polluting the river with bacteria. or The scientists claim is justified
B1
(7)
(7 marks)
Notes
1st B1 may use \(\lambda\) or \(\mu\)
1st M1 may be implied
2nd M1 att \(\mathrm{P}(X \geqslant 7)\) | \(\mathrm{P}(X \geqslant 6)\)
\(0.9858 \gt 0.95\) \(7 \geqslant 6\) or 7 is in critical region or 7 is significant
M1
(Reject \(\mathrm{H}_0\).) There is significant evidence at the 5% significance level that the factory is polluting the river with bacteria. or The scientists claim is justified
B1
(7)
1st B1 may use \(\lambda\) or \(\mu\)
1st M1 may be implied
2nd M1 att \(\mathrm{P}(X \lt 7)\) | \(\mathrm{P}(X \lt 6)\)
\(0.0142 \lt 0.025\) \(7 \geqslant 7\) or 7 is in critical region or 7 is significant
M1
(Reject \(\mathrm{H}_0\).) There is significant evidence at the 5% significance level that the factory is polluting the river with bacteria. or The scientists claim is justified
B1
(7)
1st B1 may use \(\lambda\) or \(\mu\)
2nd M1 att \(\mathrm{P}(X \geqslant 7)\) | \(\mathrm{P}(X \geqslant 7)\)
\(0.9858 \gt 0.975\) \(7 \geqslant 7\) or 7 is in critical region or 7 is significant
M1
(Reject \(\mathrm{H}_0\).) There is significant evidence at the 5% significance level that the factory is polluting the river with bacteria. or The scientists claim is justified
B1
(7)
1st B1 may use \(\lambda\) or \(\mu\)
2nd M1 att \(\mathrm{P}(X \lt 7)\) | \(\mathrm{P}(X \lt 7)\)
5. Rolls of cloth delivered to a factory contain defects at an average rate of \(\lambda\) per metre. A quality assurance manager selects a random sample of 15 metres of cloth from each delivery to test whether or not there is evidence that \(\lambda \gt 0.3\). The criterion that the manager uses for rejecting the hypothesis that \(\lambda = 0.3\) is that there are 9 or more defects in the sample.
(a) Find the size of the test. (2)
Table 1 gives some values, to 2 decimal places, of the power function of this test.
\(\lambda\)
0.4
0.5
0.6
0.7
0.8
0.9
1.0
Power
0.15
0.34
\(r\)
0.72
0.85
0.92
0.96
Table 1
(b) Find the value of \(r\). (2)
The manager would like to design a test, of whether or not \(\lambda \gt 0.3\), that uses a smaller length of cloth. He chooses a length of 10 m and requires the probability of a type I error to be less than 10%.
(c) Find the criterion to reject the hypothesis that \(\lambda = 0.3\) which makes the test as powerful as possible. (2)
(d) Hence state the size of this second test. (1)
Table 2 gives some values, to 2 decimal places, of the power function for the test in part (c).
\(\lambda\)
0.4
0.5
0.6
0.7
0.8
0.9
1.0
Power
0.21
0.38
0.55
0.70
\(s\)
0.88
0.93
Table 2
(e) Find the value of \(s\). (2)
(f) Using the same axes, on graph paper draw the graphs of the power functions of these two tests. (4)
(g)
(i) State the value of \(\lambda\) where the graphs cross.
(ii) Explain the significance of \(\lambda\) being greater than this value. (2)
The cost of wrongly rejecting a delivery of cloth with \(\lambda = 0.3\) is low. Deliveries of cloth with \(\lambda \gt 0.7\) are unusual.
(h) Suggest, giving your reasons, which the test manager should adopt. (2)
Mark scheme (a)
Scheme
Marks
\(X_1\) = no. of defects in 15 m. \(X_1 \sim \mathrm{Po}(4.5)\) Use of Po(4.5)
4. Breakdowns occur on a particular machine at random at a mean rate of 1.25 per week.
(a) Find the probability that fewer than 3 breakdowns occurred in a randomly chosen week. (4)
Over a 4 week period the machine was monitored. During this time there were 11 breakdowns.
(b) Test, at the 5% level of significance, whether or not there is evidence that the rate of breakdowns has changed over this period. State your hypotheses clearly. (7)
Mark scheme (a)
Scheme
Marks
Let \(X\) represent the number of breakdowns in a week. \(X \sim \mathrm{Po}(1.25)\)
6. An area of grass was sampled by placing a 1 m × 1 m square randomly in 100 places. The numbers of daisies in each of the squares were counted. It was decided that the resulting data could be modelled by a Poisson distribution with mean 2. The expected frequencies were calculated using the model.
The following table shows the observed and expected frequencies.
Number of daisies
Observed frequency
Expected frequency
0
8
13.53
1
32
27.07
2
27
\(r\)
3
18
\(s\)
4
10
9.02
5
3
3.61
6
1
1.20
7
0
0.34
\(\geqslant 8\)
1
\(t\)
(a) Find values for \(r\), \(s\) and \(t\). (4)
(b) Using a 5% significance level, test whether or not this Poisson model is suitable. State your hypotheses clearly. (7)
An alternative test might have been to estimate the population mean by using the data given.
(c) Explain how this would have affected the test. (2)
Mark scheme (a)
Scheme
Marks
\(r = 27.07\),
M1 A1
\(s = 18.04\),
B1
\(t = 0.11\) using tables or 0.12 using totals
B1ft
(4)
Mark scheme (b)
Scheme
Marks
\(\mathrm{H}_0\) : A Poisson model Po(2) is a suitable model. \(\mathrm{H}_1\) : A Poisson model Po(2) is not a suitable model. both
4. The number of accidents that occur at a crossroads has a mean of 3 per month. In order to improve the flow of traffic the priority given to traffic is changed. Colin believes that since the change in priority the number of accidents has increased. He tests his belief by recording the number of accidents \(x\) in the month following the change. Colin sets up the hypotheses \(\mathrm{H}_0 : \lambda = 3\) and \(\mathrm{H}_1 : \lambda \gt 3\), where \(\lambda\) is the mean number of accidents per month, and rejects the null hypothesis if \(x \gt 4\).
(a) Find the size of the test. (3)
The table gives the values of the power function of the test to two decimal places.
\(\lambda\)
4
5
6
7
Power
\(r\)
0.56
\(s\)
0.83
(b) Calculate the value of \(r\) and the value of \(s\). (2)
(c) Comment on the suitability of the test when \(\lambda = 4\). (1)
Mark scheme (a)
Scheme
Marks
Size of test \(= \mathrm{P}(X \gt 4 \mid \lambda = 3)\)
When \(\lambda = 4\), power \(= 0.37 \lt 0.5\) Probability of coming to correct conclusion is less than probability of coming to wrong conclusion. Not suitable.
B1
(1)
(6 marks)
Notes
(corrected from the printed mark scheme: the scheme prints “power = 0.27”; part (b) gives \(r = 0.37\))
5. The number of times per day a computer fails and has to be restarted is recorded for 200 days. The results are summarised in the table.
Number of restarts
Frequency
0
99
1
65
2
22
3
12
4
2
Test whether or not a Poisson model is suitable to represent the number of restarts per day. Use a 5% level of significance and state your hypothesis clearly. (12)
Mark scheme
Scheme
Marks
\(\mathrm{H}_0\): Poisson distribution is a suitable model \(\mathrm{H}_1\): Poisson distribution is not a suitable model both
Using \(\mathrm{P}(X = x) = \dfrac{0.765^x \mathrm{e}^{-0.765}}{x!}\) where \(X\) represents the number of restarts gives \(200 \times \mathrm{P}(X = x)\)
6. Over a long period of time, accidents happened on a stretch of road at random at a rate of 3 per month.
Find the probability that
(a) in a randomly chosen month, more than 4 accidents occurred, (3)
(b) in a three-month period, more than 4 accidents occurred. (2)
At a later date, a speed restriction was introduced on this stretch of road. During a randomly chosen month only one accident occurred.
(c) Test, at the 5% level of significance, whether or not there is evidence to support the claim that this speed restriction reduced the mean number of road accidents occurring per month. (4)
The speed restriction was kept on this road. Over a two-year period, 55 accidents occurred.
(d) Test, at the 5% level of significance, whether or not there is now evidence that this speed restriction reduced the mean number of road accidents occurring per month. (7)
Mark scheme (a)
Scheme
Marks
Let \(X\) represent number of accidents/month \(\therefore X \sim \mathrm{Po}(3)\)