Chi-Squared Tests

Includes hypothesis testingFrom an AS paper

Edexcel

Edexcel · Old spec

AS June 2025 Q4

EdexcelAS paperCurrent spec7 marksChi-Squared Tests

4. A 5-question test is taken by 80 students.

Each question was answered either correctly or incorrectly.

Number of questions answered correctly012345
Observed frequency152331920
(a) Show that the proportion of questions answered correctly by these 80 students is 0.3 (2)

Anisa believes that the number of questions answered correctly can be modelled using a binomial distribution.
In order to test her belief, Anisa first calculates some of the expected frequencies.

Number of questions answered correctly012345
Expected frequency13.45\(r\)\(s\)10.582.270.19
(b) Find the value of \(r\) and the value of \(s\) (3)
(c) Explain fully why there are 2 degrees of freedom for the test of Anisa’s belief. (2)

A2 June 2025 Q3

EdexcelCurrent spec12 marksIncludes hypothesis testingChi-Squared Tests

3. A journalist uses a gender equality test on some randomly chosen films.
She believes that whether or not a film passes the test is associated with the period in which the film is first released. Her data is summarised in Table 1.
The journalist decides to test whether the data supports her belief.

Table 1: Observed frequencies

Period →
Test result ↓
1990–19992000–20042005–2013Total
Pass457065180
Fail759055220
Total120160120400

Some of the expected frequencies she calculates are shown in Table 2 below.

Table 2: Expected frequencies

Period →
Test result ↓
1990–19992000–20042005–2013
Pass54
Fail66
(a) Complete Table 2 showing expected frequencies. (2)
(b) Write down hypotheses for a suitable test to assess the journalist’s belief. (1)
(c) Showing your working clearly, test the journalist’s belief using a 5% level of significance.
You should state your critical value and conclusion clearly. (6)

The journalist wants to publish her data and findings.
She decides to publish the data as percentages of pass and fail for each period, as shown in Table 3, rather than as frequencies.

Table 3: Percentages

Period →
Test result ↓
1990–19992000–20042005–2013
Pass (%)37.543.7554.17
Fail (%)62.556.2545.83
Total (%)100100100

The editor suggests carrying out the hypothesis test of the journalist’s belief using the percentages in Table 3.

(d)
(i) Describe the effect this would have on the test statistic, justifying your answer.
(ii) Explain whether or not the journalist should follow her editor’s suggestion. (3)

AS June 2025 Q1

EdexcelAS paperCurrent spec10 marksIncludes hypothesis testingChi-Squared Tests

1. A researcher is investigating the relationship between a person’s age and their preferred method of shopping.

A random sample of 300 people is taken and the results are summarised in the table below.

Preferred method of shopping
OnlineIn-storeTotal
Age18 – 30272350
31 – 50315990
51 – 64174360
65 and older3070100
Total105195300
(a) Write down suitable hypotheses for a test to determine whether or not there is evidence of an association between age and preferred method of shopping. (1)

The researcher assumes that the null hypothesis is true and uses the data in the table to find expected values.

(b)
(i) Identify the cell which would have the smallest expected value.
(ii) Calculate the expected value for this cell. (2)

The value of \(\displaystyle\sum \frac{(O-E)^2}{E}\) for the other 7 cells is 5.060

(c) Test, at the 5% level of significance, whether or not there is evidence of an association between age and preferred method of shopping.
You should state the test statistic, degrees of freedom, critical value and conclusion clearly. (5)
(d) Explain whether or not your conclusion to part (c) would be the same if the test was carried out at a 1% level of significance. (2)

AS June 2024 Q4

EdexcelAS paperCurrent spec15 marksIncludes hypothesis testingChi-Squared Tests

4. Robin shoots 8 arrows at a target each day for 100 days.

The number of times he hits the target each day is summarised in the table below.

Number of hits012345678
Frequency1103034174202

Misha believes that these data can be modelled by a binomial distribution.

(a) State, in context, two assumptions that are implied by the use of this model. (2)
(b) Find an estimate for the proportion of arrows Robin shoots that hit the target. (2)

Misha calculates expected frequencies, to 2 decimal places, as follows.

Number of hits012345678
Expected frequency2.8112.67\(r\)28.0519.73\(s\)2.500.400.03
(c) Find the value of \(r\) and the value of \(s\) (3)

Misha correctly used a suitable test to assess her belief.

(d)
(i) Explain why she used a test with 3 degrees of freedom. (2)
(ii) Complete the test using a 5% level of significance.
You should clearly state your hypotheses, test statistic, critical value and conclusion. (6)

A2 June 2024 Q3

EdexcelCurrent spec6 marksIncludes hypothesis testingChi-Squared Tests

3. Tisam took a survey of students’ favourite colours. The results are summarised in the table below.

Colour
RedBlueGreenYellowBlackTotal
Year group1–534151422388
6–92332129884
10–12528198868
Total6275453919240

Tisam carries out a suitable test to see if there is any association between favourite colour and year group.

(a) Write down the hypotheses for a suitable test. (1)

For her table, Tisam only needs to check one cell to show that none of the expected frequencies are less than 5

(b)
(i) Identify this cell, giving your reason.
(ii) Calculate the expected frequency for this cell. (2)

The test statistic for Tisam’s test is 38.449

(c) Using a 1% level of significance, complete the test.
You should state your critical value and conclusion clearly. (3)

AS June 2024 Q1

EdexcelAS paperCurrent spec6 marksIncludes hypothesis testingChi-Squared Tests

1. Sharma believes that each computer game he sells appeals equally to all age ranges.
To investigate this, he takes a random sample of 100 people who play these games and asks them which of the games \(A\), \(B\) or \(C\) they prefer.
The results are summarised in the table below.

Computer game\(A\)\(B\)\(C\)
Age range\(\lt 20\)8156
20 – 3021129
\(\gt 30\)61013
(a) Write down hypotheses for a suitable test to assess Sharma’s belief. (1)
(b) For the test, calculate the expected frequency for
(i) those players aged under 20 who prefer game \(C\)
(ii) those players aged between 20 and 30 who prefer game \(A\) (2)
(c) State the degrees of freedom of the test statistic for this test. (1)

Sharma correctly calculates the test statistic for this test to be 11.542 (to 3 decimal places).

(d) Using a 5% significance level, and stating your critical value, comment on Sharma’s belief. (2)

AS June 2023 Q4

EdexcelAS paperCurrent spec12 marksIncludes hypothesis testingChi-Squared Tests

4. Table 1 below shows the number of car breakdowns in the Snoreap district in each of 60 months.

Number of car breakdowns012345
Frequency1211191431

Table 1

Anja believes that the number of car breakdowns per month in Snoreap can be modelled by a Poisson distribution. Table 2 below shows the results of some of her calculations.

Number of car breakdowns01234\(\geqslant 5\)
Observed frequency \((O_i)\)1211191431
Expected frequency \((E_i)\)9.929.644.34

Table 2

(a) State suitable hypotheses for a test to investigate Anja’s belief. (1)
(b) Explain why Anja has changed the label of the final column to \(\geqslant 5\) (1)
(c) Showing your working clearly, complete Table 2 (4)
(d) Find the value of \(\dfrac{(O_i - E_i)^2}{E_i}\) when the number of car breakdowns is
(i) 1
(ii) 3 (2)
(e) Explain why Anja used 3 degrees of freedom for her test. (2)

The test statistic for Anja’s test is 6.54 to 2 decimal places.

(f) Stating the critical value and using a 5% level of significance, complete Anja’s test. (2)

A2 June 2023 Q3

EdexcelCurrent spec15 marksIncludes hypothesis testingChi-Squared Tests

3. In a class experiment, each day for 170 days, a child is chosen at random and spins a large cardboard coin 5 times and the number of heads is recorded.
The results are summarised in the following table.

Number of heads012345
Frequency31045623812

Marcus believes that a \(\mathrm{B}(5, 0.5)\) distribution can be used to model these data and he calculates expected frequencies, to 2 decimal places, as follows

Number of heads012345
Expected frequency\(r\)26.56\(s\)\(s\)26.56\(r\)
(a) Find the value of \(r\) and the value of \(s\) (3)
(b) Carry out a suitable test, at the 5% level of significance, to determine whether or not the \(\mathrm{B}(5, 0.5)\) distribution is a good model for these data.
You should state clearly your hypotheses, the test statistic and the critical value used. (6)

Nima believes that a better model for these data would be \(\mathrm{B}(5, p)\)

(c) Find a suitable estimate for \(p\) (1)

To test her model, Nima uses this value of \(p\), to calculate expected frequencies as follows

Number of heads012345
Expected frequency2.0714.6541.4458.6341.4711.74

The test statistic for Nima’s test is 1.62 (to 3 significant figures)

(d) State,
(i) giving your reasons, the degrees of freedom
(ii) the critical value
that Nima should use for a test at the 5% significance level. (3)
(e) With reference to Marcus’ and Nima’s test results, comment on
(i) the probability of the coin landing on heads,
(ii) the independence of the spins of the coin.
Give reasons for your answers. (2)

AS June 2023 Q2

EdexcelAS paperCurrent spec6 marksIncludes hypothesis testingChi-Squared Tests

2. A bag contains a large number of balls, all of the same size and weight. The balls are coloured Red, Blue or Yellow.

Jasmine asks each child in a group of 150 children to close their eyes, select a ball from the bag and show it to her. The child then replaces the ball and repeats the process a second time.

If both balls are the same colour the child receives a prize.

The results are given in the table below.

1st colour →
2nd colour ↓
RedBlueYellowTotal
Red31111860
Blue810927
Yellow2193363
Total603060150

Jasmine carries out a test, at the 5% level of significance, to see whether or not the colour of the 2nd ball is independent of the colour of the 1st ball.

(a) Calculate the expected frequencies for the cases where both balls are the same colour. (2)

The test statistic Jasmine obtained was 12.712 to three decimal places.

(b) Use this value to complete the test, stating the critical value and conclusion clearly. (3)

With reference to your calculations in part (a) and the nature of the experiment,

(c) give a plausible reason why Jasmine may have obtained her conclusion in part (b). (1)

AS June 2022 Q3

EdexcelAS paperCurrent spec9 marksIncludes hypothesis testingChi-Squared Tests

3. In a game, a coin is spun 5 times and the number of heads obtained is recorded.
Tao suggests playing the game 20 times and carrying out a chi-squared test to investigate whether the coin might be biased.

(a) Explain why playing the game only 20 times may cause problems when carrying out the test. (1)

Chris decides to play the game 500 times. The results are as follows

Number of heads012345
Observed frequency2279318114651

Chris decides to test whether or not the data can be modelled by a binomial distribution, with the probability of a head on each spin being 0.6

She calculates the expected frequencies, to 2 decimal places, as follows

Number of heads012345
Expected frequency5.1238.40115.20172.80129.6038.88
(b) State the number of degrees of freedom in Chris’ test, giving a reason for your answer. (1)
(c) Carry out the test at the 5% level of significance.
You should state your hypotheses, test statistic, critical value and conclusion clearly. (5)
(d) Showing your working, find an alternative model which would better fit Chris’ data. (2)

A2 June 2022 Q1

EdexcelCurrent spec9 marksIncludes hypothesis testingChi-Squared Tests

1. A researcher is investigating the number of female cubs present in litters of size 4
He believes that the number of female cubs in a litter can be modelled by \(\mathrm{B}(4, 0.5)\)
He randomly selects 100 litters each of size 4 and records the number of female cubs.
The results are recorded in the table below.

Number of female cubs01234
Observed number of litters103333159

He calculated the expected frequencies as follows

Number of female cubs01234
Expected number of litters6.25\(r\)\(s\)\(r\)6.25
(a) Find the value of \(r\) and the value of \(s\) (3)
(b) Carry out a suitable test, at the 5% level of significance, to determine whether or not the number of female cubs in a litter can be modelled by \(\mathrm{B}(4, 0.5)\)
You should clearly state your hypotheses and the critical value used. (6)

AS June 2022 Q1

EdexcelAS paperCurrent spec7 marksIncludes hypothesis testingChi-Squared Tests

1. Stuart is investigating a treatment for a disease that affects fruit trees. He has 400 fruit trees and applies the treatment to a random sample of these trees. The remainder of the trees have no treatment. He records the number of years, \(y\), that each fruit tree remains free from this disease.

The results are summarised in the table below.

Treatment
AppliedNot applied
Number of years free from this disease\(y \lt 1\)1525
\(1 \leqslant y \lt 2\)3561
\(2 \leqslant y\)124140

The data are to be used to determine whether or not there is an association between the application of the treatment and the number of years that a fruit tree remains free from this disease.

(a) Calculate the expected frequencies for
(i) Applied and \(y \lt 1\)
(ii) Not applied and \(1 \leqslant y \lt 2\) (2)

The value of \(\displaystyle\sum \frac{(O-E)^2}{E}\) for the other four classes is 2.642 to 3 decimal places.

(b) Test, at the 5% level of significance, whether or not there is an association between the application of the treatment and the number of years a fruit tree remains free from this disease.
You should state your hypotheses, test statistic, critical value and conclusion clearly. (5)

A2 October 2021 Q1

EdexcelCurrent spec7 marksIncludes hypothesis testingChi-Squared Tests

1. Kelly throws a tetrahedral die \(n\) times and records the number on which it lands for each throw.

She calculates the expected frequency for each number to be 43 if the die was unbiased.

The table below shows three of the frequencies Kelly records but the fourth one is missing.

Number1234
Frequency473436\(x\)
(a) Show that \(x = 55\) (1)

Kelly wishes to test, at the 5% level of significance, whether or not there is evidence that the tetrahedral die is unbiased.

(b) Explain why there are 3 degrees of freedom for this test. (1)
(c) Stating your hypotheses clearly and the critical value used, carry out the test. (5)

A2 October 2020 Q5

EdexcelCurrent spec13 marksIncludes hypothesis testingChi-Squared Tests

5. A factory produces pins.

An engineer selects 40 independent random samples of 6 pins produced at the factory and records the number of defective pins in each sample.

Number of defective pins0123456
Observed frequency191172010
(a) Show that the proportion of defective pins in the 40 samples is 0.15 (2)

The engineer suggests that the number of defective pins in a sample of 6 can be modelled using a binomial distribution.  Using the information from the sample above, a test is to be carried out at the 10% significance level, to see whether the data are consistent with the engineer’s suggested model.

The value of the test statistic for this test is 2.689

(b) Justifying the degrees of freedom used, carry out the test, at the 10% significance level, to see whether the data are consistent with the engineer’s suggested model.
State your hypotheses clearly. (8)

The engineer later discovers that the previously recorded information was incorrect.
The data should have been as follows.

Number of defective pins0123456
Observed frequency191163100
(c) Describe the effect this would have on the value of the test statistic that should be used for the hypothesis test.
Give reasons for your answer. (3)

AS October 2020 Q2

EdexcelAS paperCurrent spec15 marksIncludes hypothesis testingChi-Squared Tests

2. In an experiment, James flips a coin 3 times and records the number of heads. He carries out the experiment 100 times with his left hand and 100 times with his right hand.

Number of heads
0123
Left hand7294222
Right hand13353616
(a) Test, at the 5% level of significance, whether or not there is an association between the hand he flips the coin with and the number of heads.
You should state your hypotheses, the degrees of freedom and the critical value used for this test. (7)
(b) Assuming the coin is unbiased, write down the distribution of the number of heads in 3 flips. (1)
(c) Carry out a \(\chi^2\) test, at the 10% level of significance, to test whether or not the distribution you wrote down in part (b) is a suitable model for the number of heads obtained in the 200 trials of James’ experiment.
You should state your hypotheses, the degrees of freedom and the critical value used for this test. (7)

A2 June 2019 Q4

EdexcelCurrent spec19 marksIncludes hypothesis testingChi-Squared Tests

4. Liam and Simone are studying the distribution of oak trees in some woodland.  They divided the woodland into 80 equal squares and recorded the number of oak trees in each square.  The results are summarised in Table 1 below.

Number of oak trees in a square01234567 or more
Frequency142123131170

Table 1

Liam believes that the oak trees were deliberately planted, with 6 oak trees per square and that a constant proportion \(p\) of the oak trees survived.

(a) Suggest the model Liam should use to describe the number of oak trees per square. (2)

Liam decides to test whether or not his model is suitable and calculates the expected frequencies given in Table 2.

Number of oak trees in a square0 or 123456
Expected frequency5.5314.8924.2622.2410.872.21

Table 2

(b) Showing your working clearly, complete the test using a 5% level of significance.  You should state your critical value and conclusion clearly. (7)

Simone believes that a Poisson distribution could be used to model the number of oak trees per square.  She calculates the expected frequencies given in Table 3.

Number of oak trees in a square0 or 123456 or more
Expected frequency12.6916.07\(s\)14.58\(t\)9.37

Table 3

(c) Find the value of \(s\) and the value of \(t\), giving your answers to 2 decimal places. (4)
(d) Write down hypotheses to test the suitability of Simone’s model. (1)

The test statistic for this test is 8.749

(e) Complete the test.  Use a 5% level of significance and state your critical value and conclusion clearly. (3)
(f) Using the results of these tests, explain whether the origin of this woodland is likely to be cultivated or wild. (2)

AS June 2019 Q2

EdexcelAS paperCurrent spec7 marksIncludes hypothesis testingChi-Squared Tests

2. A spinner used for a game is designed to give scores with the following probabilities

Score12346
Probability\(\dfrac{3}{10}\)\(\dfrac{1}{10}\)\(\dfrac{1}{10}\)\(\dfrac{2}{5}\)\(\dfrac{1}{10}\)

The spinner is spun 80 times and the results are as follows

Score12346
Frequency15412418

Test, at the 10% level of significance, whether or not the spinner is giving scores as it is designed to do. Show your working and state your hypotheses clearly. (7)

AS June 2019 Q1

EdexcelAS paperCurrent spec6 marksIncludes hypothesis testingChi-Squared Tests

1. A leisure club offers a choice of one of three activities to its 150 members on a Tuesday evening. The manager believes that there may be an association between the choice of activity and the age of the member and collected the following data.

Activity
Age \(a\) years
BadmintonBowlsSnooker
\(a \lt 20\)933
\(20 \leqslant a \lt 40\)101014
\(40 \leqslant a \lt 50\)16155
\(50 \leqslant a \lt 60\)151311
\(a \geqslant 60\)4193
(a) Write down suitable hypotheses for a test of the manager’s belief. (1)

The manager calculated expected frequencies to use in the test.

(b) Calculate the expected frequency of members aged 60 or over who choose snooker, used by the manager. (1)
(c) Explain why there are 6 degrees of freedom used in this test. (2)

The test statistic used to test the manager’s belief is 19.583

(d) Using a 5% level of significance, complete the test of the manager’s belief. (2)

AS June 2018 Q4

EdexcelAS paperCurrent spec7 marksIncludes hypothesis testingChi-Squared Tests

4. Abram carried out a survey of two treatments for a plant fungus. The contingency table below shows the results of a survey of a random sample of 125 plants with the fungus.

Treatment
No actionPlant sprayed oncePlant sprayed every day
OutcomePlant died within a month151625
Plant survived for 1 – 6 months82510
Plant survived beyond 6 months7145

Abram calculates expected frequencies to carry out a suitable test. Seven of these are given in the partly-completed table below.

Treatment
No actionPlant sprayed oncePlant sprayed every day
OutcomePlant died within a month17.92
Plant survived for 1 – 6 months10.3218.9213.76
Plant survived beyond 6 months6.2411.448.32

The value of \(\displaystyle\sum \frac{(O-E)^2}{E}\) for the 7 given values is 8.29

Test at the 2.5% level of significance, whether or not there is an association between the treatment of the plants and their survival. State your hypotheses and conclusion clearly. (7)

AS June 2018 Q1

EdexcelAS paperCurrent spec10 marksIncludes hypothesis testingChi-Squared TestsPoisson Distribution

1. A researcher is investigating the distribution of orchids in a field. He believes that the Poisson distribution with a mean of 1.75 may be a good model for the number of orchids in each square metre. He randomly selects 150 non-overlapping areas, each of one square metre, and counts the number of orchids present in each square.

The results are recorded in the table below.

Number of orchids in each square metre0123456
Number of squares304235261160

He calculates the expected frequencies as follows

Number of orchids in each square metre012345More than 5
Number of squares26.0745.6239.9123.2810.193.57\(r\)
(a) Find the value of \(r\) giving your answer to 2 decimal places. (1)

The researcher will test, at the 5% level of significance, whether or not the data can be modelled by a Poisson distribution with mean 1.75

(b) State clearly the hypotheses required to test whether or not this Poisson distribution is a suitable model for these data. (1)

The test statistic for this test is 2.0 and the number of degrees of freedom to be used is 4

(c) Explain fully why there are 4 degrees of freedom. (2)
(d) Stating your critical value clearly, determine whether or not these data support the researcher’s belief. (2)

The researcher works in another field where the number of orchids in each square metre is known to have a Poisson distribution with mean 1.5

He randomly selects 200 non-overlapping areas, each of one square metre, in this second field, and counts the number of orchids present in each square.

(e) Using a Poisson approximation, show that the probability that he finds at least one square with exactly 6 orchids in it is 0.506 to 3 decimal places. (4)

S3 June 2018 Q6

EdexcelOld spec18 marksIncludes hypothesis testingChi-Squared Tests

6. David carries out an experiment with 4 identical dice, each with faces numbered 1 to 6. He rolls the 4 dice and counts the number of dice showing an even number on the uppermost face. He repeats this 150 times. The results are summarised in the table below.

No. of dice showing an even number01234
Frequency1245363918

David defines the random variable \(C\) as the number of dice showing an even number on the uppermost face when the four dice are thrown.

David claims that \(C \sim \mathrm{B}(4, 0.5)\)

(a) Stating your hypotheses clearly and using a 1% level of significance, test David’s claim. Show your working clearly. (9)

John claims that \(C \sim \mathrm{B}(4, p)\)

(b) Calculate an estimate of the value of \(p\) from the summary of the results of David’s experiment. Show your working clearly. (2)

John decides to test his claim. He calculates expected frequencies using the results of David’s experiment and obtains the following table.

No. of dice showing an even number01234
Expected frequency8.6536.00\(d\)39.00\(e\)
(c) Calculate, to 2 decimal places, the value of \(d\) and the value of \(e\) (3)
(d) State suitable hypotheses to test John’s claim. (1)

John obtained a test statistic of 16.9 and carries out a test at the 1% level of significance.

(e) State what conclusion John should make about his claim. (3)

S3 June 2017 Q4

EdexcelOld spec14 marksIncludes hypothesis testingChi-Squared Tests

4. A psychologist carries out a survey of the perceived body weight of 150 randomly chosen people. He asks them if they think they are underweight, about right or overweight. His results are summarised in the table below.

UnderweightAbout rightOverweight
Male202230
Female162834

The psychologist calculates two of the expected frequencies, to 2 decimal places, for a test of independence between perceived body weight and gender. These results are shown in the table below.

UnderweightAbout rightOverweight
Male17.28
Female18.72
(a) Complete the table of expected frequencies shown above. (2)
(b) Test, at the 10% level of significance, whether or not perceived body weight is independent of gender. State your hypotheses clearly. (7)

The psychologist now combines the male and female data to test whether or not body weight types are chosen equally.

(c) Find the smallest significance level, from the tables in the formula booklet, for which there is evidence of a preference. (5)

S3 June 2017 Q2

EdexcelOld spec10 marksIncludes hypothesis testingChi-Squared Tests

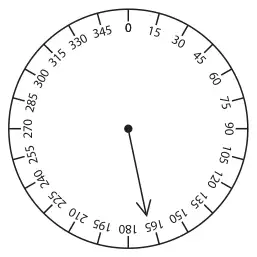
2.

Figure 1: a circular dial marked from 0 to 345 degrees in steps of 15, with a pointer from the centre
Figure 1

The pointer shown in Figure 1 is spun so that it comes to rest between 0 and 360 degrees.

Linda claims that it is equally likely to come to rest at any point between 0 and 360 degrees. She spins the pointer 100 times and her results are summarised in the table below. She calculates expected frequencies for some of the possible outcomes and these are also given in the table below.

Angle (degrees)0–4545–9090–180180–315315–360
Frequency1816182919
Expected frequency12.5\(a\)\(b\)\(c\)12.5
(a) Find the values of the missing expected frequencies \(a\), \(b\) and \(c\). (2)
(b) Stating your hypotheses clearly and using a 5% level of significance, test whether or not Linda’s claim is supported by these data. (8)

S3 June 2016 Q6

EdexcelOld spec17 marksIncludes hypothesis testingChi-Squared Tests

6. An airport manager carries out a survey of families and their luggage. Each family is allowed to check in a maximum of 4 suitcases. She observes 50 families at the check-in desk and counts the total number of suitcases each family checks in. The data are summarised in the table below.

Number of suitcases01234
Frequency6251261

The manager claims that the data can be modelled by a binomial distribution with \(p = 0.3\)

(a) Test the manager’s claim at the 5% level of significance. State your hypotheses clearly.
Show your working clearly and give your expected frequencies to 2 decimal places. (8)

The manager also carries out a survey of the time taken by passengers to check in. She records the number of passengers that check in during each of 100 five-minute intervals.

The manager makes a new claim that these data can be modelled by a Poisson distribution. She calculates the expected frequencies given in the table below.

Number of passengers012345 or more
Observed frequency540311860
Expected frequency16.5329.75\(r\)\(s\)7.233.64
(b) Find the value of \(r\) and the value of \(s\) giving your answers to 2 decimal places. (3)
(c) Stating your hypotheses clearly, use a 1% level of significance to test the manager’s new claim. (6)

S3 June 2016 Q2

EdexcelOld spec10 marksIncludes hypothesis testingChi-Squared Tests

2. A new drug to vaccinate against influenza was given to 110 randomly chosen volunteers. The volunteers were given the drug in one of 3 different concentrations, \(A\), \(B\) and \(C\), and then were monitored to see if they caught influenza. The results are shown in the table below.

\(A\)\(B\)\(C\)
Influenza12299
No influenza152322

Test, at the 10% level of significance, whether or not there is an association between catching influenza and the concentration of the new drug. State your hypotheses and show your working clearly. You should state your expected frequencies to 2 decimal places. (10)

S3 June 2015 Q6

EdexcelOld spec19 marksIncludes hypothesis testingChi-Squared Tests

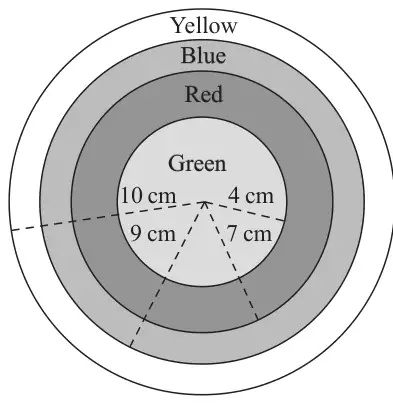
6.

Figure 1: a target of four concentric circles of radii 4 cm, 7 cm, 9 cm and 10 cm; the regions from the centre outwards are Green, Red, Blue and Yellow
Figure 1

The sketch in Figure 1 represents a target which consists of 4 regions formed from 4 concentric circles of radii 4 cm, 7 cm, 9 cm and 10 cm. The regions are coloured as labelled in Figure 1.
A random sample of 100 children each choose a point on the target and their results are summarised in the table below.

Colour of regionGreenRedBlueYellow
Frequency22392514

Caitland is trying to model the distribution of the points chosen by the children. She defines the random variable \(D\) to be the distance, in cm, of a point from the centre of the target and assumes \(D \sim \mathrm{U}[0, 10]\).

(a) Stating your hypotheses clearly and using a 1% level of significance, test whether or not U[0, 10] is a suitable model for these data. (9)

Henry claims that the points are randomly distributed over the target and the probability of a point being in any particular region is proportional to the area of that region.
He calculates expected frequencies and obtains the following table.

Colour of regionGreenRedBlueYellow
Expected frequency1633\(r\)\(s\)
(b) Find the value of \(r\) and the value of \(s\). (3)

Henry obtained a test statistic of 6.188 and no groups were pooled.

(c) State what conclusion Henry should make about his claim. (2)

Phoebe believes that the children chose the region of the target according to colour. She believes that boys and girls would favour different colours and splits the original data by gender to obtain the following table.

Observed frequencies

Colour of regionGreenRedBlueYellowTotal
Boys101210335
Girls1227151165
(d) State suitable hypotheses to test Phoebe’s belief. (1)

Phoebe calculated the following expected frequencies to carry out a suitable test.

Expected frequencies

Colour of regionGreenRedBlueYellow
Boys7.713.658.754.9
Girls14.325.3516.259.1
(e) Show how the value of 25.35 was obtained. (1)

Phoebe carried out the test using 2 degrees of freedom and a 10% level of significance.
She obtained a test statistic of 1.411

(f) Explain clearly why Phoebe used 2 degrees of freedom. (1)
(g) Stating your critical value clearly, determine whether or not these data support Phoebe’s belief. (2)

S3 June 2014 (R) Q6

EdexcelOld spec17 marksIncludes hypothesis testingChi-Squared Tests

6. Bags of £1 coins are paid into a bank. Each bag contains 20 coins.

The bank manager believes that 5% of the £1 coins paid into the bank are fakes. He decides to use the distribution \(X \sim \mathrm{B}(20, 0.05)\) to model the random variable \(X\), the number of fake £1 coins in each bag.

(a) State the assumptions necessary for the binomial distribution to be an appropriate model in this case. (2)

The bank manager checks a random sample of 150 bags of £1 coins and records the number of fake coins found in each bag. His results are summarised in Table 1.

Number of fake coins in each bag01234 or more
Observed frequency436226136
Expected frequency53.856.6\(r\)8.9\(s\)

Table 1

(b) Calculate the values of \(r\) and \(s\), giving your answers to 1 decimal place. (3)
(c) Carry out a hypothesis test, at the 5% significance level, to see if the data supports the bank manager’s statistical model. State your hypotheses clearly. (7)

The assistant manager thinks that a binomial distribution is a good model but suggests that the proportion of fake coins is higher than 5%. She calculates the actual proportion of fake coins in the sample and uses this value to carry out a new hypothesis test on the data. Her expected frequencies are shown in Table 2.

Number of fake coins in each bag01234 or more
Observed frequency436226136
Expected frequency44.555.733.212.54.1

Table 2

(d) Explain why there are 2 degrees of freedom in this case. (2)
(e) Given that she obtains a \(\chi^2\) test statistic of 2.67, test the assistant manager’s hypothesis that the binomial distribution is a good model for the number of fake coins in each bag. Use a 5% level of significance and state your hypotheses clearly. (3)

S3 June 2014 (R) Q2

EdexcelOld spec7 marksIncludes hypothesis testingChi-Squared Tests

2. A survey asked a random sample of 200 people their age and the main use of their mobile phone.

The results are shown in Table 1 below.

Main use of their mobile phone
InternetTextsPhone calls
AgeUnder 2027149
From 20 to 40323429
Over 40151921

Table 1

The data are to be used to test whether or not age and main use of their mobile phone are independent.

Table 2 shows the expected frequencies for each group, assuming people’s age and main use of their mobile phone are independent.

Main use of their mobile phone
InternetTextsPhone calls
AgeUnder 2018.516.7514.75
From 20 to 4035.1531.82528.025
Over 4020.3518.42516.225

Table 2

(a) For users under 20 choosing the Internet as the main use of their mobile phone,
(i) verify that the expected frequency is 18.5
(ii) show that the contribution to the \(\chi^2\) test statistic is 3.91 to 3 significant figures.
(2)
(b) Given that the \(\chi^2\) test statistic for the data is 9.893 to 3 decimal places, test at the 5% level of significance whether or not age and main use of their mobile phone are independent. State your hypotheses clearly. (5)

S3 June 2014 Q5

EdexcelOld spec13 marksIncludes hypothesis testingChi-Squared Tests

5. A research station is doing some work on the germination of a new variety of genetically modified wheat.

They planted 120 rows containing 7 seeds in each row.

The number of seeds germinating in each row was recorded. The results are as follows

Number of seeds germinating in each row01234567
Observed number of rows2611192532169
(a) Write down two reasons why a binomial distribution may be a suitable model. (2)
(b) Show that the probability of a randomly selected seed from this sample germinating is 0.6 (2)

The research station used a binomial distribution with probability 0.6 of a seed germinating. The expected frequencies were calculated to 2 decimal places. The results are as follows

Number of seeds germinating in each row01234567
Expected number of rows0.202.06\(s\)23.22\(t\)31.3515.683.36
(c) Find the value of \(s\) and the value of \(t\). (2)
(d) Stating your hypotheses clearly, test, at the 1% level of significance, whether or not the data can be modelled by a binomial distribution. (7)

S3 June 2014 Q3

EdexcelOld spec10 marksIncludes hypothesis testingChi-Squared Tests

3. A number of males and females were asked to rate their happiness under the headings “not happy”, “fairly happy” and “very happy”.

The results are shown in the table below

HappinessTotal
Not happyFairly happyVery happy
GenderFemale9433486
Male13251654
Total226850140

Stating your hypotheses, test at the 5% level of significance, whether or not there is evidence of an association between happiness and gender. Show your working clearly. (10)

S3 June 2013 (R) Q4

EdexcelOld spec12 marksIncludes hypothesis testingChi-Squared Tests

4. John thinks that a person’s eye colour is related to their hair colour. He takes a random sample of 600 people and records their eye and hair colours. The results are shown in Table 1.

Hair colour
BlackBrownRedBlondeTotal
Eye colourBrown451251558243
Blue34901058192
Hazel20381626100
Green62972365
Total10528248165600

Table 1

John carries out a \(\chi^2\) test in order to test whether eye colour and hair colour are related. He calculates the expected frequencies shown in Table 2.

Hair colour
BlackBrownRedBlonde
Eye colourBrown42.5114.219.466.8
Blue33.690.215.452.8
Hazel17.547827.5
Green11.430.65.217.9

Table 2

(a) Show how the value 47 in Table 2 has been calculated. (1)
(b) Write down the number of degrees of freedom John should use in this \(\chi^2\) test. (1)

Given that the value of the \(\chi^2\) statistic is 20.6, to 3 significant figures,

(c) find the smallest value of \(\alpha\) for which the null hypothesis will be rejected at the \(\alpha\)% level of significance. (1)
(d) Use the data from Table 1 to test at the 5% level of significance whether or not the proportions of people in the population with black, brown, red and blonde hair are in the ratio 2:6:1:3
State your hypotheses clearly. (9)

S3 June 2013 Q4

EdexcelOld spec14 marksIncludes hypothesis testingChi-Squared Tests

4. Customers at a post office are timed to see how long they wait until being served at the counter. A random sample of 50 customers is chosen and their waiting times, \(x\) minutes, are summarised in Table 1.

Waiting time in minutes (\(x\))Frequency
0–38
3–512
5–613
6–89
8–128

Table 1

(a) Show that an estimate of \(\bar{x} = 5.49\) and an estimate of \(s_x^2 = 6.88\) (3)

The post office manager believes that the customers’ waiting times can be modelled by a normal distribution.
Assuming the data is normally distributed, she calculates the expected frequencies for these data and some of these frequencies are shown in Table 2.

Waiting Time\(x \lt 3\)3–55–66–8\(x \gt 8\)
Expected Frequency8.5612.737.56\(a\)\(b\)

Table 2

(b) Find the value of \(a\) and the value of \(b\). (3)
(c) Test, at the 5% level of significance, the manager’s belief. State your hypotheses clearly. (8)

S3 June 2013 Q1

EdexcelOld spec10 marksIncludes hypothesis testingChi-Squared Tests

1. A doctor takes a random sample of 100 patients and measures their intake of saturated fats in their food and the level of cholesterol in their blood. The results are summarised in the table below.

Cholesterol level
Intake of saturated fats
HighLow
High128
Low2654

Using a 5% level of significance, test whether or not there is an association between cholesterol level and intake of saturated fats. State your hypotheses and show your working clearly. (10)

S3 June 2012 Q6

EdexcelOld spec14 marksIncludes hypothesis testingChi-Squared Tests

6. A total of 100 random samples of 6 items are selected from a production line in a factory and the number of defective items in each sample is recorded. The results are summarised in the table below.

Number of defective items0123456
Number of samples616202317108
(a) Show that the mean number of defective items per sample is 2.91 (2)

A factory manager suggests that the data can be modelled by a binomial distribution with \(n = 6\). He uses the mean from the sample above and calculates expected frequencies as shown in the table below.

Number of defective items0123456
Expected frequency1.8710.5424.82\(a\)22.018.29\(b\)
(b) Calculate the value of \(a\) and the value of \(b\) giving your answers to 2 decimal places. (4)
(c) Test, at the 5% level, whether or not the binomial distribution is a suitable model for the number of defective items in samples of 6 items.
State your hypotheses clearly. (8)

S3 June 2012 Q4

EdexcelOld spec10 marksIncludes hypothesis testingChi-Squared Tests

4. Two breeds of chicken are surveyed to measure their egg yield. The results are shown in the table below.

Egg yield
Breed
LowMediumHigh
Leghorn225226
Cornish14324

Showing each stage of your working clearly, test, at the 5% significance level, whether or not there is an association between egg yield and breed of chicken. State your hypotheses clearly. (10)

S3 June 2011 Q5

EdexcelOld spec13 marksIncludes hypothesis testingChi-Squared TestsPoisson Distribution

5. The number of hurricanes per year in a particular region was recorded over 80 years. The results are summarised in Table 1 below.

No of hurricanes, \(h\)01234567
Frequency0251720121212

Table 1

(a) Write down two assumptions that will support modelling the number of hurricanes per year by a Poisson distribution. (2)
(b) Show that the mean number of hurricanes per year from Table 1 is 4.4875 (2)
(c) Use the answer in part (b) to calculate the expected frequencies \(r\) and \(s\) given in Table 2 below to 2 decimal places. (3)
\(h\)01234567 or more
Expected frequency0.904.04\(r\)13.55\(s\)13.6510.2113.39

Table 2

(d) Test, at the 5% level of significance, whether or not the data can be modelled by a Poisson distribution. State your hypotheses clearly. (6)

S3 June 2011 Q3

EdexcelOld spec10 marksIncludes hypothesis testingChi-Squared Tests

3. A factory manufactures batches of an electronic component. Each component is manufactured in one of three shifts. A component may have one of two types of defect, \(D_1\) or \(D_2\), at the end of the manufacturing process. A production manager believes that the type of defect is dependent upon the shift that manufactured the component. He examines 200 randomly selected defective components and classifies them by defect type and shift. The results are shown in the table below.

Defect type
Shift
\(D_1\)\(D_2\)
First shift4518
Second shift5520
Third shift5012

Stating your hypotheses, test, at the 10% level of significance, whether or not there is evidence to support the manager’s belief. Show your working clearly. (10)

S3 June 2010 Q6

EdexcelOld spec12 marksIncludes hypothesis testingChi-Squared Tests

6. A total of 228 items are collected from an archaeological site. The distance from the centre of the site is recorded for each item. The results are summarised in the table below.

Distance from the centre of the site (m)0–11–22–44–66–99–12
Number of items221544375258

Test, at the 5% level of significance, whether or not the data can be modelled by a continuous uniform distribution. State your hypotheses clearly. (12)

S3 June 2010 Q5

EdexcelOld spec10 marksIncludes hypothesis testingChi-Squared Tests

5. A random sample of 100 people were asked if their finances were worse, the same or better than this time last year. The sample was split according to their annual income and the results are shown in the table below.

Finances
Annual income
WorseSameBetter
Under £15 00014119
£15 000 and above172029

Test, at the 5% level of significance, whether or not the relative state of their finances is independent of their income range. State your hypotheses and show your working clearly. (10)

S3 June 2009 Q5

EdexcelOld spec12 marksIncludes hypothesis testingChi-Squared TestsPoisson Distribution

5. The number of goals scored by a football team is recorded for 100 games. The results are summarised in Table 1 below.

Number of goalsFrequency
040
133
214
38
45

Table 1

(a) Calculate the mean number of goals scored per game. (2)

The manager claimed that the number of goals scored per match follows a Poisson distribution. He used the answer in part (a) to calculate the expected frequencies given in Table 2.

Number of goalsExpected Frequency
034.994
1\(r\)
2\(s\)
36.752
\(\geqslant 4\)2.221

Table 2

(b) Find the value of \(r\) and the value of \(s\) giving your answers to 3 decimal places. (3)
(c) Stating your hypotheses clearly, use a 5% level of significance to test the manager’s claim. (7)

S3 June 2008 Q6

EdexcelOld spec13 marksIncludes hypothesis testingChi-Squared Tests

6. Ten cuttings were taken from each of 100 randomly selected garden plants. The numbers of cuttings that did not grow were recorded.

The results are as follows

No. of cuttings which did not grow012345678, 9 or 10
Frequency11213020123210
(a) Show that the probability of a randomly selected cutting, from this sample, not growing is 0.223 (2)

A gardener believes that a binomial distribution might provide a good model for the number of cuttings, out of 10, that do not grow.

He uses a binomial distribution, with the probability 0.2 of a cutting not growing. The calculated expected frequencies are as follows

No. of cuttings which did not grow012345 or more
Expected frequency\(r\)26.84\(s\)20.138.81\(t\)
(b) Find the values of \(r\), \(s\) and \(t\). (4)
(c) State clearly the hypotheses required to test whether or not this binomial distribution is a suitable model for these data. (2)

The test statistic for the test is 4.17 and the number of degrees of freedom used is 4.

(d) Explain fully why there are 4 degrees of freedom. (2)
(e) Stating clearly the critical value used, carry out the test using a 5% level of significance. (3)

S3 June 2008 Q2

EdexcelOld spec11 marksIncludes hypothesis testingChi-Squared Tests

2. Students in a mixed sixth form college are classified as taking courses in either Arts, Science or Humanities. A random sample of students from the college gave the following results

Course
ArtsScienceHumanities
GenderBoy305035
Girl402042

Showing your working clearly, test, at the 1% level of significance, whether or not there is an association between gender and the type of course taken. State your hypotheses clearly. (11)

S3 June 2007 Q4

EdexcelOld spec13 marksIncludes hypothesis testingChi-Squared Tests

4. A quality control manager regularly samples 20 items from a production line and records the number of defective items \(x\). The results of 100 such samples are given in Table 1 below.

\(x\)01234567 or more
Frequency173119149730

Table 1

(a) Estimate the proportion of defective items from the production line. (2)

The manager claimed that the number of defective items in a sample of 20 can be modelled by a binomial distribution. He used the answer in part (a) to calculate the expected frequencies given in Table 2.

\(x\)01234567 or more
Expected frequency12.227.0\(r\)19.0\(s\)3.20.90.2

Table 2

(b) Find the value of \(r\) and the value of \(s\) giving your answers to 1 decimal place. (3)
(c) Stating your hypotheses clearly, use a 5% level of significance to test the manager’s claim. (7)
(d) Explain what the analysis in part (c) tells the manager about the occurrence of defective items from this production line. (1)

S3 June 2007 Q2

EdexcelOld spec10 marksIncludes hypothesis testingChi-Squared Tests

2. The Director of Studies at a large college believed that students’ grades in Mathematics were independent of their grades in English. She examined the results of a random group of candidates who had studied both subjects and she recorded the number of candidates in each of the 6 categories shown.

Maths grade A or BMaths grade C or DMaths grade E or U
English grade A or B252510
English grade C to U153015
(a) Stating your hypotheses clearly, test the Director’s belief using a 10% level of significance. You must show each step of your working. (9)

The Head of English suggested that the Director was losing accuracy by combining the English grades C to U in one row. He suggested that the Director should split the English grades into two rows, grades C or D and grades E or U as for Mathematics.

(b) State why this might lead to problems in performing the test. (1)

S3 June 2006 Q8

EdexcelOld spec13 marksIncludes hypothesis testingChi-Squared Tests

8. Five coins were tossed 100 times and the number of heads recorded. The results are shown in the table below.

Number of heads012345
Frequency6182934103
(a) Suggest a suitable distribution to model the number of heads when five unbiased coins are tossed. (2)
(b) Test, at the 10% level of significance, whether or not the five coins are unbiased. State your hypotheses clearly. (11)

S3 June 2006 Q6

EdexcelOld spec11 marksIncludes hypothesis testingChi-Squared Tests

6. A research worker studying colour preference and the age of a random sample of 50 children obtained the results shown below.

Age in yearsRedBlueTotals
412618
810717
126915
Totals282250

Using a 5% significance level, carry out a test to decide whether or not there is an association between age and colour preference. State your hypotheses clearly. (11)

S3 January 2006 Q6

EdexcelOld spec13 marksIncludes hypothesis testingChi-Squared TestsPoisson Distribution

6. An area of grass was sampled by placing a 1 m × 1 m square randomly in 100 places. The numbers of daisies in each of the squares were counted. It was decided that the resulting data could be modelled by a Poisson distribution with mean 2. The expected frequencies were calculated using the model.

The following table shows the observed and expected frequencies.

Number of daisiesObserved frequencyExpected frequency
0813.53
13227.07
227\(r\)
318\(s\)
4109.02
533.61
611.20
700.34
\(\geqslant 8\)1\(t\)
(a) Find values for \(r\), \(s\) and \(t\). (4)
(b) Using a 5% significance level, test whether or not this Poisson model is suitable. State your hypotheses clearly. (7)

An alternative test might have been to estimate the population mean by using the data given.

(c) Explain how this would have affected the test. (2)

S3 January 2006 Q4

EdexcelOld spec9 marksIncludes hypothesis testingChi-Squared Tests

4. People over the age of 65 are offered an annual flu injection. A health official took a random sample from a list of patients who were over 65. She recorded their gender and whether or not the offer of an annual flu injection was accepted or rejected. The results are summarised below.

GenderAcceptedRejected
Male170110
Female280140

Using a 5% significance level, test whether or not there is an association between gender and acceptance or rejection of an annual flu injection. State your hypotheses clearly. (9)

S3 June 2005 Q5

EdexcelOld spec12 marksIncludes hypothesis testingChi-Squared TestsPoisson Distribution

5. The number of times per day a computer fails and has to be restarted is recorded for 200 days. The results are summarised in the table.

Number of restartsFrequency
099
165
222
312
42

Test whether or not a Poisson model is suitable to represent the number of restarts per day. Use a 5% level of significance and state your hypothesis clearly. (12)

S3 June 2005 Q3

EdexcelOld spec11 marksIncludes hypothesis testingChi-Squared Tests

3. A researcher carried out a survey of three treatments for a fruit tree disease. The contingency table below shows the results of a survey of a random sample of 60 diseased trees.

No actionRemove diseased branchesSpray with chemicals
Tree died within 1 year1056
Tree survived for 1–4 years597
Tree survived beyond 4 years567

Test, at the 5% level of significance, whether or not there is any association between the treatment of the trees and their survival. State your hypotheses and conclusion clearly. (11)