Quality of Tests

Includes hypothesis testing

Edexcel

Edexcel · Old spec

A2 June 2025 Q7

EdexcelCurrent spec14 marksIncludes hypothesis testingGeometric & Negative BinomialQuality of Tests

7. A software company develops computer programs.
Its Lovelace program is found to glitch 7 times on average when it is run.

The company makes some alterations to improve the program.
It then tests to see if it has been successful in reducing the average number of glitches per run.
The glitches can be assumed to occur independently.

(a)
(i) State suitable hypotheses for the test.
(ii) Find the critical region for the test at a 10% level of significance.
(iii) State the size of the test. (4)

The altered program is actually found to glitch 5 times on average when run.

(b) Find the probability of a Type II error for the company’s test. (3)

Due to the high value of the probability of a Type II error in part (b), the company makes an entirely new version of the program.
The new version of the program is designed to have an average of fewer than \(k\) glitches per run.

The random variable \(T\) represents the number of runs of the program until a run with no glitches occurs.

(c) Write down the name of a suitable distribution for \(T\) (1)

If the new version has an average of \(\lambda\) glitches per run, this new version of the program will be tested using the hypotheses

\[\mathrm{H}_0: \lambda = k \qquad\qquad \mathrm{H}_1: \lambda \lt k\]

The company will reject \(\mathrm{H}_0\) if the first run without any glitches of the new version occurs within \(n\) runs.

(d) Show that the power function of the test is given by\[1 - (1 - \mathrm{e}^{-\lambda})^n\] (2)

The company requires \(\mathrm{P}(\text{Type II error}) \lt 0.2\)
Assuming that the new version of the program has an average of 2.75 glitches per run,

(e) find the minimum value of \(n\) (4)

A2 June 2024 Q5

EdexcelCurrent spec10 marksIncludes hypothesis testingQuality of Tests

5. Some of the components produced by a factory are defective. The management requires that no more than 3% of the components produced are defective.
Niluki monitors the production process and takes a random sample of \(n\) components.

(a) Write down the hypotheses Niluki should use in a test to assess whether or not the proportion of defective components is greater than 0.03 (1)

Niluki defines the random variable \(D_n\) to represent the number of defective components in a sample of size \(n\). She considers two tests A and B

In test A, Niluki uses \(n = 100\) and if \(D_{100} \geqslant 5\) she rejects \(\mathrm{H}_0\)

(b) Find the size of test A (2)

In test B, Niluki uses \(n = 80\) and

  • if \(D_{80} \geqslant 5\) she rejects \(\mathrm{H}_0\)
  • if \(D_{80} \leqslant 3\) she does not reject \(\mathrm{H}_0\)
  • if \(D_{80} = 4\) she takes a second random sample of size 80 and if \(D_{80} \geqslant 1\) in this second sample then she rejects \(\mathrm{H}_0\) otherwise she does not reject \(\mathrm{H}_0\)
(c) Find the size of test B (3)

Given that the actual proportion of defective components is 0.06

(d)
(i) find the power of test A
(ii) find the expected number of components sampled using test B (3)

Given also that, when the actual proportion of defective components is 0.06, the power of test B is 0.713

(e) suggest, giving your reasons, which test Niluki should use. (1)

A2 June 2024 Q2

EdexcelCurrent spec7 marksIncludes hypothesis testingPoisson DistributionQuality of Tests

2. The number of errors made by a secretary is modelled by a Poisson distribution with a mean of 2.4 per 100 words.

A 100-word piece of work completed by the secretary is selected at random.

(a) Find the probability that
(i) there are exactly 3 errors,
(ii) there are fewer than 2 errors. (2)

After a long holiday, a randomly selected piece of work containing 250 words completed by the secretary is examined to see if the rate of errors has changed.

(b) Stating your hypotheses clearly, and using a 5% level of significance, find the critical region for a suitable test. (4)
(c) Find \(\mathrm{P}(\text{Type I error})\) for the test in part (b) (1)

A2 June 2023 Q5

EdexcelCurrent spec8 marksIncludes hypothesis testingQuality of Tests

5. A machine fills cartons with juice.

The amount of juice in a carton is normally distributed with mean \(\mu\) ml and standard deviation 8 ml.

A manager wants to test whether or not the amount of juice in the cartons, \(X\) ml, is less than 330 ml. The manager takes a random sample of 25 cartons of juice and calculates the mean amount of juice \(\bar{x}\) ml.

(a) Using a 5% level of significance, find the critical region of \(\overline{X}\) for this test.
State your hypotheses clearly. (4)

The Director is concerned about the machine filling the cartons with more than 330 ml of juice as well as less than 330 ml of juice. The Director takes a sample of 55 cartons, records the mean amount of juice \(\bar{y}\) ml and uses a test with a critical region of

\[\{\overline{Y} \lt 328\} \cup \{\overline{Y} \gt 332\}\]
(b) Find \(\mathrm{P}(\text{Type I error})\) for the Director’s test. (2)

When \(\mu = 325\) ml

(c) find \(\mathrm{P}(\text{Type II error})\) for the test in part (a) (2)

A2 June 2022 Q7

EdexcelCurrent spec11 marksIncludes hypothesis testingQuality of Tests

7. A machine fills bags with flour. The weight of flour delivered by the machine into a bag, \(X\) grams, is normally distributed with mean \(\mu\) grams and standard deviation 30 grams.
To check if there is any change to the mean weight of flour delivered by the machine into each bag, Olaf takes a random sample of 10 bags. The weight of flour, \(x\) grams, in each bag is recorded and \(\bar{x} = 1020\)

(a) Test, at the 5% level of significance, \(\mathrm{H}_0: \mu = 1000\) against \(\mathrm{H}_1: \mu \neq 1000\) (4)

Olaf decides to alter the test so that the hypotheses are \(\mathrm{H}_0: \mu = 1000\) and \(\mathrm{H}_1: \mu \gt 1000\) but keeps the level of significance at 5%

He takes a second sample of size \(n\) and finds the critical region, \(\overline{X} \gt c\)

(b) Find an equation for \(c\) in terms of \(n\) (2)

When the true value of \(\mu\) is 1020 grams, the probability of making a Type II error is 0.0050, to 2 significant figures.

(c) Calculate the value of \(n\) and the value of \(c\) (5)

A2 October 2021 Q7

EdexcelCurrent spec8 marksIncludes hypothesis testingQuality of Tests

7. A manufacturer has a machine that produces lollipop sticks.
The length of a lollipop stick produced by the machine is normally distributed with unknown mean \(\mu\) and standard deviation 0.2

Farhan believes that the machine is not working properly and the mean length of the lollipop sticks has decreased.
He takes a random sample of size \(n\) to test, at the 1% level of significance, the hypotheses

\[\mathrm{H}_0: \mu = 15 \qquad \mathrm{H}_1: \mu \lt 15\]
(a) Write down the size of this test. (1)

Given that the actual value of \(\mu\) is 14.9

(b)
(i) calculate the minimum value of \(n\) such that the probability of a Type II error is less than 0.05
Show your working clearly. (6)
(ii) Farhan uses the same sample size, \(n\), but now carries out the test at a 5% level of significance.  Without doing any further calculations, state how this would affect the probability of a Type II error. (1)

A2 October 2021 Q5

EdexcelCurrent spec18 marksIncludes hypothesis testingGeometric & Negative BinomialQuality of Tests

5. Asha, Davinda and Jerry each have a bag containing a large number of counters, some of which are white and the rest are red.
Each person draws counters from their bag one at a time, notes the colour of the counter and returns it to their bag.

The probability of Asha getting a red counter on any one draw is 0.07

(a) Find the probability that Asha will draw at least 3 white counters before a red counter is drawn. (2)
(b) Find the probability that Asha gets a red counter for the second time on her 9th draw. (2)

The probability of Davinda getting a red counter on any one draw is \(p\).
Davinda draws counters until she gets \(n\) red counters.  The random variable \(D\) is the number of counters Davinda draws.

Given that the mean and the standard deviation of \(D\) are 4400 and 660 respectively,

(c) find the value of \(p\). (4)

Jerry believes that his bag contains a smaller proportion of red counters than Asha’s bag. To test his belief, Jerry draws counters from his bag until he gets a red counter.  Jerry defines the random variable \(J\) to be the number of counters drawn up to and including the first red counter.

(d) Stating your hypotheses clearly and using a 10% level of significance, find the critical region for this test. (5)

Jerry gets a red counter for the first time on his 34th draw.

(e) Giving a reason for your answer, state whether or not there is evidence that Jerry’s bag contains a smaller proportion of red counters than Asha’s bag. (2)

Given that the probability of Jerry getting a red counter on any one draw is 0.011

(f) show that the power of the test is 0.702 to 3 significant figures. (3)

A2 October 2020 Q7

EdexcelCurrent spec15 marksIncludes hypothesis testingCentral Limit TheoremQuality of Tests

7. A six-sided die has sides labelled 1, 2, 3, 4, 5 and 6

The random variable \(S\) represents the score when the die is rolled.

Alicia rolls the die 45 times and the mean score, \(\overline{S}\), is calculated.

Assuming the die is fair and using a suitable approximation,

(a) find, to 3 significant figures, the value of \(k\) such that \(\mathrm{P}(\overline{S} \lt k) = 0.05\) (8)
(b) Explain the relevance of the Central Limit Theorem in part (a). (2)

Alicia considers the following hypotheses:

\(\mathrm{H}_0\): The die is fair

\(\mathrm{H}_1\): The die is not fair

If \(\overline{S} \lt 3.1\) or \(\overline{S} \gt 3.9\), then \(\mathrm{H}_0\) will be rejected.

Given that the true distribution of \(S\) has mean 4 and variance 3

(c) find the power of this test. (3)
(d) Describe what would happen to the power of this test if Alicia were to increase the number of rolls of the die.
Give a reason for your answer. (2)

A2 October 2020 Q1

EdexcelCurrent spec13 marksIncludes hypothesis testingPoisson DistributionQuality of Tests

1. The number of customers entering Jeff’s supermarket each morning follows a Poisson distribution.

Past information shows that customers enter at an average rate of 2 every 5 minutes.

Using this information,

(a)
(i) find the probability that exactly 26 customers enter Jeff’s supermarket during a randomly selected 1-hour period one morning, (2)
(ii) find the probability that at least 21 customers enter Jeff’s supermarket during a randomly selected 1-hour period one morning. (2)

A rival supermarket is opened nearby.  Following its opening, the number of customers entering Jeff’s supermarket over a randomly selected 40-minute period is found to be 10

(b) Test, at the 5% significance level, whether or not there is evidence of a decrease in the rate of customers entering Jeff’s supermarket.  State your hypotheses clearly. (4)

A further randomly selected 20-minute period is observed and the hypothesis test is repeated.
Given that the true rate of customers entering Jeff’s supermarket is now 1 every 5 minutes,

(c) calculate the probability of a Type II error. (5)

A2 June 2019 Q5

EdexcelCurrent spec12 marksIncludes hypothesis testingPoisson DistributionQuality of Tests

5. Information was collected about accidents on the Seapron bypass.  It was found that the number of accidents per month could be modelled by a Poisson distribution with mean 2.5

Following some work on the bypass, the numbers of accidents during a series of 3-month periods were recorded.  The data were used to test whether or not there was a change in the mean number of accidents per month.

(a) Stating your hypotheses clearly and using a 5% level of significance, find the critical region for this test.  You should state the probability in each tail. (5)
(b) State \(\mathrm{P}(\text{Type I error})\) using this test. (1)

Data from the series of 3-month periods are recorded for 2 years.

(c) Find the probability that at least 2 of these 3-month periods give a significant result. (3)

Given that the number of accidents per month on the bypass, after the work is completed, is actually 2.1 per month,

(d) find \(\mathrm{P}(\text{Type II error})\) for the test in part (a) (3)

S4 June 2018 Q5

EdexcelOld spec11 marksIncludes hypothesis testingQuality of Tests

5. A machine makes posts. The length of a post is normally distributed with unknown mean \(\mu\) and standard deviation 4 cm.

A random sample of size \(n\) is taken to test, at the 5% significance level, the hypotheses

\[\mathrm{H}_0 : \mu = 150 \qquad\qquad \mathrm{H}_1 : \mu \gt 150\]
(a) State the probability of a Type I error for this test. (1)

The manufacturer requires the probability of a Type II error to be less than 0.1 when the actual value of \(\mu\) is 152

(b) Calculate the minimum value of \(n\). (10)

S4 June 2017 Q2

EdexcelOld spec8 marksIncludes hypothesis testingPoisson DistributionQuality of Tests

2. The number of accidents per year in Daftstown follows a Poisson distribution with mean \(\lambda\). The value of \(\lambda\) has previously been 6 but Jonty claims that since the Council increased the speed limit, the value of \(\lambda\) has increased.

Jonty records the number of accidents in Daftstown in the first year after the speed limit was increased. He plans to test, at the 5% significance level, whether or not there is evidence of an increase in the mean number of accidents in Daftstown per year.

(a) Stating your hypotheses clearly, calculate the probability of a Type I error for this test. (4)

Given that there were 9 accidents in the first year after the speed limit was increased,

(b) state, giving a reason, whether or not there is evidence to support Jonty’s claim. (2)
(c) Given that the value of \(\lambda\) has actually increased to 8, calculate the probability of drawing the conclusion, using this test, that the number of accidents per year in Daftstown has not increased. (2)

S4 June 2016 Q4

EdexcelOld spec9 marksIncludes hypothesis testingQuality of Tests

4. A manufacturer produces boxes of screws containing short screws and long screws. The manufacturer claims that the probability, \(p\), of a randomly selected screw being long, is 0.5

A shopkeeper does not believe the manufacturer’s claim. He designs two tests, \(A\) and \(B\), to test the hypotheses \(\mathrm{H}_0 : p = 0.5\) and \(\mathrm{H}_1 : p \lt 0.5\)

In test \(A\), a random sample of 10 screws is taken from a box of screws and \(\mathrm{H}_0\) is rejected if there are fewer than 3 long screws.

In test \(B\), a random sample of 5 screws is taken from a box of screws and \(\mathrm{H}_0\) is rejected if there are no long screws, otherwise a second random sample of 5 screws is taken from a box of screws. If there are no long screws in this second sample \(\mathrm{H}_0\) is rejected, otherwise it is accepted.

(a) Find the size of test \(A\). (1)
(b) Find the size of test \(B\). (3)
(c) Find an expression for the power function of test \(B\) in terms of \(p\). (2)

Some values, to 2 decimal places, of the power function for test \(A\) and the power function for test \(B\) are given in the table below.

\(p\)0.10.20.30.4
Power test \(A\)0.93\(r\)0.380.17
Power test \(B\)0.830.550.310.15
(d) Find the value of \(r\). (1)

The shopkeeper believes that the value of \(p\) is less than 0.4

(e) Suggest which of the tests the shopkeeper should use. Give a reason for your answer. (2)

S4 June 2016 Q3

EdexcelOld spec6 marksIncludes hypothesis testingQuality of Tests

3. A jar contains a large number of sweets which have either soft centres or hard centres. The jar is thought to contain equal proportions of sweets with soft centres and sweets with hard centres. A random sample of 20 sweets is taken from the jar and the number of sweets with hard centres is recorded.

(a) Using a 5% level of significance, find the critical region for a two-tailed test of the hypothesis that there are equal proportions of sweets with soft centres and sweets with hard centres in the jar. (2)
(b) Calculate the probability of a Type I error for this test. (2)

Given that there are 3 times as many sweets with soft centres as there are sweets with hard centres,

(c) calculate the probability of a Type II error for this test. (2)

S4 June 2015 Q4

EdexcelOld spec11 marksIncludes hypothesis testingQuality of Tests

4. A poultry farm produces eggs which are sold in boxes of 6. The farmer believes that the proportion, \(p\), of eggs that are cracked when they are packed in the boxes is approximately 5%. She decides to test the hypotheses

\[\mathrm{H}_0 : p = 0.05 \quad \text{against} \quad \mathrm{H}_1 : p \gt 0.05\]

To test these hypotheses she randomly selects a box of eggs and rejects \(\mathrm{H}_0\) if the box contains 2 or more eggs that are cracked. If the box contains 1 egg that is cracked, she randomly selects a second box of eggs and rejects \(\mathrm{H}_0\) if it contains at least 1 egg that is cracked. If the first or the second box contains no cracked eggs, \(\mathrm{H}_0\) is immediately accepted and no further boxes are sampled.

(a) Show that the power function of this test is \[1 - (1 - p)^6 - 6p(1 - p)^{11}\] (3)
(b) Calculate the size of this test. (2)

Given that \(p = 0.1\)

(c) find the expected number of eggs inspected each time this test is carried out, giving your answer correct to 3 significant figures, (3)
(d) calculate the probability of a Type II error. (2)

Given that \(p = 0.1\) is an unacceptably high value for the farmer,

(e) use your answer from part (d) to comment on the farmer’s test. (1)

S4 June 2014 (R) Q2

EdexcelOld spec7 marksIncludes hypothesis testingPoisson DistributionQuality of Tests

2. The cloth produced by a certain manufacturer has defects that occur randomly at a constant rate of \(\lambda\) per square metre. If \(\lambda\) is thought to be greater than 1.5 then action has to be taken.

Using \(\mathrm{H}_0 : \lambda = 1.5\) and \(\mathrm{H}_1 : \lambda \gt 1.5\) a quality control officer takes a 4 m\(^2\) sample of cloth and rejects \(\mathrm{H}_0\) if there are 11 or more defects. If there are 8 or fewer defects she accepts \(\mathrm{H}_0\). If there are 9 or 10 defects a second sample of 4 m\(^2\) is taken and \(\mathrm{H}_0\) is rejected if there are 11 or more defects in this second sample, otherwise it is accepted.

(a) Find the size of this test. (4)
(b) Find the power of this test when \(\lambda = 2\) (3)

S4 June 2014 Q5

EdexcelOld spec11 marksIncludes hypothesis testingQuality of Tests

5. A statistician believes a coin is biased and the probability, \(p\), of getting a head when the coin is tossed is less than 0.5

The statistician decides to test this by tossing the coin 10 times and recording the number, \(X\), of heads. He sets up the hypotheses \(\mathrm{H}_0 : p = 0.5\) and \(\mathrm{H}_1 : p \lt 0.5\) and rejects the null hypothesis if \(x \lt 3\)

(a) Find the size of the test. (1)
(b) Show that the power function of this test is \[(1 - p)^8\,(36p^2 + 8p + 1)\] (3)

Table 1 gives values, to 2 decimal places, of the power function for the statistician’s test.

\(p\)0.10.150.20.250.30.350.40.45
Power0.930.82\(r\)0.530.380.26\(s\)0.10

Table 1

(c) Calculate the value of \(r\) and the value of \(s\). (2)
(d) Draw the graph of the power function for the statistician’s test. (2)
(e) Find the range of values of \(p\) for which the probability of accepting the coin as unbiased, when in fact it is biased, is less than or equal to 0.4 (3)

S4 June 2014 Q2

EdexcelOld spec7 marksIncludes hypothesis testingPoisson DistributionQuality of Tests

2.

(a) Define
(i) a Type I error,
(ii) a Type II error. (2)

Rolls of material, manufactured by a machine, contain defects at a mean rate of 6 per roll.

The machine is modified. A single roll is selected at random and a test is carried out to see whether or not the mean number of defects per roll has decreased. The significance level is chosen to be as close as possible to 5%.

(b) Calculate the probability of a Type I error for this test. (3)
(c) Given that the true mean number of defects per roll of material made by the machine is now 4, calculate the probability of a Type II error. (2)

S4 June 2013 (R) Q7

EdexcelOld spec9 marksIncludes hypothesis testingQuality of Tests

7. A machine produces bricks. The lengths, \(x\) mm, of the bricks are distributed \(\mathrm{N}(\mu, 2^2)\).
At the start of each week a random sample of \(n\) bricks is taken to check the machine is working correctly.
A test is then carried out at the 1% level of significance with

\[\mathrm{H}_0 : \mu = 202 \quad \text{and} \quad \mathrm{H}_1 : \mu \lt 202\]
(a) Find, in terms of \(n\), the critical region of the test. (3)

The probability of a type II error, when \(\mu = 200\), is less than 0.05

(b) Find the minimum value of \(n\). (6)

S4 June 2013 (R) Q3

EdexcelOld spec10 marksIncludes hypothesis testingPoisson DistributionQuality of Tests

3. The number of houses sold per week by a firm of estate agents follows a Poisson distribution with mean 2. The firm believes that the appointment of a new salesman will increase the number of houses sold. The firm tests its belief by recording the number of houses sold, \(x\), in the week following the appointment. The firm sets up the hypotheses \(\mathrm{H}_0 : \lambda = 2\) and \(\mathrm{H}_1 : \lambda \gt 2\), where \(\lambda\) is the mean number of houses sold per week, and rejects the null hypothesis if \(x \geqslant 3\)

(a) Find the size of the test. (2)
(b) Show that the power function for this test is \[1 - \frac{1}{2}\mathrm{e}^{-\lambda}(2 + 2\lambda + \lambda^2)\] (3)

The table below gives the values of the power function to 2 decimal places.

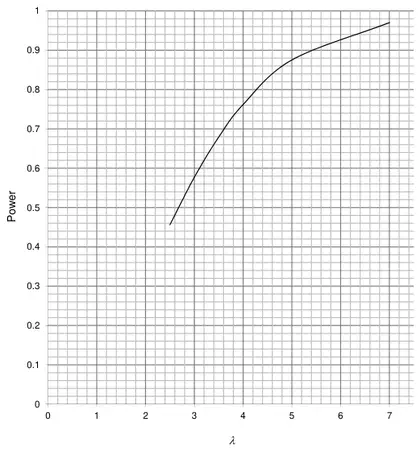
\(\lambda\)2.53.03.54.05.07.0
Power0.46\(r\)0.68\(s\)0.880.97

Table 1

(c) Calculate the values of \(r\) and \(s\). (2)
(d) Draw a graph of the power function. (2)
(e) Find the range of values of \(\lambda\) for which the power of this test is greater than 0.6 (1)

S4 June 2013 Q5

EdexcelOld spec17 marksIncludes hypothesis testingPoisson DistributionQuality of Tests

5. Water is tested at various stages during a purification process by an environmental scientist. A certain organism occurs randomly in the water at a rate of \(\lambda\) every 10 ml. The scientist selects a random sample of 20 ml of water to check whether there is evidence that \(\lambda\) is greater than 1. The criterion the scientist uses for rejecting the hypothesis that \(\lambda = 1\) is that there are 4 or more organisms in the sample of 20 ml.

(a) Find the size of the test. (2)
(b) When \(\lambda = 2.5\) find P(Type II error). (2)

A statistician suggests using an alternative test. The statistician’s test involves taking a random sample of 10 ml and rejecting the hypothesis that \(\lambda = 1\) if 2 or more organisms are present but accepting the hypothesis if no organisms are in the sample. If only 1 organism is found then a second random sample of 10 ml is taken and the hypothesis is rejected if 2 or more organisms are present, otherwise the hypothesis is accepted.

(c) Show that the power of the statistician’s test is given by \[1 - \mathrm{e}^{-\lambda} - \lambda(1 + \lambda)\mathrm{e}^{-2\lambda}\] (4)

Table 1 below gives some values, to 2 decimal places, of the power function of the statistician’s test.

\(\lambda\)1.522.533.54
Power0.590.750.86\(r\)0.960.97

Table 1

(d) Find the value of \(r\). (1)

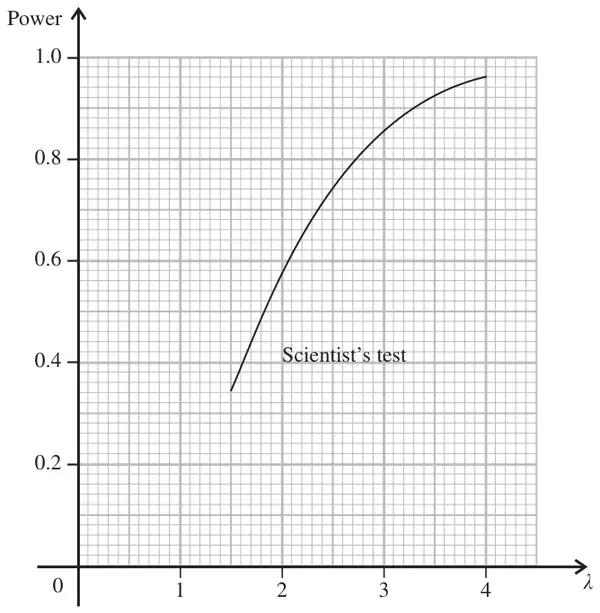
Figure 1 shows a graph of the power function for the scientist’s test.

Figure 1: graph of power against lambda for the scientist’s test, lambda from 1.5 to 4
Figure 1
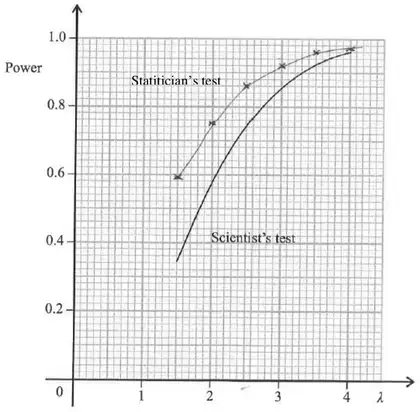
(e) On the same axes draw the graph of the power function for the statistician’s test. (2)

Given that it takes 20 minutes to collect and test a 20 ml sample and 15 minutes to collect and test a 10 ml sample

(f) show that the expected time of the statistician’s test is slower than the scientist’s test for \(\lambda\mathrm{e}^{-\lambda} \gt \dfrac{1}{3}\) (4)
(g) By considering the times when \(\lambda = 1\) and \(\lambda = 2\) together with the power curves in part (e) suggest, giving a reason, which test you would use. (2)

S4 June 2011 Q4

EdexcelOld spec12 marksIncludes hypothesis testingQuality of Tests

4. A proportion \(p\) of letters sent by a company are incorrectly addressed and if \(p\) is thought to be greater than 0.05 then action is taken.

Using \(\mathrm{H}_0 : p = 0.05\) and \(\mathrm{H}_1 : p \gt 0.05\), a manager from the company takes a random sample of 40 letters and rejects \(\mathrm{H}_0\) if the number of incorrectly addressed letters is more than 3.

(a) Find the size of this test. (2)
(b) Find the probability of a Type II error in the case where \(p\) is in fact 0.10 (2)

Table 1 below gives some values, to 2 decimal places, of the power function of this test.

\(p\)0.0750.1000.1250.1500.1750.2000.225
Power0.35\(s\)0.750.870.940.970.99

Table 1

(c) Write down the value of \(s\). (1)

A visiting consultant uses an alternative system to test the same hypotheses. A sample of 15 letters is taken. If these are all correctly addressed then \(\mathrm{H}_0\) is accepted. If 2 or more are found to have been incorrectly addressed then \(\mathrm{H}_0\) is rejected. If only one is found to be incorrectly addressed then a further random sample of 15 is taken and \(\mathrm{H}_0\) is rejected if 2 or more are found to have been incorrectly addressed in this second sample, otherwise \(\mathrm{H}_0\) is accepted.

(d) Find the size of the test used by the consultant. (3)

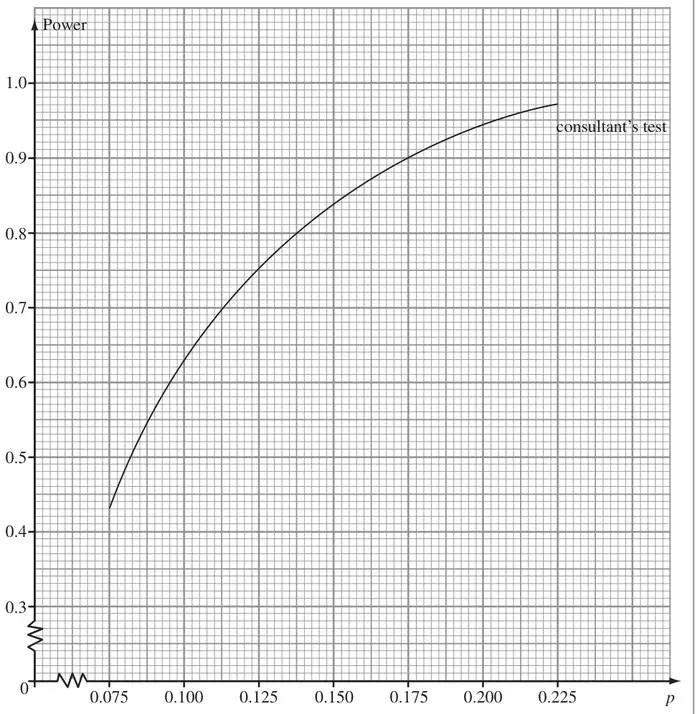
Figure 1 shows the graph of the power function of the test used by the consultant.

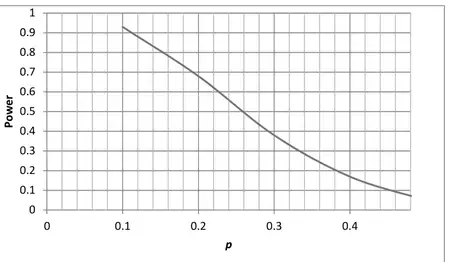
Figure 1: graph of power against p for the consultant’s test, p from 0.075 to 0.225
Figure 1
(e) On Figure 1 draw the graph of the power function of the manager’s test. (2)
(f) State, giving your reasons, which test you would recommend. (2)

S4 June 2010 Q3

EdexcelOld spec12 marksIncludes hypothesis testingQuality of Tests

3. A manager in a sweet factory believes that the machines are working incorrectly and the proportion \(p\) of underweight bags of sweets is more than 5%. He decides to test this by randomly selecting a sample of 5 bags and recording the number \(X\) that are underweight. The manager sets up the hypotheses \(\mathrm{H}_0 : p = 0.05\) and \(\mathrm{H}_1 : p \gt 0.05\) and rejects the null hypothesis if \(x \gt 1\).

(a) Find the size of the test. (2)
(b) Show that the power function of the test is \[1 - (1 - p)^4(1 + 4p)\] (3)

The manager goes on holiday and his deputy checks the production by randomly selecting a sample of 10 bags of sweets. He rejects the hypothesis that \(p = 0.05\) if more than 2 underweight bags are found in the sample.

(c) Find the probability of a Type I error using the deputy’s test. (2)

The table below gives some values, to 2 decimal places, of the power function for the deputy’s test.

\(p\)0.100.150.200.25
Power0.07\(s\)0.320.47
(d) Find the value of \(s\). (1)

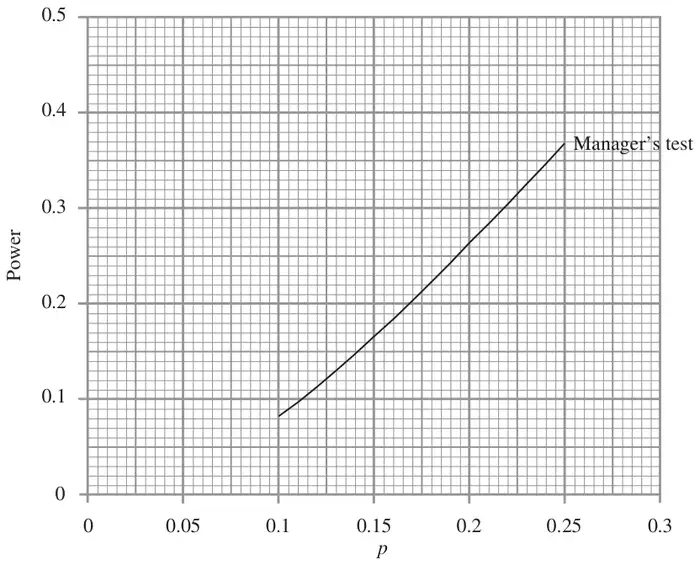
The graph of the power function for the manager’s test is shown in Figure 1.

Figure 1: graph of power against p for the manager’s test, p from 0.1 to 0.25
Figure 1
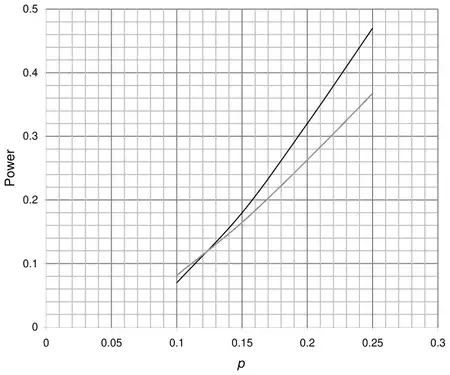
(e) On the same axes, draw the graph of the power function for the deputy’s test. (1)
(f)
(i) State the value of \(p\) where these graphs intersect.
(ii) Compare the effectiveness of the two tests if \(p\) is greater than this value. (2)

The deputy suggests that they should use his sampling method rather than the manager’s.

(g) Give a reason why the manager might not agree to this change. (1)

S4 June 2009 Q3

EdexcelOld spec12 marksIncludes hypothesis testingQuality of Tests

3. Define, in terms of \(\mathrm{H}_0\) and/or \(\mathrm{H}_1\),

(a) the size of a hypothesis test, (1)
(b) the power of a hypothesis test. (1)

The probability of getting a head when a coin is tossed is denoted by \(p\).

This coin is tossed 12 times in order to test the hypotheses \(\mathrm{H}_0 : p = 0.5\) against \(\mathrm{H}_1 : p \neq 0.5\), using a 5% level of significance.

(c) Find the largest critical region for this test, such that the probability in each tail is less than 2.5%. (4)
(d) Given that \(p = 0.4\)
(i) find the probability of a type II error when using this test,
(ii) find the power of this test. (4)
(e) Suggest two ways in which the power of the test can be increased. (2)

S4 June 2008 Q6

EdexcelOld spec12 marksIncludes hypothesis testingQuality of Tests

6. A drug is claimed to produce a cure to a certain disease in 35% of people who have the disease. To test this claim a sample of 20 people having this disease is chosen at random and given the drug. If the number of people cured is between 4 and 10 inclusive the claim will be accepted. Otherwise the claim will not be accepted.

(a) Write down suitable hypotheses to carry out this test. (2)
(b) Find the probability of making a Type I error. (3)

The table below gives the value of the probability of the Type II error, to 4 decimal places, for different values of \(p\) where \(p\) is the probability of the drug curing a person with the disease.

P(cure)0.20.30.40.5
P(Type II error)0.5880\(r\)0.8565\(s\)
(c) Calculate the value of \(r\) and the value of \(s\). (3)
(d) Calculate the power of the test for \(p = 0.2\) and \(p = 0.4\) (2)
(e) Comment, giving your reasons, on the suitability of this test procedure. (2)

S4 June 2007 Q6

EdexcelOld spec8 marksIncludes hypothesis testingQuality of Tests

6. A butter packing machine cuts butter into blocks. The weight of a block of butter is normally distributed with a mean weight of 250 g and a standard deviation of 4 g. A random sample of 15 blocks is taken to monitor any change in the mean weight of the blocks of butter.

(a) Find the critical region of a suitable test using a 2% level of significance. (3)
(b) Assuming the mean weight of a block of butter has increased to 254 g, find the probability of a Type II error. (5)

S4 June 2007 Q5

EdexcelOld spec7 marksIncludes hypothesis testingPoisson DistributionQuality of Tests

5. The number of tornadoes per year to hit a particular town follows a Poisson distribution with mean \(\lambda\). A weatherman claims that due to climate changes the mean number of tornadoes per year has decreased. He records the number of tornadoes \(x\) to hit the town last year.

To test the hypotheses \(\mathrm{H}_0 : \lambda = 7\) and \(\mathrm{H}_1 : \lambda \lt 7\), a critical region of \(x \leqslant 3\) is used.

(a) Find, in terms \(\lambda\) the power function of this test. (3)
(b) Find the size of this test. (2)
(c) Find the probability of a Type II error when \(\lambda = 4\). (2)

S4 June 2006 Q5

EdexcelOld spec17 marksIncludes hypothesis testingPoisson DistributionQuality of Tests

5. Rolls of cloth delivered to a factory contain defects at an average rate of \(\lambda\) per metre. A quality assurance manager selects a random sample of 15 metres of cloth from each delivery to test whether or not there is evidence that \(\lambda \gt 0.3\). The criterion that the manager uses for rejecting the hypothesis that \(\lambda = 0.3\) is that there are 9 or more defects in the sample.

(a) Find the size of the test. (2)

Table 1 gives some values, to 2 decimal places, of the power function of this test.

\(\lambda\)0.40.50.60.70.80.91.0
Power0.150.34\(r\)0.720.850.920.96

Table 1

(b) Find the value of \(r\). (2)

The manager would like to design a test, of whether or not \(\lambda \gt 0.3\), that uses a smaller length of cloth. He chooses a length of 10 m and requires the probability of a type I error to be less than 10%.

(c) Find the criterion to reject the hypothesis that \(\lambda = 0.3\) which makes the test as powerful as possible. (2)
(d) Hence state the size of this second test. (1)

Table 2 gives some values, to 2 decimal places, of the power function for the test in part (c).

\(\lambda\)0.40.50.60.70.80.91.0
Power0.210.380.550.70\(s\)0.880.93

Table 2

(e) Find the value of \(s\). (2)
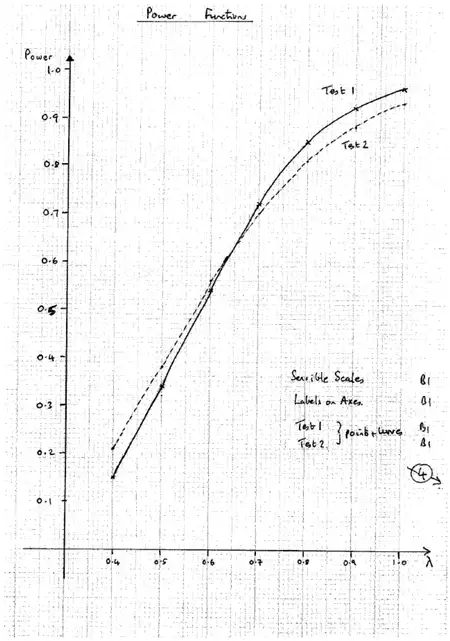
(f) Using the same axes, on graph paper draw the graphs of the power functions of these two tests. (4)
(g)
(i) State the value of \(\lambda\) where the graphs cross.
(ii) Explain the significance of \(\lambda\) being greater than this value. (2)

The cost of wrongly rejecting a delivery of cloth with \(\lambda = 0.3\) is low. Deliveries of cloth with \(\lambda \gt 0.7\) are unusual.

(h) Suggest, giving your reasons, which the test manager should adopt. (2)

S4 January 2006 Q4

EdexcelOld spec6 marksIncludes hypothesis testingPoisson DistributionQuality of Tests

4. The number of accidents that occur at a crossroads has a mean of 3 per month. In order to improve the flow of traffic the priority given to traffic is changed. Colin believes that since the change in priority the number of accidents has increased. He tests his belief by recording the number of accidents \(x\) in the month following the change. Colin sets up the hypotheses \(\mathrm{H}_0 : \lambda = 3\) and \(\mathrm{H}_1 : \lambda \gt 3\), where \(\lambda\) is the mean number of accidents per month, and rejects the null hypothesis if \(x \gt 4\).

(a) Find the size of the test. (3)

The table gives the values of the power function of the test to two decimal places.

\(\lambda\)4567
Power\(r\)0.56\(s\)0.83
(b) Calculate the value of \(r\) and the value of \(s\). (2)
(c) Comment on the suitability of the test when \(\lambda = 4\). (1)

S4 January 2006 Q2

EdexcelOld spec13 marksIncludes hypothesis testingQuality of Tests

2.

(a) Define
(i) a Type I error, (1)
(ii) a Type II error. (1)

A manufacturer sells socks in boxes of 50.

The mean number of faulty socks per box is 7.5. In order to reduce the number of faulty socks a new machine is tried. A box of socks made on the new machine was tested and the number of faulty socks was 2.

(b)
(i) Assuming that the number of faulty socks per box follows a binomial distribution derive a critical region needed to test whether or not there is evidence that the new machine has reduced the mean number of faulty socks per box. Use a 5% significance level. (2)
(ii) Stating your hypotheses clearly, carry out the test in part (i). (3)
(c) Find the probability of the Type I error for this test. (2)
(d) Given that the true mean number of faulty socks per box on the new machine is 5, calculate the probability of a Type II error for this test. (3)
(e) Explain what would have been the effect of changing the significance level for the test in part (b) to 2½%. (1)

S4 June 2005 Q5

EdexcelOld spec13 marksIncludes hypothesis testingQuality of Tests

5. Define

(a) a Type I error, (1)
(b) the size of a test. (1)

Jane claims that she can read Alan’s mind. To test this claim Alan randomly chooses a card with one of 4 symbols on it. He then concentrates on the symbol. Jane then attempts to read Alan’s mind by stating what symbol she thinks is on the card. The experiment is carried out 8 times and the number of times \(X\) that Jane is correct is recorded.

The probability of Jane stating the correct symbol is denoted by \(p\).

To test the hypothesis \(\mathrm{H}_0 : p = 0.25\) against \(\mathrm{H}_1 : p \gt 0.25\), a critical region of \(X \gt 6\) is used.

(c) Find the size of this test. (3)
(d) Show that the power function of this test is \(8p^7 - 7p^8\). (3)

Given that \(p = 0.3\), calculate

(e) the power of this test, (1)
(f) the probability of a Type II error. (2)
(g) Suggest two ways in which you might reduce the probability of a Type II error. (2)