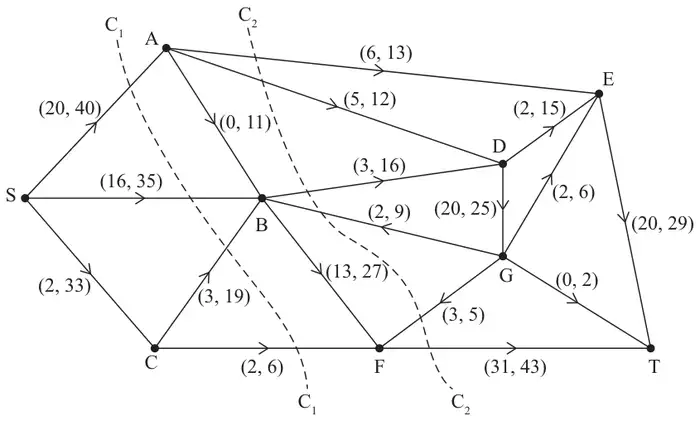
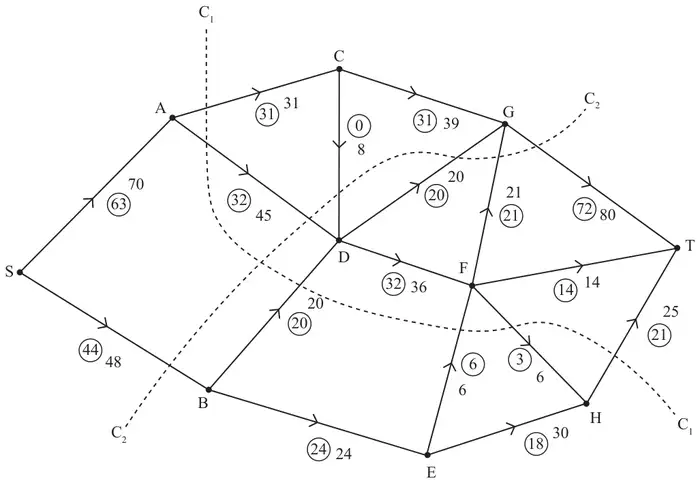
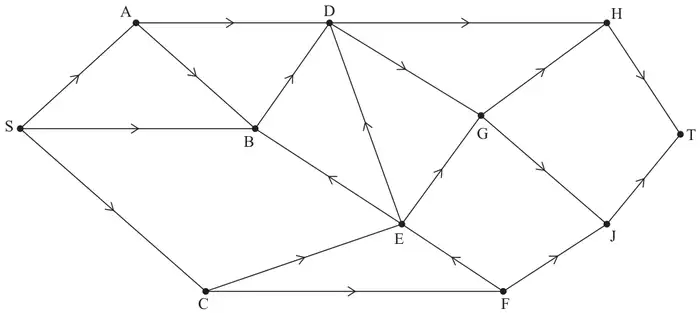
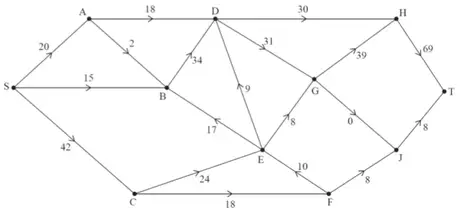
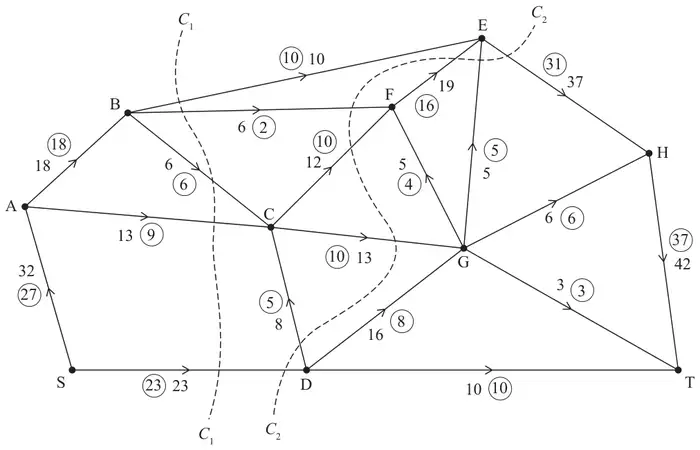
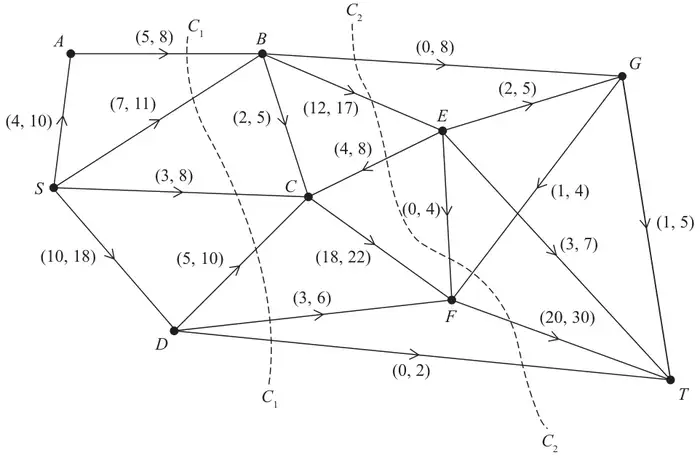
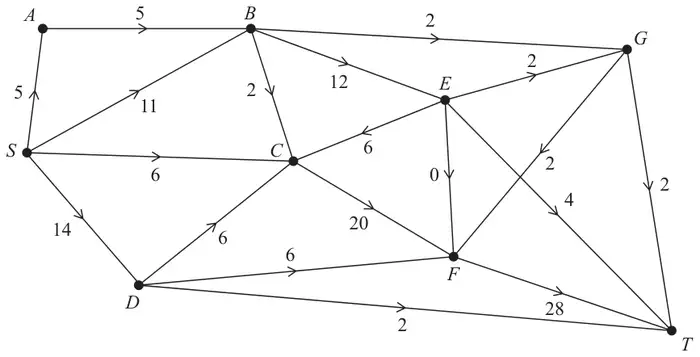
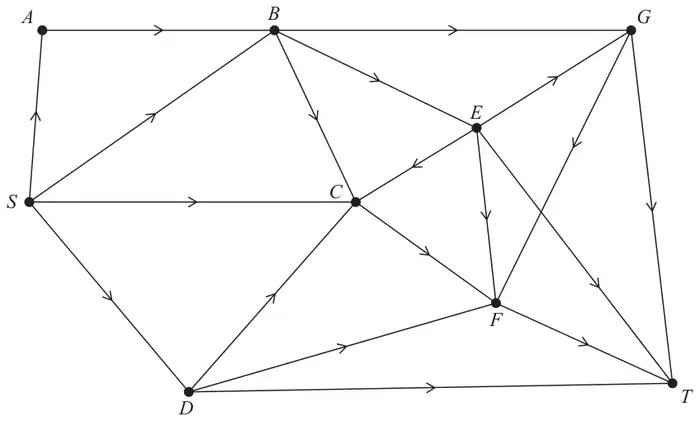
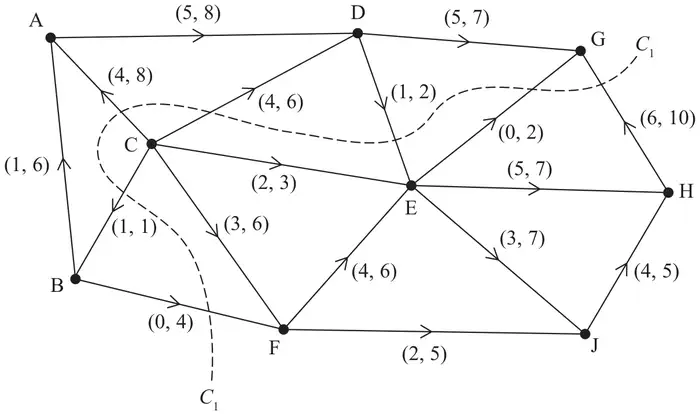
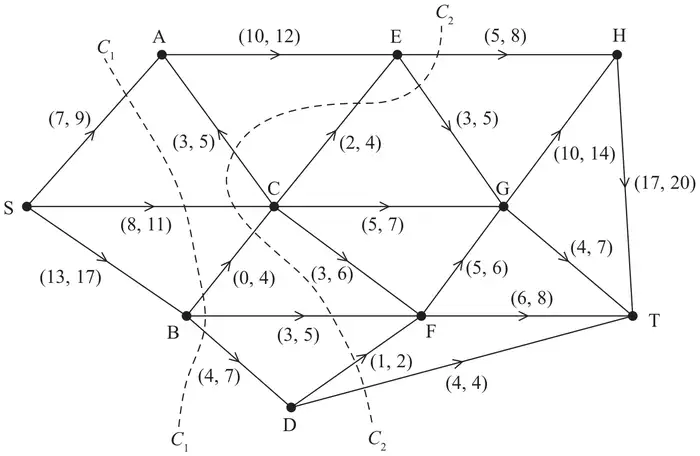
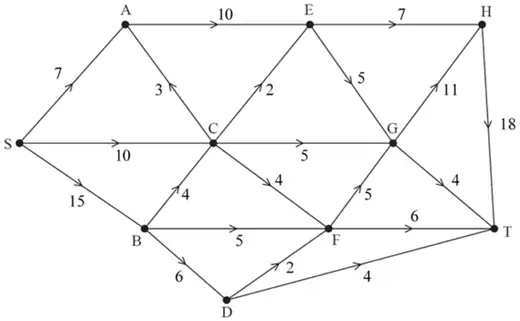
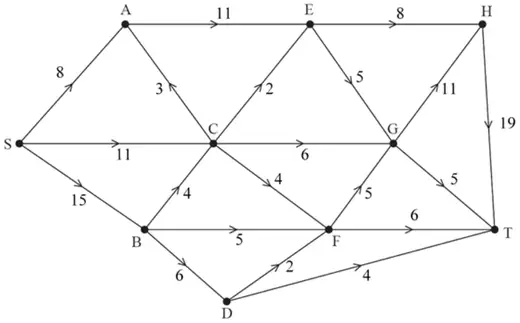
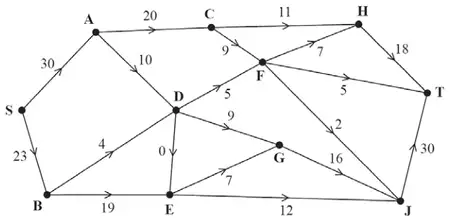
Figure 2 shows a capacitated, directed network. The network represents a system of pipes through which fluid can flow.
The weights on the arcs show the lower and upper capacities for the corresponding pipes, in litres per second.
(a) Calculate the capacity of
(i) cut \(C_1\)
(ii) cut \(C_2\) (2)
(b) Using only the capacities of cuts \(C_1\) and \(C_2\), state what can be deduced about the maximum flow through the system. (1)
Figure 3
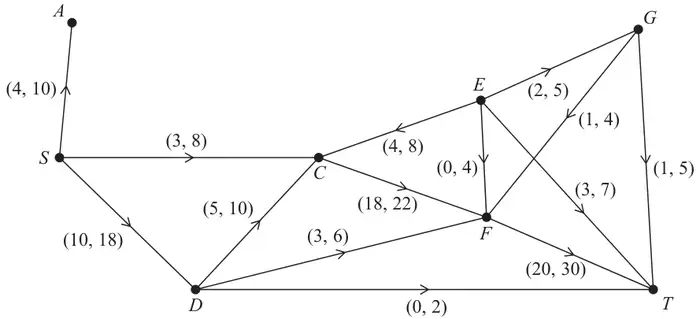
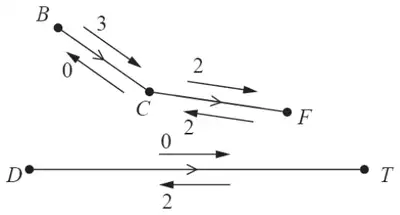
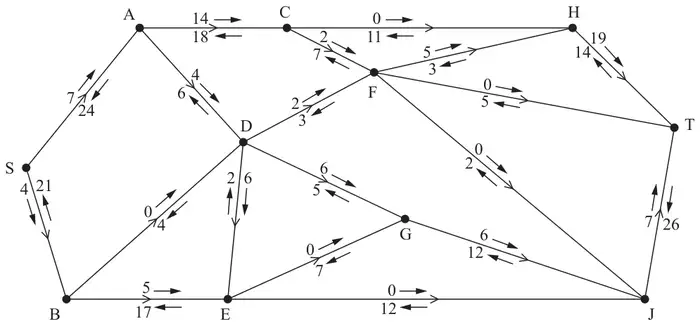
A scientist monitors the system of pipes in which a fluid now flows from the source, S, to the sink, T.
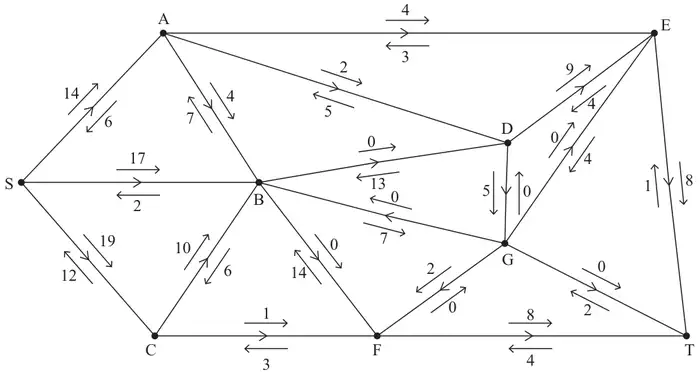
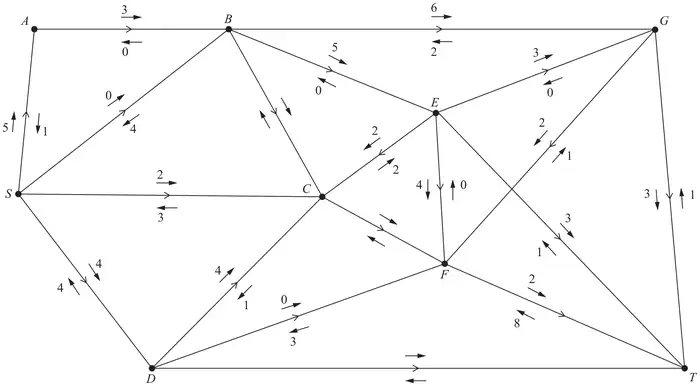
The scientist initialises the labelling procedure for this system. The excess and potential backflows for this are shown on the arrows either side of each arc in Figure 3.
(c) State the value of the initial flow. (1)
(d) Use the labelling procedure to find a maximum flow through the network. You must list each flow-augmenting route you use, together with its flow. (3)
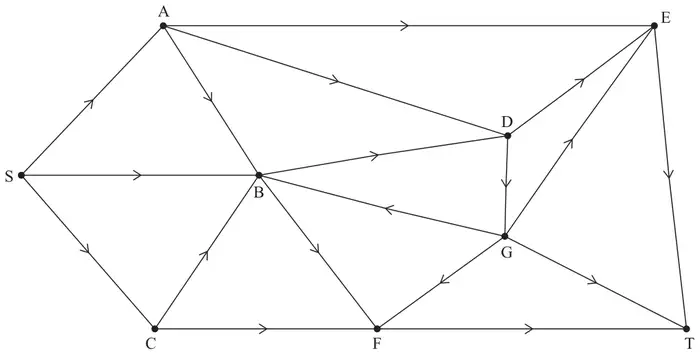
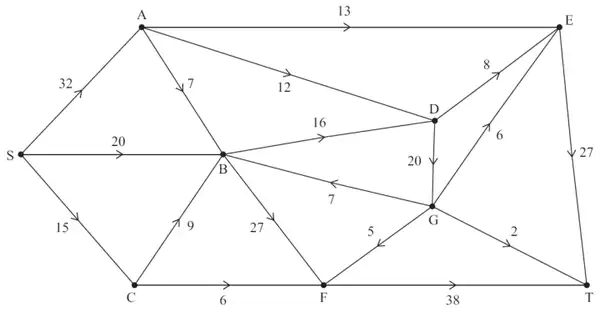
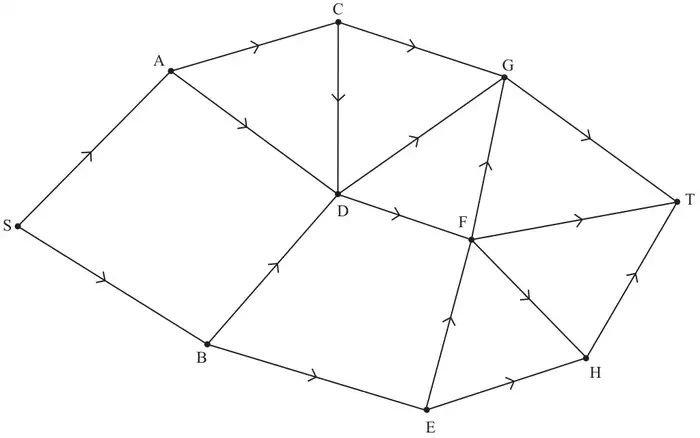
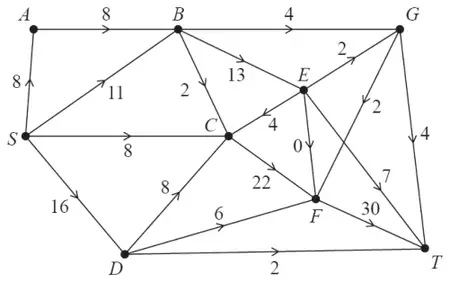
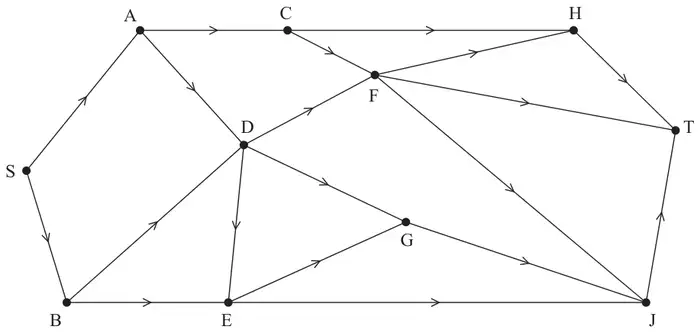
(e) Use your answer to part (d) to find a maximum flow pattern for this system of pipes and draw it on Diagram 1 in the answer book. (1)
Diagram 1
(f) Prove that the answer to part (e) is optimal. (3)
Mark scheme (a)
Scheme
Marks
AO
\(C_1\,(= 40 + 35 + 19 + 6) = 100\)
B1
1.1b
\(C_2\,(= 13 + 12 + 16 - 2 - 3 + 43) = 79\)
B1
1.1b
(2)
Notes
B1: CAO
B1: CAO
Mark scheme (b)
Scheme
Marks
AO
Deduces the maximum possible flow is \(\leqslant 79\) litres per second
B1ft
2.2a
(1)
Notes
B1ft: deduced from their least value given in (a) - must include ‘less than or equal to’ (oe)
Mark scheme (c)
Scheme
Marks
AO
Initial flow = 58
B1
1.1b
(1)
Notes
B1: CAO
Mark scheme (d)
Scheme
Marks
AO
e.g. SAET – 4, SADET – 2, SBGFT – 2, SCFT – 1
M1 A1 A1
1.1b 1.1b 1.1b
(3)
Notes
M1: One flow augmenting route found from S to T
A1: Two correct routes + flow values
A1: CSO – increasing the flow by 9
Note possible flow augmenting routes are only _ADET + 2 _AET + 4 _BGFT + 2 _CFT + 1 where _ represents either S, SB, SC or SCB
(SADGFT + 2 is also valid but this prevents DET being increased)
Mark scheme (e)
Scheme
Marks
AO
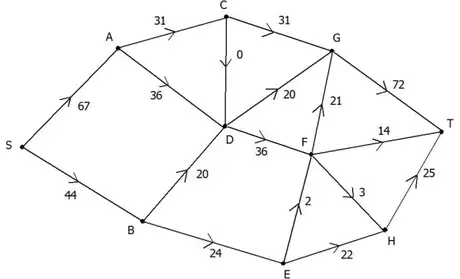
e.g.
B1
2.2a
(1)
Notes
B1: CAO – one number only per arc (only SA, SB, SC, AB and CB can vary depending on their flow augmenting routes)
Mark scheme (f)
Scheme
Marks
AO
Use of max-flow min-cut theorem Identification of cut through AE, AD, BD, DG, GE, GT, GF, BF and CF Value of flow = 67 Therefore it follows that flow is maximal
M1
A1 A1
2.1
3.1a 2.2a
(3)
(11 marks)
Notes
M1: Construct argument based on max-flow min-cut theorem (e.g. attempt to find a cut through saturated arcs) (A valid cut through saturated arcs must either be listed or drawn)
May be drawn on either diagram or listed as arcs or set notation {S, A, B, C, G}{D, E, F, T}
A1: Use appropriate process of finding a minimum cut: cut + value correct and value of flow stated
A1: Correct deduction that the flow is maximal – must see all 4 words max flow min cut and conclusion - dependent on previous A mark
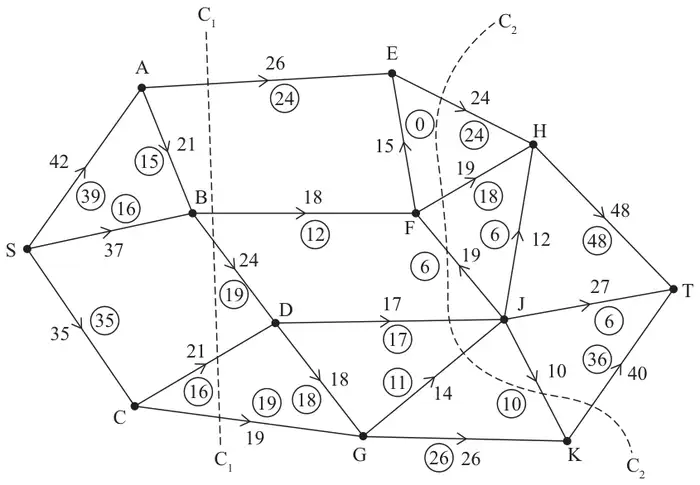
Figure 1 shows a capacitated, directed network of pipes. The number on each arc represents the capacity of the corresponding pipe. The numbers in circles represent a feasible flow from S to T.
(a) State the two conditions satisfied by a feasible flow. (2)
(b) List the seven saturated arcs in Figure 1. (1)
(c) Find the capacity of
(i) cut \(C_1\)
(ii) cut \(C_2\) (2)
(d) Write down a flow-augmenting route that increases the flow by four units. (1)
(e) Use the answer to part (d) to draw the resulting flow pattern on Diagram 1 in the answer book. (2)
Diagram 1
(f) Prove that the answer to part (e) is a maximum flow. (3)
Mark scheme (a)
Scheme
Marks
AO
On every arc actual flow cannot exceed capacity. Total flow into a vertex equals total flow out of the vertex for all vertices apart from the source and the sink.
B1 B1
1.2 1.2
(2)
Notes
a1B1: Either condition.
a2B1: Both conditions (condone no mention of source and sink).
Mark scheme (b)
Scheme
Marks
AO
AC, BD, BE, DG, EF, FG, FT
B1
1.1b
(1)
Notes
b1B1: CAO
Mark scheme (c)
Scheme
Marks
AO
(i) \(C_1 = (31 + 45 + 20 + 6 + 25 =)\ 127\)
B1
1.1b
(ii) \(C_2 = (80 + 8 + 45 + 48 =)\ 181\)
B1
1.1b
(2)
Notes
ci1B1: CAO
cii1B1: CAO
Mark scheme (d)
Scheme
Marks
AO
SADFEHT
B1
1.1b
(1)
Notes
d1B1: A correct flow-augmenting route.
Mark scheme (e)
Scheme
Marks
AO
M1 A1
1.1b 1.1b
(2)
Notes
e1M1: All arcs labelled with flows, condone two errors. Condone capacity as well (if clearly distinguished) for this mark
e1A1: Correct numbers labelled on all arcs (one number per arc)
Mark scheme (f)
Scheme
Marks
AO
Use of max-flow min-cut theorem Identifies cut through, AC, DC, DG, DF, BE or AC, CD, DG, FG, FT, HT capacity = 111 Value of flow =111 Therefore flow is maximal.
M1 A1 A1
2.1 3.1a 2.2a
(3)
(11 marks)
Notes
f1M1: Construct argument based on max-flow min-cut theorem so attempt to find a cut through saturated arcs (either stated or drawn).
f1A1: Use appropriate process for finding minimum cut, with cut and value correct.
f2A1: Correct deduction that flow is maximal. Must state value of the flow and see all 4 words max flow min cut and conclusion
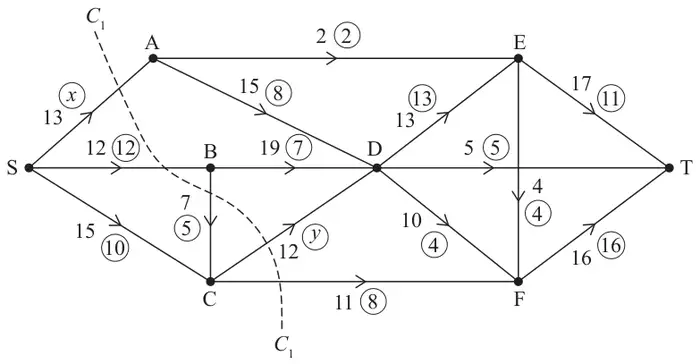
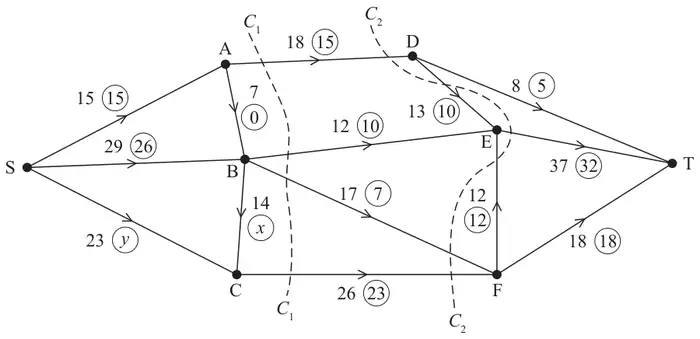
Figure 1 shows a capacitated, directed network of pipes. The numbers in circles represent an initial flow from S to T. The other number on each arc represents the capacity, in litres per second, of the corresponding pipe.
(a)
(i) State the value of \(x\)
(ii) State the value of \(y\) (2)
(b) State the value of the initial flow. (1)
(c) State the capacity of cut \(C_1\) (1)
(d) Find, by inspection, a flow-augmenting route to increase the flow by four units. You must state your route. (1)
The flow-augmenting route from (d) is used to increase the flow from S to T.
(e) Prove that the flow is now maximal. (3)
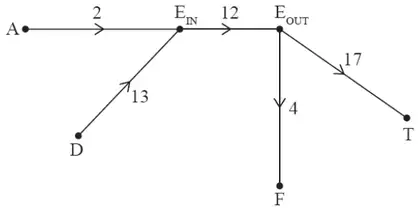
A vertex restriction is now applied so that no more than 12 litres per second can flow through E.
(f)
(i) Complete Diagram 1 in the answer book to show this restriction.
(ii) State the value of the maximum flow through the network with this restriction. (2)
Diagram 1
Mark scheme (a)
Scheme
Marks
AO
(i) \(x = 10\)
B1
1.1b
(ii) \(y = 7\)
B1
1.1b
(2)
Notes
B1: CAO for \(x\)
B1: CAO for \(y\)
Mark scheme (b)
Scheme
Marks
AO
32
B1
1.1b
(1)
Notes
B1: CAO
Mark scheme (c)
Scheme
Marks
AO
Cut \(C_1\,(= 13 + 12 + 12 + 11) = 48\)
B1
1.1b
(1)
Notes
B1: CAO
Mark scheme (d)
Scheme
Marks
AO
SCDFET
B1
1.1b
(1)
Notes
B1: CAO
Mark scheme (e)
Scheme
Marks
AO
Use of max-flow min-cut theorem Identification of cut through AE, DE, DT, EF and FT Value of flow = 36 It follows that flow is maximal
M1 A1 A1
2.1 3.1a 2.2a
(3)
Notes
M1: Construct argument based on max-flow min-cut theorem (e.g. attempt to find a cut through saturated arcs). The cut may be drawn or stated in terms of arcs but not as nodes. (Note the only saturated arc not in the cut is SB)
A1: Use appropriate process of finding a minimum cut: cut + value correct
dA1: Must have stated the value of the flow and correct deduction that the flow is maximal. Must use max flow = min cut all 4 words dependent on previous A mark so M1 A0 A1 is not possible
Mark scheme (f)
Scheme
Marks
AO
(i)
B1
3.3
(ii) maximum flow = 33
B1ft
2.2a
(2)
(10 marks)
Notes
B1: Flows into E go to EIN and flows out of E go from EOUT and arc of capacity 12 from EIN to EOUT All arcs must have the correct arrow and capacity shown. Split node must be labelled as EIN and EOUT or E1 and E2
Figure 1 shows a capacitated, directed network of pipes. The number on each arc represents the capacity of the corresponding pipe. The numbers in circles represent a feasible flow from S to T.
(a) State the value of this flow. (1)
(b) Explain why arcs CD and CG cannot both be saturated. (1)
(c) Find the capacity of
(i) cut \(C_1\)
(ii) cut \(C_2\) (2)
(d) Write down a flow augmenting route of weight 6 which saturates BF. (1)
The flow augmenting route in part (d) is applied to give an increased flow.
(e) Prove that this increased flow is maximal. (3)
Mark scheme (a)
Scheme
Marks
AO
Initial Flow = 90
B1
1.1b
(1)
Notes
B1: CAO
Mark scheme (b)
Scheme
Marks
AO
The maximum flow into C is 35. Maximum flow in CD is 21 and maximum flow in CG is 19. 35 < 21 + 19 and therefore CD and CG cannot both be saturated
B1
2.4
(1)
Notes
B1: CAO (as a minimum accept: max inflow to C = 35 and max outflow = 40 and 35 <40)
Mark scheme (c)
Scheme
Marks
AO
(i) 26+18+24+21+19 = 108 (ii) 24+19+17+14+40 = 114
B1 B1
1.1b 1.1b
(2)
Notes
(i) B1: CAO
(ii) B1: CAO
Mark scheme (d)
Scheme
Marks
AO
SBFJT (+6)
B1
1.1b
(1)
Notes
B1: Correct flow augmenting route found from S to T
Mark scheme (e)
Scheme
Marks
AO
Use of max-flow min-cut theorem Identification of cut through EH EF BF DJ DG and CG Capacity of cut = 96 Therefore it follows that flow is maximal
M1 A1 A1
2.1 3.1a 2.2a
(3)
(8 marks)
Notes
M1: Construct argument based on max-flow min-cut theorem (e.g. attempt to find a cut through saturated arcs) Cut must be drawn or listed as arcs not values (condone omission of EF for M1 only)
A1: Use appropriate process of finding a minimum cut (both cut and value correct)
A1: Correct deduction that the flow is maximal (dependent on previous A mark) (must use all four words Max Flow = Min Cut)
An engineer monitors a system of pipes through which a fluid flows from the source, S, to the sink, T.
The engineer initialises the labelling procedure for this system, and the excess capacities and potential backflows are shown on the arrows either side of each arc, as shown in Figure 1.
(a) State the value of the initial flow. (1)
(b) Obtain the capacity of the cut that passes through the arcs SA, SB, CE, FE and FJ. (1)
(c) Use the labelling procedure to find a maximum flow through the network. You must list each flow-augmenting route you use, together with its flow. (3)
(d) Use your answer to (c) to draw a maximum flow pattern on Diagram 1 in the answer book. (1)
M1: One correct flow augmenting route found from S to T (so any routes that contain SB, BA, AD, CF, ED, EG, DG or JT are incorrect routes) - a ‘correct’ route is one in which the flow through the system can be increased
A1: Two correct routes (ignoring numerical value of the flow for this mark)
A1: cso – increasing the flow by 5 (and no more) – so at least two routes with corresponding correct values stated
Mark scheme (d)
Scheme
Marks
AO
e.g. (based on the first example in (c))
B1
1.1b
(1)
Notes
B1: cao – if there are two numbers on each arc neither of which is circled then B0, if there are two numbers on each arc, one circled and one not, then consider the circled numbers only as the maximum flow pattern. Do not accept a blank arc as a zero
Mark scheme (e)
Scheme
Marks
AO
Use of max-flow min-cut theorem Identification of cut through AD, BD, ED, EG, GJ and JT Value of flow = 77 Therefore it follows that flow is optimal
M1
A1 A1
2.1
3.1a 2.2a
(3)
(9 marks)
Notes
M1: Construct an argument based on max-flow min-cut theorem (e.g. attempt to find a cut (but not the one through SA, SB, CE, FE, FJ) through saturated arcs – must contain source on one side and sink on the other) – allow cut shown on the Diagram 1 in the answer book – this mark is dependent on an attempt at part (d) (so values on all but two arcs)
A1: Use appropriate process of finding a minimum cut – cut (AD, BD, ED, EG, GJ, JT) and the value of the flow through the network stated correctly (77)
A1: Correct deduction that the flow is maximal – must use all four words ‘maximum’, ‘flow’, ‘minimum’ and ‘cut’ (allow abbreviations for maximum and minimum) – dep on first A mark and the B mark in (d)
Figure 1 shows a capacitated, directed network of pipes. The number on each arc represents the capacity of that pipe. The numbers in circles represent a feasible flow from S to T.
(a) State the value of the feasible flow. (1)
(b) Find the capacity of cut \(C_1\) and the capacity of cut \(C_2\) (2)
(c) By inspection, find a flow-augmenting route to increase the flow by two units. You must state your route. (1)
(d) Prove that, once the flow-augmenting route found in (c) has been applied, the flow is now maximal. (3)
Use of max-flow min-cut theorem Identification of cut through FT, FE, DF, AD, BD, CD and CE Value of flow = 56 Therefore it follows that flow is maximal
M1 A1 A1
2.1 3.1a 2.2a
(3)
(7 marks)
Notes
M1: Construct argument based on max-flow min-cut theorem (e.g. attempt to find a cut through arcs – must contain source on one side and sink on the other). Allow a cut drawn on the diagram (need not be the correct one). If cut not drawn, must list arcs not values.
A1: Use appropriate process of finding a minimum cut – FT, FE, DF, AD, BD, CD and CE plus value correct and value of flow through the network stated correctly (56)
A1: Correct deduction that the flow is maximal – must use all four words ‘maximum’, ‘flow’, ‘minimum’ and ‘cut’ (allow use of max and min) dependent on previous A1.
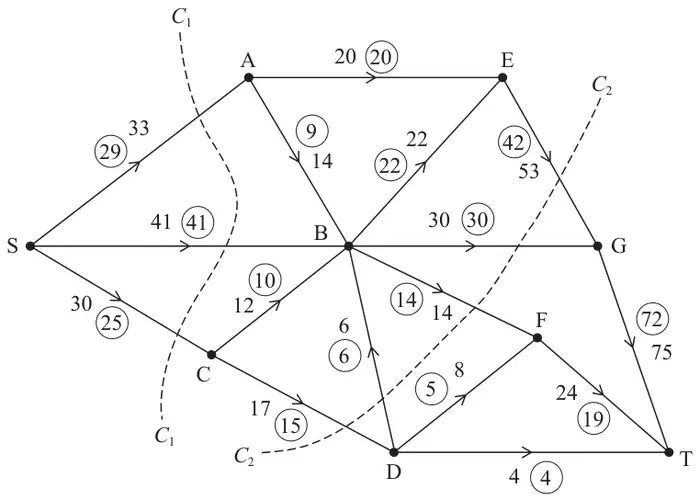
Figure 1 shows a capacitated, directed network of pipes. The uncircled number on each arc represents the capacity of the corresponding pipe. The numbers in circles represent an initial flow.
(a) List the saturated arcs. (1)
(b) State the value of the initial flow. (1)
(c) Explain why arc FT cannot be full to capacity. (1)
(d) State the capacity of cut \(C_1\) and the capacity of cut \(C_2\) (2)
(e) By inspection find one flow-augmenting route to increase the flow by three units. You must state your route. (1)
(f) Prove that, once the flow-augmenting route found in part (e) has been applied, the flow is maximal. (3)
Mark scheme (a)
Scheme
Marks
AO
AE, BE, BF, BG, DB, DT, SB
B1
1.1b
(1)
Notes
B1: CAO
Mark scheme (b)
Scheme
Marks
AO
95
B1
1.1b
(1)
Notes
B1: CAO
Mark scheme (c)
Scheme
Marks
AO
The maximum feasible flow into F is 22 (from BF and DF) but the maximum feasible flow out of F is 24 so therefore FT cannot be full to capacity
B1
2.4
(1)
Notes
B1: Correct reasoning – argument must be numerical in nature (e.g. as a minimum comparison of 22 with 24)
Use of max-flow min-cut theorem Identification of cut through AE, BE, BG, BF, DF and DT, Value of cut = 98, Value of flow = 98 Therefore it follows that flow is maximal
M1 A1 A1
2.1 3.1a 2.2a
(3)
(9 marks)
Notes
M1: Construct argument based on max-flow min-cut theorem (e.g. attempt to find a cut through saturated arcs – must contain source on one side and sink on the other). Allow a cut drawn on the diagram (need not be the correct one)
A1: Use appropriate process of finding a minimum cut – AE, BE, BG, BF, DF and DT plus value correct and value of flow through the network stated correctly (98)
A1: Correct deduction that the flow is maximal – must use all four words ‘maximum’, ‘flow’, ‘minimum’ and ‘cut’ (allow abbreviations for maximum and minimum) dependent on previous A1.
Figure 1 shows a capacitated, directed network of pipes. The number on each arc represents the capacity of the corresponding pipe. The numbers in circles represent a feasible flow from S to T.
(a) State the value of this flow. (1)
(b) List the eight saturated arcs. (1)
(c) Explain why arc EH can never be full to capacity. (1)
(d) Find the capacity of
(i) cut \(C_1\)
(ii) cut \(C_2\) (2)
(e) Write down a flow-augmenting route that increases the flow by three units. (1)
Given that the flow through the network is increased by three units,
(f) prove that this new flow is maximal. (3)
Mark scheme (a)
Scheme
Marks
AO
50
B1
1.1b
(1)
Notes
B1: cao (50)
Mark scheme (b)
Scheme
Marks
AO
Saturated arcs: AB, BC, SD, BE, DT, GE, GH and GT
B1
1.1b
(1)
Notes
B1: cao (AB, BC, SD, BE, DT, GE, GH, GT)
Mark scheme (c)
Scheme
Marks
AO
e.g., the capacity of arc EH is 37. The three arcs that flow into E are BE, FE and GE. The total capacity of these three arcs is 10 + 19 + 5 = 34 and as 37 > 34, EH cannot be full to capacity.
B1
2.4
(1)
Notes
B1: Correct reasoning for why EH cannot be full to capacity (e.g., EH has capacity 37 but the total capacity of the arcs that flow into E is only 34 so EH cannot be full to capacity). Must be numerical.
Mark scheme (d)
Scheme
Marks
AO
(i) Value of cut \(C_1\) = 10 + 6 + 6 + 13 + 23 = 58
B1
1.1b
(ii) Value of cut \(C_2\) = 37 + 6 + 12 + 13 + 23 = 91
B1
1.1b
(2)
Notes
(d)(i) B1: cao (58) (ii) B1: cao (91)
Mark scheme (e)
Scheme
Marks
AO
e.g. SACBFEHT
B1
1.1b
(1)
Notes
B1: One correct flow-augmenting route only (SACBFEHT)
Mark scheme (f)
Scheme
Marks
AO
Use of max-flow min-cut theorem Identification of cut through BE, FE, GE, GH, GT, DT Value of flow = 53 Therefore it follows that flow is maximal
M1
A1 A1
2.1
3.1a 2.2a
(3)
(9 marks)
Notes
M1: Construct argument based on max-flow min-cut theorem (e.g. attempt to find a cut through saturated arcs – must contain source on one side and sink on the other) – allow cut shown on the diagram
A1: Use appropriate process of finding a minimum cut – cut (BE, FE, GE, GH, GT, DT) and value of flow through the network stated correctly (53)
A1: Correct deduction that the flow is maximal – must use all four words ‘maximum’, ‘flow’, ‘minimum’ and ‘cut’ (allow abbreviations for maximum and minimum) – dep on first A mark
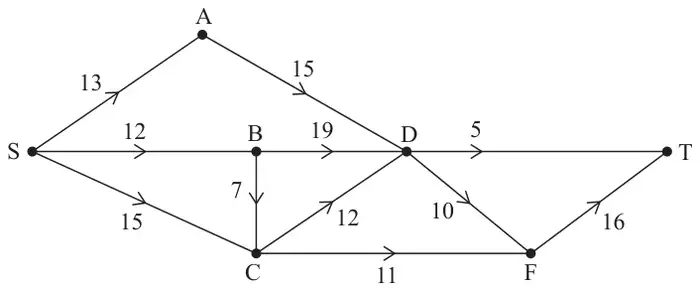
Figure 1 shows a capacitated, directed network. The network represents a system of pipes through which fluid can flow.
The weights on the arcs show the lower and upper capacities for the corresponding pipes, in litres per second.
(a) Calculate the capacity of
(i) cut \(C_1\)
(ii) cut \(C_2\) (2)
(b) Using only the capacities of cuts \(C_1\) and \(C_2\), state what can be deduced about the maximum flow through the system. (1)
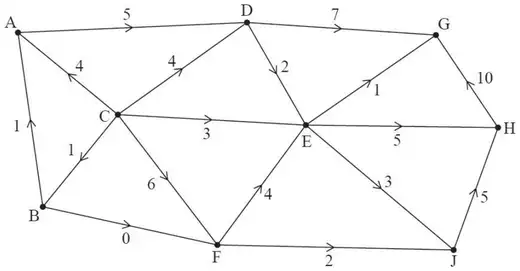
Figure 2
Figure 2 shows an initial flow through the same network.
(c) State the value of the initial flow. (1)
(d) By entering values along \(BC\), \(CF\) and \(DT\), complete the labelling procedure on Diagram 1 below. (2)
Diagram 1
(e) Use the labelling procedure to find a maximum flow through the network. You must list each flow-augmenting route you use, together with its flow. (3)
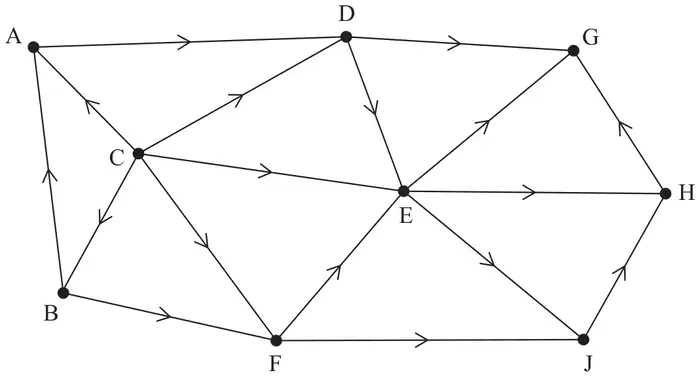
(f) Use your answer to (e) to find a maximum flow pattern for this system of pipes and draw it on Diagram 2 below. (1)
Diagram 2
(g) Prove that the answer to (f) is optimal. (3)
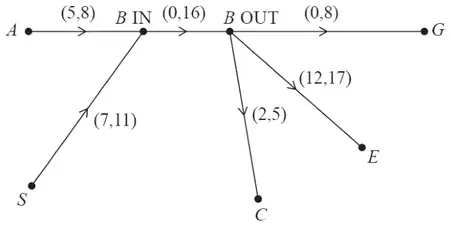
A vertex restriction is now applied to \(B\) so that no more than 16 litres per second can flow through it.
(h)
(i) Complete Diagram 3 below to show this restriction.
(ii) State the value of the maximum flow with this restriction. (3)
Use of max-flow min-cut theorem Identification of cut through AB, SB, BC, EC, CF, DF and DT Value of flow = 43 Therefore it follows that flow is maximal
M1 A1 A1
2.1 3.1a 2.2a
(3)
Notes
M1: Construct argument based on max-flow min-cut theorem (e.g., attempt to find a cut through saturated arcs)
A1: Use appropriate process of finding a minimum cut: cut + value correct
A1: Correct deduction that the flow is maximal
Mark scheme (h)
Scheme
Marks
AO
(i)
B1
B1
3.3
3.3
(ii) maximum flow = 40
B1ft
2.2a
(3)
(16 marks)
Notes
B1: Flows into B go to BIN and flows out of B go from BOUT
(i) Arc JH must be at its upper capacity of 5 as the two arcs that flow into J (EJ and FJ) have a lower capacity of \(2 + 3 = 5\)
B1
2.4
(ii) Arcs AD and CD must be at the lower capacities (which in total is 9) as the only two arcs (DG and DE) that flow out of D have a total upper capacity of \(7 + 2 = 9\)
B1
2.4
(2)
Notes
(d)(i) B1: correct explanation that JH must be at its upper capacity (must refer to arcs EJ and FJ)
(d)(ii) B1: correct explanation that AD and CD must be at their lower capacities (must refer to arcs DG and DE)
Mark scheme (e)
Scheme
Marks
AO
M1 A1
2.2a 1.1b
(2)
Notes
M1: ‘flow in = flow out’ at all but one vertex – one number only required on each arc (condone blank for arc BF)
A1: a correct valid flow through the network (check that flow in must equal flow out at each vertex)
Mark scheme (f)
Scheme
Marks
AO
Use of max-flow min-cut theorem
M1
2.1
Identification of cut through DG, DE, CE, CF, CB, BA with a capacity of 18 and value of flow = 18
A1
3.1a
Therefore it follows that flow is maximal
A1
2.2a
(3)
(10 marks)
Notes
M1: Construct argument based on max-flow min-cut theorem (e.g. attempt to find a cut through saturated arcs)
A1: Use appropriate process of finding a minimum cut (cut + value correct)
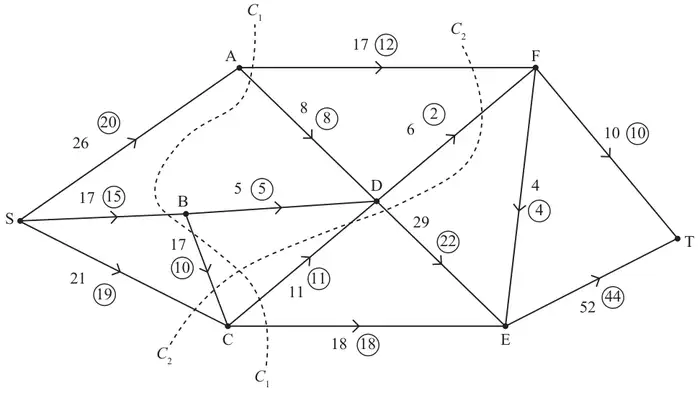
Figure 1 shows a capacitated, directed network of pipes. The number on each arc represents the capacity of the corresponding pipe. The numbers in circles represent a feasible flow from S to T.
(a)
(i) Find the value of \(x\).
(ii) Find the value of \(y\). (2)
(b) List the saturated arcs. (1)
Two cuts, \(C_1\) and \(C_2\), are shown in Figure 1.
(c) Find the capacity of
(i) \(C_1\)
(ii) \(C_2\) (2)
(d) Write down a flow-augmenting route, using the arc CF, that increases the flow by two units. (1)
Given that the flow through the network is increased by two units using the route found in (d),
(e) prove that this new flow is maximal. (3)
Mark scheme (a)
Scheme
Marks
AO
(i) \((x =)\ 9\)
B1
1.1b
(ii) \((y =)\ 14\)
B1
1.1b
(2)
Notes
(i) B1: Cao
(ii) B1: Cao
Mark scheme (b)
Scheme
Marks
AO
SA, FE, FT
B1
1.1b
(1)
Notes
B1: Cao
Mark scheme (c)
Scheme
Marks
AO
(i) Value of cut \(C_1 = 18 + 12 + 17 + 26 = 73\)
B1
1.1b
(ii) Value of cut \(C_2 = 18 + 37 + 17 + 26 = 98\)
B1
1.1b
(2)
Notes
(i) B1: Cao
(ii) B1: Cao
Mark scheme (d)
Scheme
Marks
AO
e.g. SCFBET, SBCFBET
B1
1.1b
(1)
Notes
B1: A correct flow-augmenting route
Mark scheme (e)
Scheme
Marks
AO
Use of max-flow min-cut theorem Identification of cut through SA, AB, BE, FE and FT Value of flow = 57 Therefore it follows that flow is maximal
M1
A1 A1
2.1
3.1a 2.2a
(3)
(9 marks)
Notes
M1: Construct argument based on max-flow min-cut theorem (e.g. attempt to find a cut through saturated arcs) – if the cut is only given in terms of the capacity of the arcs (rather than in terms of the nodes at each end) then M1 only in this part
A1: Use appropriate process of finding a minimum cut – cut and value correct
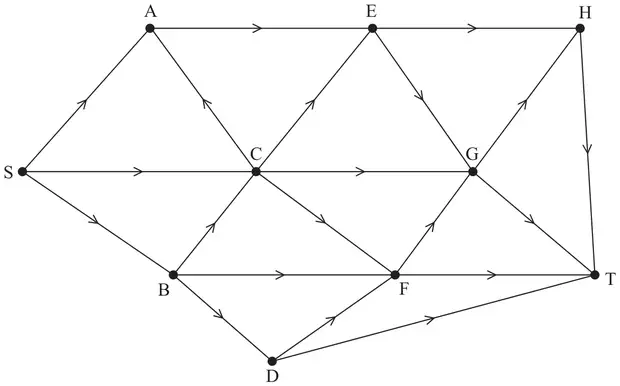
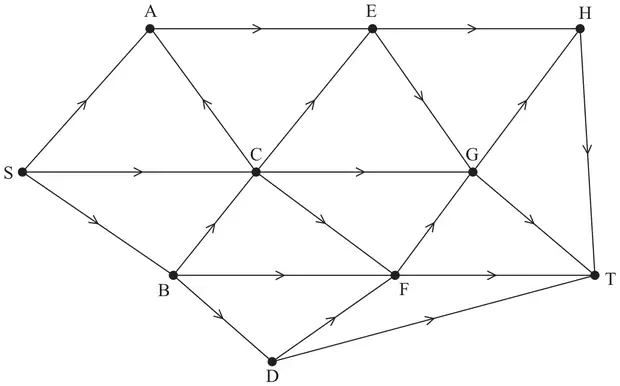
Figure 2 shows a capacitated, directed network. The network represents a system of pipes through which fluid flows from a source, S, to a sink, T.
The numbers \((l, u)\) on each arc represent, in litres per second, the lower capacity, \(l\), and the upper capacity, \(u\), of the corresponding pipe.
Two cuts \(C_1\) and \(C_2\) are shown.
(a) Find the capacity of
(i) cut \(C_1\)
(ii) cut \(C_2\) (2)
(b) Explain why the arcs AE and CE cannot be at their upper capacities simultaneously. (1)
(c) Explain why a flow of 31 litres per second through the system is not possible. (1)
(d) Hence determine a minimum feasible flow and a maximum feasible flow through the system. You must draw these feasible flows on the diagrams below and give reasons to justify your answer. You should not apply the labelling procedure to find these flows.(4)
If AE and CE were both full to capacity then \(12 + 4 = 16\) litres per second would flow though E but the maximum capacity of the two arcs out of E (EH and EG) is only \(8 + 5 = 13\) so AE and CE cannot both be full to capacity
1B1
2.4
(1)
Notes
1B1: Calculates maximum capacity entering E and compares with maximum capacity leaving E. Concludes that maximum capacity into E exceeds maximum capacity out of E. Condone statements such as ‘flow into E \(= 12 + 4 < 13\) which is the flow out of E’.
Mark scheme (c)
Scheme
Marks
AO
The minimum flow through the arcs AE, CE, CG, FG, FT and DT (which provides a cut for the network) is \(10 + 2 + 5 + 5 + 6 + 4 = 32\) so a minimum of 32 must be flowing through the system so 31 is not possible.
1B1
2.4
(1)
Notes
1B1: valid reason why the flow in the network cannot be 31 litres per second.
Note: If smallest of \(C_1\) and \(C_2\) in a) is less than 31 then DO NOT allow this mark for deducing that ‘31 > {smallest of answers from a} hence, flow of 31 is not possible’.
Mark scheme (d)
Scheme
Marks
AO
Attempt to find a flow of 32 using the answer to (c)
1M1
3.4
E.g. Minimum flow of 32
1A1
1.1b
Attempt to augment minimum flow and recognise that from (a) the maximum flow is less than or equal to 34
1B1
2.1
E.g. Maximum flow of 34
2B1
1.1b
(4)
(8 marks)
Notes
1M1: Award this mark for either:
Indicates ‘minimum flow > 31 so minimum flow could be 32’, OR
Attempts to find flow of 32 in which: the sum of flows along arcs from S is 32 and \(7 \leqslant\) flow along SA \(\leqslant 9\), \(8 \leqslant\) flow along SC \(\leqslant 11\) and \(13 \leqslant\) flow along SB \(\leqslant 17\), OR
Attempts to find flow of 32 in which: the sum of flows along arcs into T is 32 and flow along DT = 4, \(6 \leqslant\) flow along FT \(\leqslant 8\), \(4 \leqslant\) flow along GT \(\leqslant 7\) and \(17 \leqslant\) flow along HT \(\leqslant 20\) (corrected from the printed mark scheme, which gives the upper bound for GT as 4)
Identifies both ‘min flow = 32’ AND ‘max flow = 34’
Note: Only need consider arcs incident to S for the second bullet point above, or arcs incident to T for the third bullet point. Flows along other arcs may be incorrect or missing.
1A1: CAO for consistent flow of 32. One number per arc. Check for consistency at each node.
1B1: States that maximum flow must be 34 and makes some reference to (smallest cut in) part a).
1B1: CAO for consistent flow of 34. One number per arc. Check for consistency at each node.
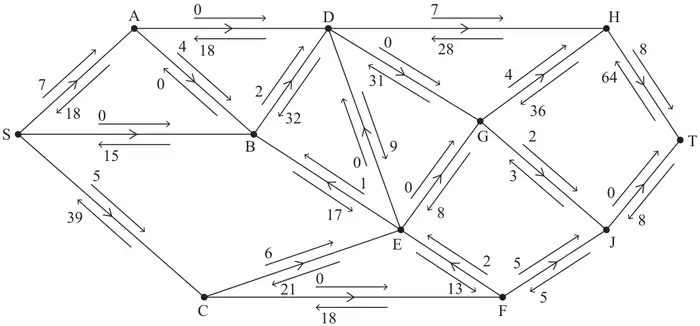
Alexa is monitoring a system of pipes through which fluid can flow from the source, S, to the sink, T. Currently, fluid is flowing through the system from S to T.
Alexa initialises the labelling procedure for this system, and the excess capacities and potential backflows are shown on the arrows either side of each arc, as shown in Figure 1.
(a) State the value of the initial flow. (1)
(b) Explain why arcs DF and DG can never both be full to capacity. (1)
(c) Obtain the capacity of the cut that passes through the arcs AC, AD, BD, DE, EG and EJ. (1)
(d) Use the labelling procedure to find a maximum flow through the network. You must list each flow-augmenting route you use, together with its flow. (3)
(e) Use your answers to part (d) to find a maximum flow pattern for this system of pipes and draw it on Diagram 1 in the answer book. (1)
Diagram 1
(f) Prove that the answer to part (e) is optimal. (3)
Mark scheme (a)
Scheme
Marks
AO
45
B1
1.1b
(1)
Notes
B1: CAO (45)
Mark scheme (b)
Scheme
Marks
AO
e.g. the total capacity of arcs DF and DG is 5 + 11 = 16. The capacity of the two arcs leading into D are 10 (from AD) and 4 (from BD) giving a total capacity into D of 14. As 14 < 16 arcs DF and DG cannot both be full to capacity
B1
2.4
(1)
Notes
B1: CAO (as a minimum accept mention that the max flow into D is 14 and max flow out of D is 16 together with comparison of these two values – (node) D must be mentioned)
B1: CAO – condone more than one value on an arc only if one of these values is circled – mark those that have been circled only
Mark scheme (f)
Scheme
Marks
AO
Use of max-flow min-cut theorem Identification of cut through CH, CF, AD, BD, DE, EG and EJ Value of flow = 53 Therefore by the max-flow min-cut theorem it follows that flow is maximal
M1
A1 A1
2.1
3.1a 2.2a
(3)
(10 marks)
Notes
M1: Construct the start of an argument based on the max-flow min-cut theorem (that is an attempt to find a genuine cut together with the value of either their cut or flow (but not re-iterating the cut given in (c) – AC, AD, BD, DE, EG, EJ))
A1: Use appropriate process of finding a minimum cut – must see correct cut + value correct (accept ‘53’ and the cut either stated or drawn on either diagram)
A1: Correct deduction that the flow is maximal by stating ‘maximum flow (equal to) minimum cut’ – dependent on previous A mark and the correct flow in (e)
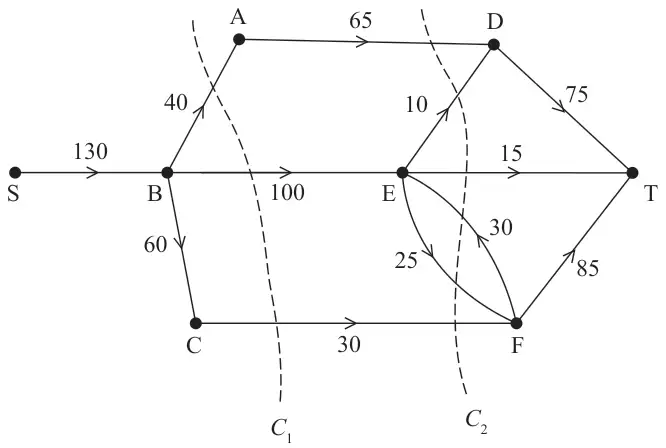
Figure 1 models the flow of fluid through a system of pipes from a source, S, to a sink, T. The weights on the arcs show the capacities of the corresponding pipes in litres per minute. Two cuts \(C_1\) and \(C_2\) are shown.
(a) Find the capacity of
(i) cut \(C_1\)
(ii) cut \(C_2\) (2)
(b) Using only the capacities of cuts \(C_1\) and \(C_2\) state what can be deduced about the maximum possible flow through the system. (1)
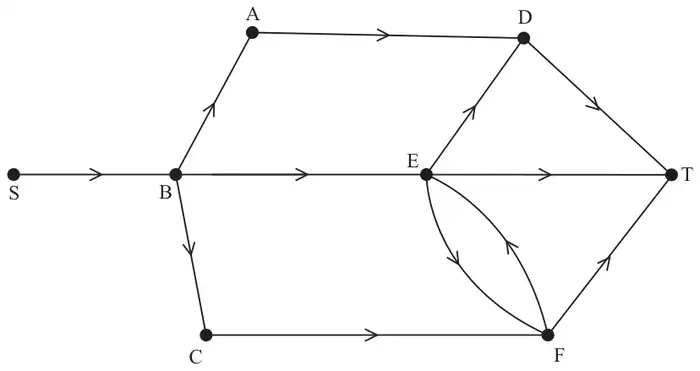
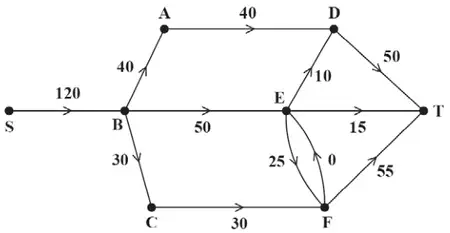
(c) On Diagram 1 in the answer book, show how a flow of 120 litres per minute from S to T can be achieved. You do not need to apply the labelling procedure to find this flow. (2)
Diagram 1
(d) Prove that 120 litres per minute is the maximum possible flow through the system. (2)
A new pipe is planned from S to A. Let the capacity of this pipe be \(x\) litres per minute.
(e) Find, in terms of \(x\) where necessary, the maximum possible flow through the new system. (3)
Mark scheme (a)
Scheme
Marks
AO
(i) 170 (ii) 145
B1 B1
1.1b 1.1b
(2)
Notes
(i) B1: cao
(ii) B1: cao
Mark scheme (b)
Scheme
Marks
AO
Deduces the maximum possible flow is \(\leqslant 145\) litres per minute
B1ft
2.2a
(1)
Notes
B1ft: deduced from their least value given in (a) - must include ‘less than or equal to’
Mark scheme (c)
Scheme
Marks
AO
M1 A1
2.2a 1.1b
(2)
Notes
M1: deduces that the flow out of SB must equal 120 and that the ‘flow in = flow out’ at all but one node – one number only required on each arc (condone blank for arc FE)
A1: a correct valid flow through the network (check that flow in must equal flow out at each vertex)
Mark scheme (d)
Scheme
Marks
AO
Cut through arcs BA, ED, ET, EF (twice), CF
B1
3.1a
Maximum flow = minimum cut Flow = 120, Cut = 120 therefore flow of 120 is optimal
B1
2.1
(2)
Notes
B1: finds a correct cut through saturated arcs directed from S to T
B1: correct mathematical argument that the maximum flow is 120 - dependent on correct cut and correct flow in (c) – must state ‘maximum flow = minimum cut’
Mark scheme (e)
Scheme
Marks
AO
\(0 \lt x \leqslant 25, \qquad\) flow is \(120 + x\) \(x \gt 25, \qquad\qquad\ \ \) flow is \(145\)
M1 A1 A1
3.1a 2.2a 2.3
(3)
(10 marks)
Notes
M1: understanding that the flow through the system will be different depending on the possible values of \(x\) (this could be shown by either of the flows being stated correctly or by consideration of the critical value of \(x = 25\))
A1: correct deduction of both possible flows: \(120 + x\) and 145
A1: correct argument (in terms of the correct inequalities) for when the flow is valid for \(120 + x\) and 145
SC in (e) – award M1A1 for one correct flow and interval