
A2 June 2019 Q6
6.
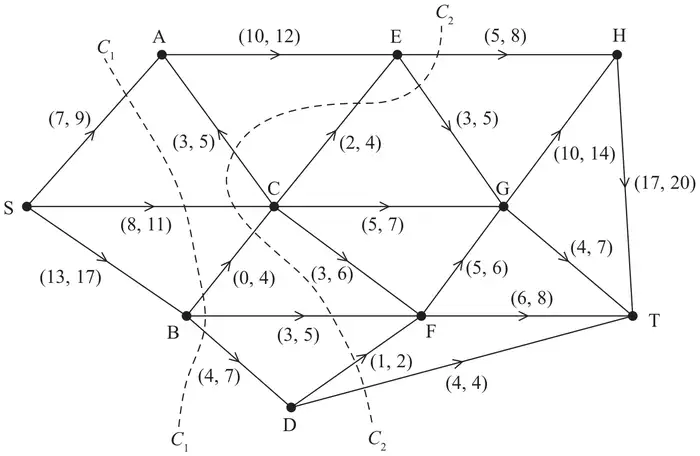
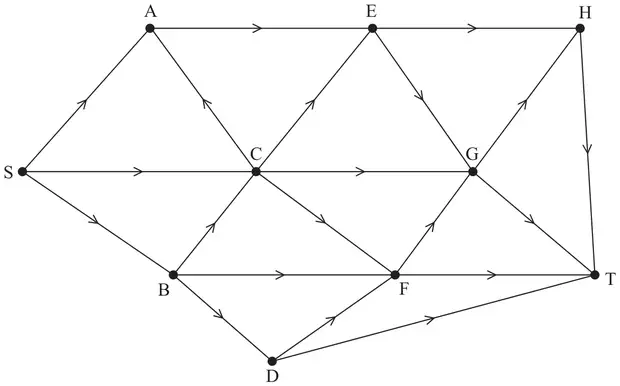
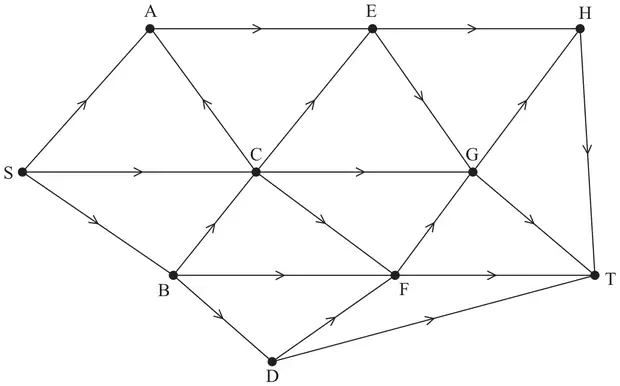
Figure 2 shows a capacitated, directed network. The network represents a system of pipes through which fluid flows from a source, S, to a sink, T.
The numbers \((l, u)\) on each arc represent, in litres per second, the lower capacity, \(l\), and the upper capacity, \(u\), of the corresponding pipe.
Two cuts \(C_1\) and \(C_2\) are shown.
| Scheme | Marks | AO |
|---|---|---|
| (i) \(C_1 = 9 + 11 + 4 + 5 + 7 = 36\) | 1B1 | 1.1b |
| (ii) \(C_2 = 8 + 5 - 2 - 3 + 11 + 4 + 5 + 2 + 4 = 34\) | 2B1 | 1.1b |
| (2) |
Notes
(a)(i) 1B1: CAO
(ii) 1B1: CAO
| Scheme | Marks | AO |
|---|---|---|
| If AE and CE were both full to capacity then \(12 + 4 = 16\) litres per second would flow though E but the maximum capacity of the two arcs out of E (EH and EG) is only \(8 + 5 = 13\) so AE and CE cannot both be full to capacity | 1B1 | 2.4 |
| (1) |
Notes
1B1: Calculates maximum capacity entering E and compares with maximum capacity leaving E. Concludes that maximum capacity into E exceeds maximum capacity out of E.
Condone statements such as ‘flow into E \(= 12 + 4 < 13\) which is the flow out of E’.
| Scheme | Marks | AO |
|---|---|---|
| The minimum flow through the arcs AE, CE, CG, FG, FT and DT (which provides a cut for the network) is \(10 + 2 + 5 + 5 + 6 + 4 = 32\) so a minimum of 32 must be flowing through the system so 31 is not possible. | 1B1 | 2.4 |
| (1) |
Notes
1B1: valid reason why the flow in the network cannot be 31 litres per second.
Note: If smallest of \(C_1\) and \(C_2\) in a) is less than 31 then DO NOT allow this mark for deducing that ‘31 > {smallest of answers from a} hence, flow of 31 is not possible’.
| Scheme | Marks | AO |
|---|---|---|
| Attempt to find a flow of 32 using the answer to (c) | 1M1 | 3.4 |
E.g. Minimum flow of 32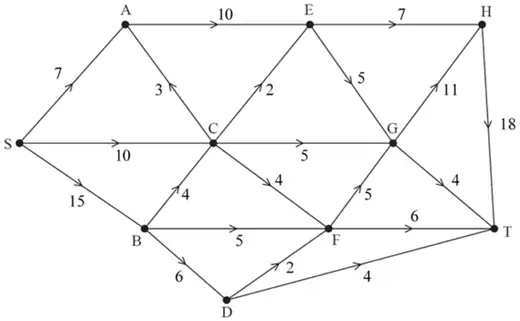 | 1A1 | 1.1b |
| Attempt to augment minimum flow and recognise that from (a) the maximum flow is less than or equal to 34 | 1B1 | 2.1 |
E.g. Maximum flow of 34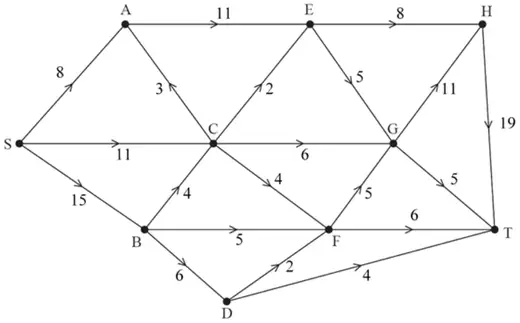 | 2B1 | 1.1b |
| (4) | ||
| (8 marks) |
Notes
1M1: Award this mark for either:
- Indicates ‘minimum flow > 31 so minimum flow could be 32’, OR
- Attempts to find flow of 32 in which: the sum of flows along arcs from S is 32 and \(7 \leqslant\) flow along SA \(\leqslant 9\), \(8 \leqslant\) flow along SC \(\leqslant 11\) and \(13 \leqslant\) flow along SB \(\leqslant 17\), OR
- Attempts to find flow of 32 in which: the sum of flows along arcs into T is 32 and flow along DT = 4, \(6 \leqslant\) flow along FT \(\leqslant 8\), \(4 \leqslant\) flow along GT \(\leqslant 7\) and \(17 \leqslant\) flow along HT \(\leqslant 20\) (corrected from the printed mark scheme, which gives the upper bound for GT as 4)
- Identifies both ‘min flow = 32’ AND ‘max flow = 34’
Note: Only need consider arcs incident to S for the second bullet point above, or arcs incident to T for the third bullet point. Flows along other arcs may be incorrect or missing.
1A1: CAO for consistent flow of 32. One number per arc. Check for consistency at each node.
1B1: States that maximum flow must be 34 and makes some reference to (smallest cut in) part a).
1B1: CAO for consistent flow of 34. One number per arc. Check for consistency at each node.