
Numeracy Intermediate June 2025 Unit 1 Q3
3. Ralph and Dewi completed surveys with different groups of people.
They asked people to describe where they live.
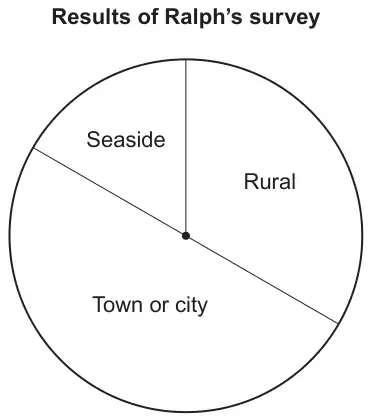
Ralph’s results are shown on the accurately-drawn pie chart below.
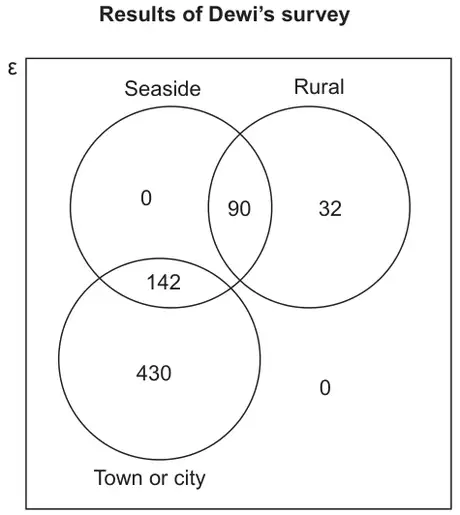
The Venn diagram below shows the results of Dewi’s survey.
(a) In Ralph’s survey, 480 people answered ‘Town or city’.
Calculate the number of people who answered ‘Seaside’ in Ralph’s survey. [3]
Calculate the number of people who answered ‘Seaside’ in Ralph’s survey. [3]
(b)
(i) In Dewi’s survey, how many people live by the seaside in a town or city?
Circle your answer. [1]
Circle your answer. [1]
430 122 572 662 142
(ii) Calculate how many people in Dewi’s survey did not live by the seaside.
Circle your answer. [1]
Circle your answer. [1]
462 694 552 604 430
| Scheme | Marks | Comments |
|---|---|---|
| Angle required 60(°) ± 2(°) or Seaside is 16.6(6…)% or 16.7% | B1 | Check diagram (allow sight of 60 in Seaside) Do not allow 60 people, unless used as 60° in further working May be implied by one of the following:
|
| \(\dfrac{60}{360}\) × 480 × 2 or \(\dfrac{60}{180}\) × 480 or 480 ÷ 3 or 60 × 480 × 2 ÷ 360 or 60 × 480 ÷ 180 or equivalent | M1 | Implies previous B1 FT 45(°) < ‘their 60(°)’ provided < 90(°) or 12.5% < ‘their 16.6(6..)% provided < 25% |
| 160 (people) | A1 | Only FT to accept answers in the range 154 to 166 (people) and must be a whole number of people |
| Scheme | Marks | Comments |
|---|---|---|
| (i) 142 | B1 | |
| (ii) 462 | B1 |