18 Magda carried out a survey to find out the drinks that people like.
She asked 100 people if they like coffee (\(C\)) or tea (\(T\)) or hot chocolate (\(H\)).
32 people like all three drinks. 15 people like coffee and hot chocolate but not tea. 43 people like coffee and tea. 39 people like tea and hot chocolate. 67 people like coffee. 58 people like hot chocolate. 5 people like only tea.
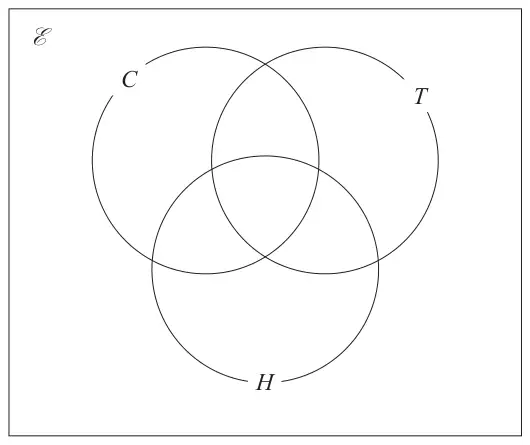
(a) Complete the Venn diagram for this information.(4)
One of the people is chosen at random.
Given that this person likes coffee,
(b) find the probability that this person also likes hot chocolate. (2)
Mark scheme (a)
Answer
Mark
Mark scheme
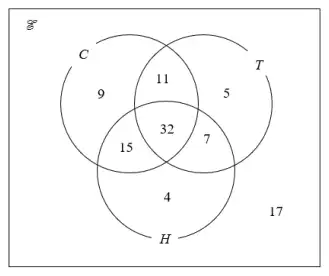
Venn diagram
C4
fully correct Venn diagram
(C3
6 or 7 of the 8 regions correct)
(C2
4 or 5 of the 8 regions correct)
(C1
2 or 3 of the 8 regions correct)
Additional guidance
Ignore all entries except the region you are marking for each C mark
Repeated digits in the diagram should be counted as 2 elements
Mark scheme (b)
Answer
Mark
Mark scheme
\(\dfrac{47}{67}\)
M1
for \(\dfrac{47}{b}\) where \(b \gt 47\) or ft \(\dfrac{\text{``}47\text{''}}{b}\) where \(b \gt \text{``}47\text{''}\)
or \(\dfrac{a}{67}\) where \(0 \lt a \lt 67\) or ft \(\dfrac{a}{\text{``}67\text{''}}\) where \(0 \lt a \lt \text{``}67\text{''}\)
A1
for \(\dfrac{47}{67}\) oe or ft \(\dfrac{\text{``}47\text{''}}{\text{``}67\text{''}}\) oe
Additional guidance
Need not be written in correct form at this stage eg could be a ratio 47 : 67 \(\text{``}47\text{''} = \text{``}15\text{''} + \text{``}32\text{''}\) \(\text{``}67\text{''} = \text{``}9\text{''} + \text{``}11\text{''} + \text{``}32\text{''} + \text{``}15\text{''}\)
Accept any equivalent fraction, decimal form 0.70(14..) or percentage form 70(.14…)%
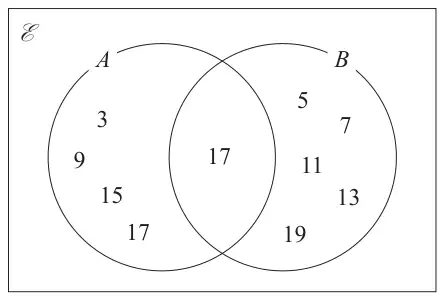
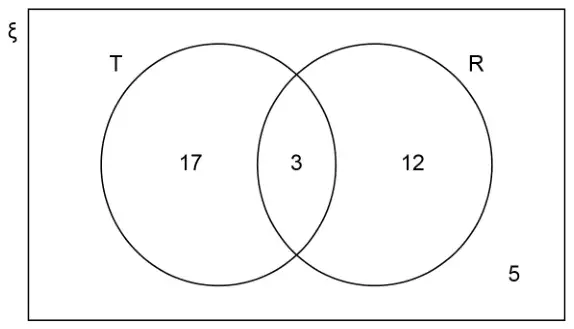
Tom was asked to draw a Venn diagram for this information. Here is his answer.
Write down two things Tom should do to make his answer fully correct. (2)
Mark scheme
Answer
Mark
Mark scheme
statements
C1
for identifying that the number 17 should only be in the intersection
Acceptable examples 17 should only be in the middle Take 17 out of (set) \(A\) only appropriate 17 crossed out on the Venn diagram
Not acceptable examples Tom should put 17 in \(B\) Should have two 17’s in the middle Take 17 out of (set) \(A\) Needs to remove a 17 17 is on twice
C1
for identifying that the number 1 is missing from the diagram
Acceptable examples 1 should be in the outside region He should put 1 outside the circles Tom needs to put the number 1 on the diagram include 1 (outside \(A \cup B\)) 1 added to the diagram in the correct region
Not acceptable examples Add the remaining numbers There are missing odd numbers between 0 and 20 put all the odd numbers outside the circles add the odd numbers in the \(\mathscr{E}\) box include the even numbers 1 should be outside the Venn diagram
Additional guidance
Accept correct descriptions using correct set notation for both marks Diagram may be used to support statements
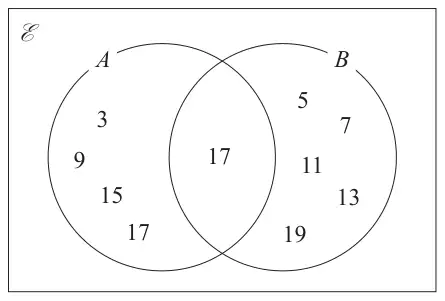
Tom was asked to draw a Venn diagram for this information. Here is his answer.
Write down two things Tom should do to make his answer fully correct. (2)
Mark scheme
Answer
Mark
Mark scheme
statements
C1
for identifying that the number 17 should only be in the intersection
Acceptable examples 17 should only be in the middle Take 17 out of (set) \(A\) only appropriate 17 crossed out on the Venn diagram
Not acceptable examples Tom should put 17 in \(B\) Should have two 17’s in the middle Take 17 out of (set) \(A\) Needs to remove a 17 17 is on twice
C1
for identifying that the number 1 is missing from the diagram
Acceptable examples 1 should be in the outside region He should put 1 outside the circles Tom needs to put the number 1 on the diagram include 1 (outside \(A \cup B\)) 1 added to the diagram in the correct region
Not acceptable examples Add the remaining numbers There are missing odd numbers between 0 and 20 put all the odd numbers outside the circles add the odd numbers in the \(\mathscr{E}\) box include the even numbers 1 should be outside the Venn diagram
Additional guidance
Accept correct descriptions using correct set notation for both marks Diagram may be used to support statements