
Intermediate November 2024 Unit 1 Q12
12. The pie charts show the distributions of Year 7, Year 8 and Year 9 pupils in two schools, Ysgol Afon and Ysgol Twyn.
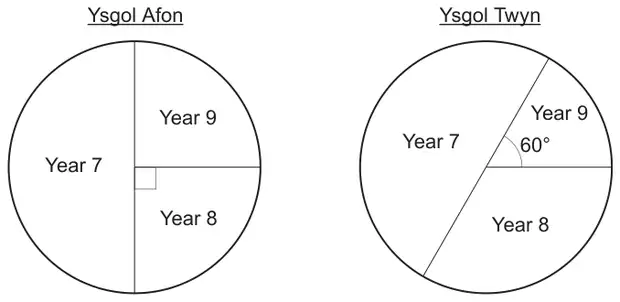
There are 254 Year 7 pupils in Ysgol Afon.
The total number of pupils in Year 7, Year 8 and Year 9 in Ysgol Twyn is 480.
One pupil is chosen at random from all the Year 7, Year 8 and Year 9 pupils in these two schools.
What is the probability that this pupil is in Year 9? [5]
| Scheme | Marks | Comments |
|---|---|---|
| (Number of Year 9 pupils in Ysgol Afon = ) 127 | B1 | Answers may be seen on diagram Do not award B1 if 127 is clearly labelled as Year 7 Ysgol Afon. |
| (Number of Year 9 pupils in Ysgol Twyn = ) \(\frac{60}{360} \times 480\) or equivalent (e.g 480 ÷ 2 ÷ 3, 240 ÷ 3…) | M1 | May be seen in stages. |
| 80 | A1 | An answer of 80 implies M1A1. |
| (Total number of pupils = 508 + 480 =) 988 or (Total number of pupils = 494 + 287 + 207 =) 988 | B1 | CAO. |
| (Probability from Year 9 =) \(\dfrac{207}{988}\) ISW | B1 | Sight of 207 implies the first B1 M1 A1. The numerator and denominator must both be integers for B1. FT \(\dfrac{\text{‘their 127’ + ‘their 80’}}{\text{’their 988’}}\), provided
If no marks awarded, SC1 for engaging with the total number of pupils in Ysgol Afon. This could be sight of 508 or 254 + 254 or equivalent (seen or implied). |