
June 2020 Paper 1 Q8
8 Mike, an amateur astronomer who lives in the South of England, wants to know how the number of hours of darkness changes through the year.
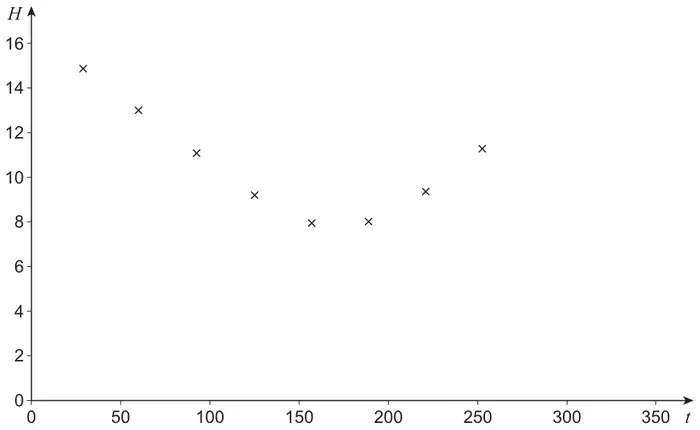
On various days between February and September he records the length of time, \(H\) hours, of darkness along with \(t\), the number of days after 1 January.
His results are shown in Figure 1 below.
Mike models this data using the equation
\[H = 3.87 \sin\left(\frac{2\pi(t + 101.75)}{365}\right) + 11.7\]Her results are shown in Figure 2 below.
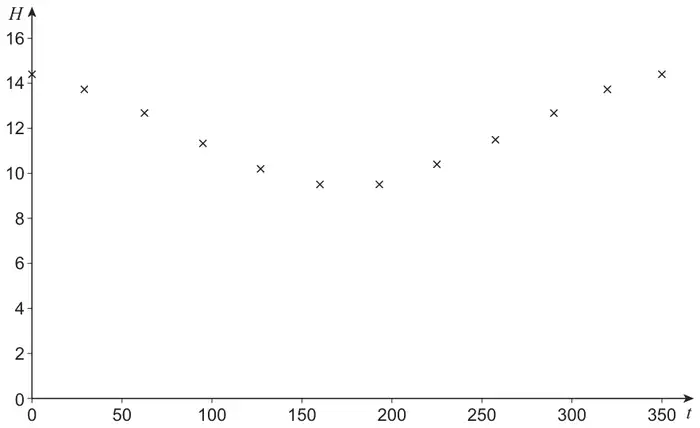
Sofia attempts to model her data by refining Mike’s model.
She decides to increase the 3.87 value, leaving everything else unchanged.
Explain whether Sofia’s refinement is appropriate. [2 marks]
| Scheme | Marks | AO |
|---|---|---|
| Uses \(\sin = -1\) in the model to obtain \(-3.87 + 11.7\) If a \(t\) value is used then the sine must evaluate to \(-1\) or Differentiates, sets the derivative equal to 0 and obtains a value for \(t\) which they substitute back into the formula | M1 | 3.4 |
| Obtains correct answer Accept 470 minutes, \(\frac{47}{6}\) or \(7\frac{5}{6}\) hours | A1 | 3.2a |
| (2) |
Typical solution
\[\sin\left(\frac{2\pi(t + 101.75)}{365}\right) = -1\]\[-3.87 + 11.7 = 7.83\]7 hours 50 mins
| Scheme | Marks | AO |
|---|---|---|
| Uses model to form equation or inequality with \(H = 14\) Condone incorrect inequality | M1 | 3.4 |
| Solves equation to obtain at least two correct values of \(t\) Can be rounded or truncated Eg \(-64.77\), 43.779, 300.22, 408.77 | A1 | 1.1b |
| Subtracts an appropriate pair of \(t\) values to obtain number of consecutive days Condone any rounding to the nearest whole number or truncation of their pair of values Accept 109 or 107 Alternative method = 43 + (365 – 300) = 108 | A1 | 3.2a |
| (3) |
Typical solution
\[3.87\sin\left(\frac{2\pi(t + 101.75)}{365}\right) + 11.7 = 14\]\[t = 300.22 \text{ or } t = 408.77\]\[408 - 300 = 108\]| Scheme | Marks | AO |
|---|---|---|
| Explains that Sofia’s refinement would increase the amplitude of the graph Accept The range of the graph would increase It would increase the fluctuation of the graph | M1 | 3.3 |
| Explains that Sofia’s refinement is not appropriate as her data/graph suggests a lower amplitude OE | A1 | 3.5c |
| (2) | ||
| (7 marks) |
Typical solution
Sofia’s refinement would increase the range of the graph
Sofia’s graph suggests this is not the case, so the refinement is not appropriate