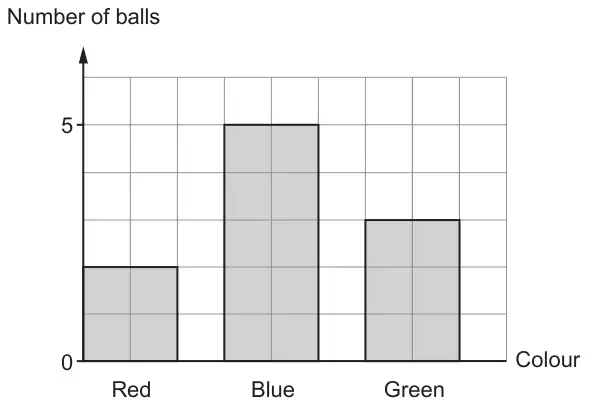
(a) A box contains different-coloured balls. Some are red, some are blue and the others are green.
The bar chart shows how many balls of each colour are in the box.
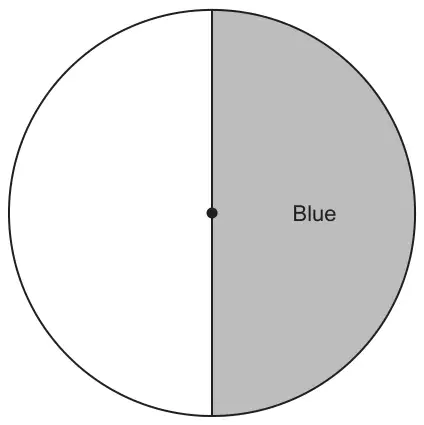
Draw an accurate pie chart to compare the number of coloured balls in the box. Part of the pie chart has been completed for you. [3]
(b) The letters A, B, C and D describe four different events.
Experiment
Event
A fair 6-sided dice is thrown.
A
4 is thrown.
A fair coin is thrown.
B
A tail is thrown.
Four cards labelled North, East, South and West are placed in a box. One card is chosen at random.
C
North is chosen.
Seven cards, each labelled with a different day of the week, are placed in a box. One card is chosen at random.
D
Sunday is chosen.
Using the letters A, B, C and D, list the events in the order of how likely they are to happen. Start with the least likely and end with the most likely. [2]
☐ ☐ ☐ ☐ Least likely ⟶ Most likely
Mark scheme (a)
Scheme
Marks
Comments
Correctly drawn pie chart within tolerance AND correctly labelled
Red = 72(°) (allow 70° to 74°) Green = 108(°) (allow 106° to 110°)
B3
Award B2 for one of the following:
correctly drawn pie chart within tolerance but not labelled or incorrectly labelled
pie chart drawn within tolerance but not a straight line
pie chart drawn not starting from the centre (but with end point within tolerance)
sight of red = 72(°)
sight of green = 108(°).
Award B1 for sight of one of the following:
72(°)
108(°)
(red=) \(\dfrac{2}{10}\) × 360 or equivalent
(red=) \(\dfrac{2}{5}\) × 180 or equivalent
(green=) \(\dfrac{3}{10}\) × 360 or equivalent
(green=) \(\dfrac{3}{5}\) × 180 or equivalent
‘their derived 72’ and ‘their derived 108’ drawn correctly, provided that ‘their 72’ + ‘their 108’ = 180 and identified as red and green, and not 90°.
Mark scheme (b)
Scheme
Marks
Comments
D A C B
B2
Award B2 for writing the correct fractions in order \(\dfrac{1}{7} \quad \dfrac{1}{6} \quad \dfrac{1}{4} \quad \dfrac{1}{2}\)
Award B1 for one of the following:
sight of correct fractions
BCAD (reversed order)
DCB in order
DAC in order
DAB in order
ACB in order
ADCB
BDAC
CDAB
ADCB
DCAB
DBAC
DCAB
ACDB
DCBA
DABC
DABC
ACBD
DCB
DAC
DAB
ACB
Do not accept repeated letters.
Corrected by Westie's Workshop
The board's mark scheme printed “DABC”. Changed to “DAB” because the last row in each column is the three letters alone, and DABC is already shown in the row above.
Original: see the board's mark scheme PDF (link above).
We'd like to use Google Analytics cookies to count visits and see which pages help most. They're optional, and the site works exactly the same either way. Privacy policy