
Numeracy Foundation June 2023 Unit 2 Q8
8. The times it took a group of girls and a group of boys to complete the same puzzle are shown in the frequency diagrams below.
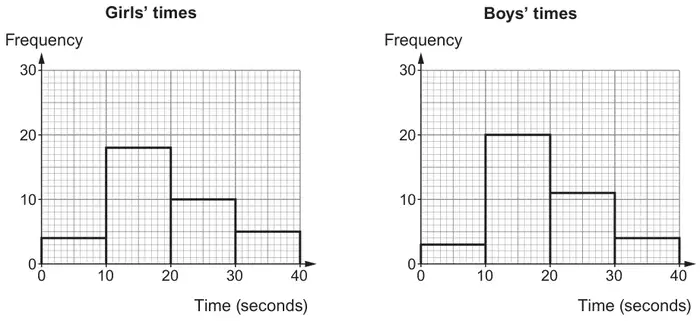
(a)
Anand says,
There are more boys than girls in these groups.
By showing all your working, decide if Anand’s statement is correct or not. [3]
Correct ☐ Incorrect ☐
(b)
What is the difference between the percentage of girls completing the puzzle in less than 10 seconds and the percentage of boys completing the puzzle in less than 10 seconds?
Give your answer correct to one decimal place. [4]
Difference is …………… %, correct to one decimal place
| Scheme | Marks | Comments |
|---|---|---|
| (Girls) 4 + 18 + 10 + 5 AND (Boys) 3 + 20 + 11 + 4 | M2 | For M2 allow an error in 1 of the 8 values M1 for either (Girls) 4 + 18 + 10 + 5 (=37) or (Boys) 3 + 20 + 11 + 4 (=38) |
| ‘Correct’ indicated or implied AND number of girls 37 AND number of boys 38 | A1 | CAO |
| Scheme | Marks | Comments |
|---|---|---|
| FT ‘their first values’ and ‘their ‘totals’ from (a) If their number of girls = their number of boys then FT for possible first M1 A1 only | ||
| (Girls) \(\dfrac{4}{37}\) (× 100) OR (Boys) \(\dfrac{3}{38}\) (× 100) | M1 | Do not accept ‘4 out of 37’ or ‘3 out of 38’ |
| 10.8(….%) or 11(%) AND 7.8(9…%) or 7.9 (%) or 8(%) | A2 | Do not award A2 or A1 from incorrect working seen Allow A2 as implied by a final answer in the range 2.8(%) to 3.2(%) from the sight of the appropriate decimals if individual percentages are not seen A1 for any one of the following:
|
| Difference 2.9(%) | A1 | Only FT from A2 previously awarded Answer space takes precedence Must be given as a percentage to 1 decimal place Do not FT from premature approximation If no marks, from appropriate working award SC1 for working with any one of the following:
OR SC2 for the respective answers:
|