
Higher June 2022 Unit 1 Q3
3. The children in year 5 and year 6 in a primary school took part in a survey.
The children were asked, “How many pets do you have?”
The results are shown in the pie chart and bar chart below.
No child in either year had more than 5 pets.
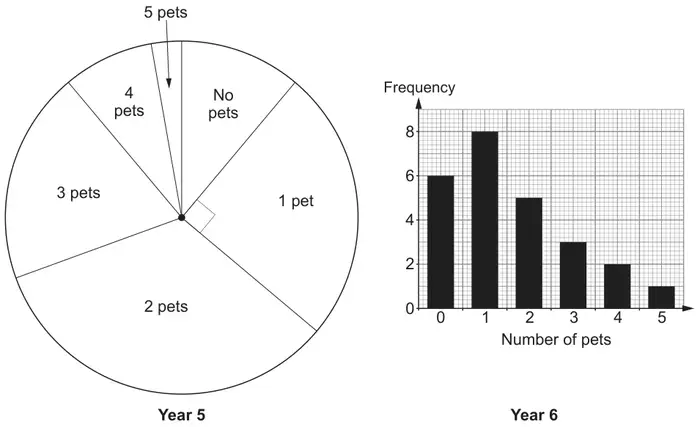
There are 36 children in year 5.
One child is chosen at random from all the children in year 5 and year 6.
What is the probability that this child has no more than 1 pet? [6]
| Scheme | Marks | Comments |
|---|---|---|
| (0 pets angle =) 40(°) ± 2(°) | B1 | Answers may be seen on diagrams |
| (Year 5: 0 pets =) \(\dfrac{40(^\circ) \pm 2(^\circ)}{360}\) × 36 | M1 | Or equivalent FT ‘their 40’ |
| (Year 5: 0 pets =) 4 | A1 | Answer must be whole number and from correct working (e.g. not from 360 ÷ 90) An answer of 4 (may be seen as 4/36) implies B1M1A1, provided not from incorrect working. |
| (Year 5: 1 pet = ) 9 | B1 | May be seen as 9/36 |
| (Probability no more than 1 pet =) \(\dfrac{27}{61}\) or equivalent ISW | B2 | FT \(\dfrac{\text{‘their derived 4’} + \text{‘their derived 9’} + 6 + 8}{61}\) (no more than 1 pet) B1 for a numerator of 27 in a fraction < 1. FT ‘their derived 4’ + ‘their derived 9’ + 6 + 8 accurately evaluated as a numerator in a fraction < 1. B1 for a denominator of 61 in a fraction < 1. Penalise incorrect notation −1. e.g. ‘27 in 61’. If no marks awarded, award SC1 for sight of a correct 61. Special cases: If only 1 pet considered from Year 5 AND Year 6, an answer of \(\dfrac{17}{61}\) would gain B0 or B1 M0A0B1B2 FT \(\dfrac{\text{‘their derived 9’} + 8}{61}\) for B0 or B1 M0A0B0B2 Last B1 for a numerator of 17 in a fraction < 1. FT ‘their derived 9’ + 8 accurately evaluated as a numerator in a fraction < 1. Last B1 for a denominator of 61 in a fraction < 1. Penalise incorrect notation −1. e.g. ‘17 in 61’. If only 0 pets considered from Year 5 AND Year 6, an answer of \(\dfrac{10}{61}\) would gain B1M1A1B0B2 FT \(\dfrac{\text{‘their derived 4’} + 6}{61}\) for B1M1A0B0B2 Last B1 for a numerator of 10 in a fraction < 1. FT ‘their derived 4’ + 6 accurately evaluated as a numerator in a fraction < 1. Last B1 for a denominator of 61 in a fraction < 1. Penalise incorrect notation −1. e.g. ‘10 in 61’. |
Alternative method 1
| Scheme | Marks | Comments |
|---|---|---|
| (0 + 1 pet angle =) 130(°) ± 2(°) | B1 | Answers may be seen on diagrams |
| (Year 5: 0 + 1 pet =) \(\dfrac{130(^\circ) \pm 2(^\circ)}{360}\) × 36 | M1 | Or equivalent FT ‘their 130’ |
| (Year 5: 0 + 1 pet =) 13 | A2 | May be seen as 13/36 Award A1 for an answer not rounded. |
| (Probability no more than 1 pet =) \(\dfrac{27}{61}\) or equivalent ISW | B2 | FT \(\dfrac{(\text{‘their derived 13’} + 6 + 8)}{61}\) B1 for a numerator of 27 in a fraction < 1. FT ‘their derived 13’ + 6 + 8 accurately evaluated as a numerator in a fraction < 1. B1 for a denominator of 61 in a fraction < 1. Penalise incorrect notation −1. e.g. ‘27 in 61’. If no marks awarded for the whole question, award SC1 for sight of a correct 61. |
Alternative method 2
| Scheme | Marks | Comments |
|---|---|---|
| (Each child is represented by \(\dfrac{360(^\circ)}{36}\) = ) 10(°) | B1 | Answers may be seen on diagrams |
| (Year 5: 0 pets angle = 40(°) ± 2(°) | B1 | |
| (Year 5: 0 pets = \(\dfrac{40(^\circ) \pm 2(^\circ)}{10(^\circ)}\) = ) 4 | B1 | FT ‘their 40’ Answer must be whole number and from correct working (e.g. not from 360 ÷ 90) An answer of 4 (may be seen as 4/36) implies B1B1B1, provided not from incorrect working. |
| (Year 5: 1 pet = ) 9 | B1 | May be seen as 9/36 |
| (Probability no more than 1 pet =) \(\dfrac{27}{61}\) or equivalent ISW | B2 | FT \(\dfrac{(\text{‘their derived 4’} + \text{‘their derived 9’} + 6 + 8)}{61}\) B1 for a numerator of 27 in a fraction < 1. FT ‘their derived 4’ + ‘their derived 9’ + 6 + 8 accurately evaluated as a numerator in a fraction < 1 B1 for a denominator of 61 in a fraction < 1. Penalise incorrect notation −1. e.g. ‘27 in 61’. If no marks awarded, award SC1 for sight of a correct 61. Special cases: If only 1 pet considered from Year 5 AND Year 6, an answer of \(\dfrac{17}{61}\) would gain B0 or B1 M0A0B1B2 FT \(\dfrac{\text{‘their derived 9’} + 8}{61}\) for B0 or B1 M0A0B0B2 Last B1 for a numerator of 17 in a fraction < 1. FT ‘their derived 9’ + 8 accurately evaluated as a numerator in a fraction < 1. Last B1 for a denominator of 61 in a fraction < 1. Penalise incorrect notation −1. e.g. ‘17 in 61’. If only 0 pets considered from Year 5 AND Year 6, an answer of \(\dfrac{10}{61}\) would gain B1M1A1B0B2 FT \(\dfrac{\text{‘their derived 4’} + 6}{61}\) for B1M1A0B0B2 Last B1 for a numerator of 10 in a fraction < 1. FT ‘their derived 4’ + 6 accurately evaluated as a numerator in a fraction < 1. Last B1 for a denominator of 61 in a fraction < 1. Penalise incorrect notation −1. e.g. ‘10 in 61’. |