
Foundation June 2022 Paper 1 Q5
5 This graph shows the number of mobile phones sold by a shop in June, July and August.
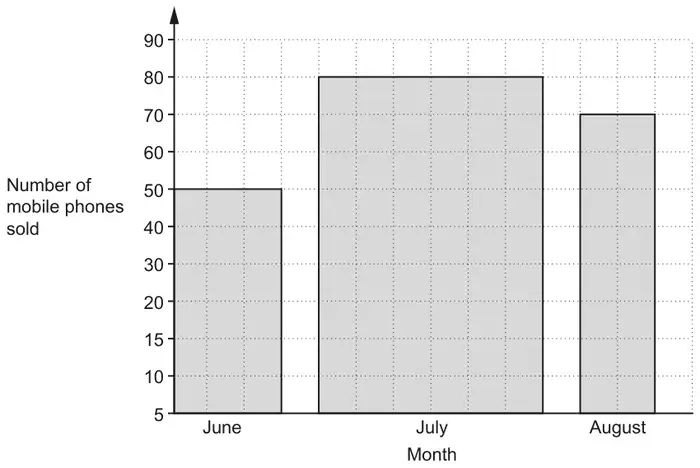
Give two reasons why the graph is misleading. [2]
| Answer | Marks | Part marks and guidance | |
|---|---|---|---|
| 2 correct from e.g. Bars are unequal width Vertical scale is not linear Vertical axis does not start at 0 | 2 | B1 for each | Both marks may be scored in one sentence See Exemplars |
Appendix
Exemplar responses for Q5
| Response | Mark |
|---|---|
| Bars are not the same thickness/width | 1 |
| It has to be 3 or 6 lines wide not both | 1 |
| June and August have 3 boxes /squares, July has 6 (implies width) | 1 |
| July is wider | 1 |
| Scale should start at 0 not 5 | 1 |
| Scale is not linear | 1 |
| Difference in frequency is not equal/ consistent | 1 |
| Scale goes up in 5s then in 10s | 1 |
| Scale is inconsistent | 1 |
| Bars are different lengths without reference to numbers or x axis | 0 |
| Bars are different sizes (no reference to width) | 0 |
| July is not the same as the others (no reference to width or equivalent) | 0 |
| July is taking 6 columns (no reference to others) | 0 |
| July has more boxes/ squares (no reference to width) | 0 |
| Frequency axis is labelled wrong | 0 |
| Its not spread evenly (what isn’t) | 0 |