
Foundation November 2021 Paper 3 Q1
1 In a survey, some students chose their favourite type of film from a list of five.
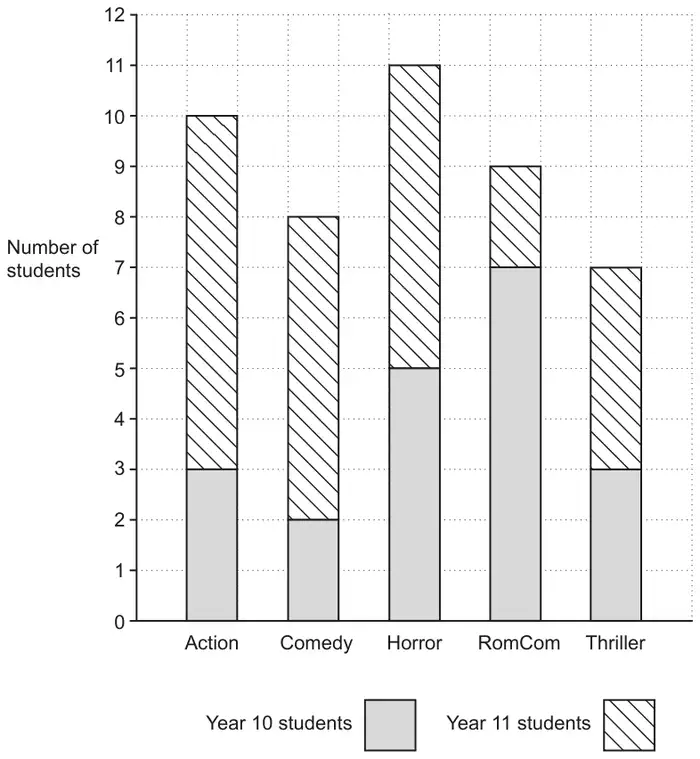
The bar chart shows the results.
(a)
(i) How many students chose Action films? [1]
(ii) How many Year 11 students chose Action films? [1]
(b) What type of film was chosen by the most Year 10 students? [1]
(c) How many Year 10 students took part in the survey? [2]
(d) 45 students took part in the survey.
Write the ratio
number of Year 10 students taking part : number of Year 11 students taking part
in its simplest form. [3]
| Answer | Marks | Part marks and guidance | |
|---|---|---|---|
| (i) 10 | 1 | ||
| (ii) 7 | 1 | ||
| Answer | Marks | Part marks and guidance | |
|---|---|---|---|
| RomCom | 1 | ||
| Answer | Marks | Part marks and guidance | |
|---|---|---|---|
| 20 | 2 | M1 for 3 [+] 2 [+] 5 [+] 7 [+] 3 seen | May be on graph |
| Answer | Marks | Part marks and guidance | |
|---|---|---|---|
| \(4 : 5\) | 3 | B1 for 25 or (45 − their 20) M1 for their 20 : their 25 OR M2 for \(\dfrac{4}{9} : \dfrac{5}{9}\) seen or M1 for \(\dfrac{20}{45} : \dfrac{25}{45}\) oe seen If 0 scored, SC1 for answer 5 : 4 | Their Yr 10 from (c) Their 25 is any value from 12 to 44 May be on answer line For M1 ratio must be seen and not implied from a “simplified” version 20 : 25 implies B1 M1 25 : 20 implies B1 oe 0.444[…] : (0.555 to 0.556) |