
Foundation November 2020 Paper 2 Q7
7 This is Nadia’s bar chart to show the number of goals scored by four teams during November.
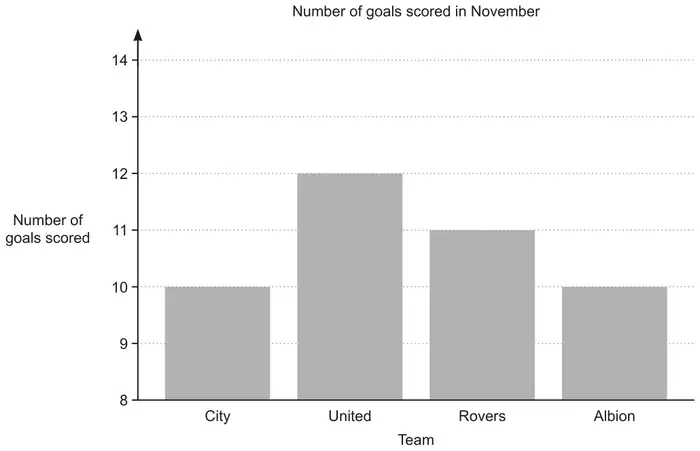
(a) Blake says
Nadia’s bar chart shows that United scored twice as many goals as City.
Is Blake correct?
Give a reason for your answer.
.................. because .................. [1]
(b) Give one way in which Nadia can improve her bar chart. [1]
(c) Kareem says
Out of these four teams, United achieved the highest mean number of goals per game during November.
What assumption has Kareem made? [1]
| Answer | Marks | Part marks and guidance | |
|---|---|---|---|
| No and statement referencing 10 and 12 oe | 1 | Referencing 10 and 12 could be implied by eg United only scored 2 more oe United’s bar would be a height of 20 oe Do not accept ‘scale should go up in 2s’ See AG | |
Exemplar responses
Exemplar responses for Q7a
| Response | Mark |
|---|---|
| No, City scored 10 goals and United scored 12 so therefore they only scored 2 more. | 1 |
| No, they only scored two more than them | 1 |
| No, they only scored 2 more goals than City not twice as many, that would be 20. | 1 |
| No, they only scored two more not two times more. | 1 |
| No, United scored 12 goals and half of 12 is 6. | 1 |
| No, twice the number city scored is 20 and united only scored 12 | 1 |
| No because he hasn’t double city to give 20 and united is less than that | 1 |
| No, United have only scored two more goals than City. This is because the number have massive gaps between them. | 1 BOD |
| NO – twice as many means times 2. (This is not enough, if they also stated “not +2” then they would get the mark) | 0 |
| Yes, City is 10 goals of scores and united 12 goals of scores | 0 |
| Answer | Marks | Part marks and guidance | |
|---|---|---|---|
| Start the vertical scale from 0 oe | 1 | Accept other values <8, or suggestion of inserting zig-zag on ‘goals’ axis line See AG | |
Exemplar responses
Exemplar responses for Q7b
| Response | Mark |
|---|---|
| She should start the graph from zero so that she can show the point clearly | 1 |
| Start number of goals from 1 (Accept other values <8) | 1 |
| Put a zero in the corner instead of an 8 | 1 |
| She could start from 1 and go up in 2’s to stop at 13 | 1 |
| The numbers because she started it at 8 not 0. (BOD ‘The numbers to imply vertical scale) | 1 |
| Start from 0 not 9 | 0 |
| She should go up in two’s instead | 0 |
| Make the spaces of ‘number of goals scored’ smaller so it isn’t misleading to read. | 0 |
| Go up a different sequence for the number of goals scored | 0 |
| Answer | Marks | Part marks and guidance | |
|---|---|---|---|
| All teams played the same number of games oe | 1 | United may have played less games | |