
Foundation June 2022 Paper 2 Q6
6 Taylor has collected data on the number of students who were absent from their school last week.
The bar chart shows the results for the first four days.
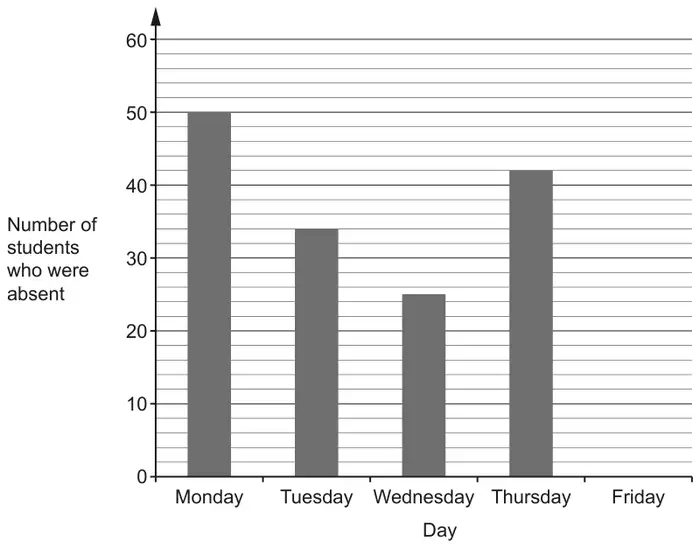
(a) On Friday there were 54 students who were absent from the school.
Show this information on the bar chart. [1]
(b) Taylor says
On Monday 150% of the students were absent from my school.
Could this be true?
Explain how you decide. [1]
(c) There are 600 students in Taylor’s school.
Find the percentage of students who were absent from Taylor’s school on Thursday. [3]
Find the percentage of students who were absent from Taylor’s school on Thursday. [3]
| Answer | Marks | Part marks and guidance | |
|---|---|---|---|
| Correct bar at 54 | 1 | Accept clear intention but do not accept a vertical line to 54 | |
| Answer | Marks | Part marks and guidance | |
|---|---|---|---|
| No, not true with valid supporting reason | 1 | e.g. 100% being the same as all students absent oe e.g. percentage cannot be greater than 100% in this context oe If values are used, they must be correct Any incorrect statement invalidates the mark See Appendix | |
Appendix
Exemplar responses for Question 6b
| Response | Mark | |
|---|---|---|
| 1 | No because 100% means everyone | 1 |
| 2 | No that would be all of the students and more (this would also score if they hadn’t stated ‘and more’) | 1 |
| 3 | No There can only be 100% of the students | 1 |
| 4 | No it is over 100% meaning all of them would be absent | 1 |
| 5 | No 150% means all students would be absent (we can condone use of 150% as ‘all would be absent’) | 1 |
| 6 | This could not be true as not everyone was absent (could not be true is fine to imply ‘no’) | 1 |
| 7 | This could not be true as 150% is 1.5 times more students which is impossible (BOD ‘more’) | BOD 1 |
| 8 | No it cannot because 150% is more than the total which isn’t possible (BOD ‘total’ implies students) | BOD 1 |
| 9 | No, that is more students than there is in the school (BOD a % rather than 150 as there are 600) | BOD 1 |
| 10 | No because how can more than 100% be absent (the word absent is referring to the context) | BOD 1 |
| 11 | No because only 50 students were absent (needs reference to all or less than 100%) | 0 |
| 12 | No because 150% of all students would be 90 and there are only 50 absent (should be 900) | 0 |
| 13 | No because it’s less than the number of people in the school (interpreted as 150 rather than 150%) | 0 |
| 14 | No, 50/600 isn’t 150% (true but doesn’t answer the question with reference to 150% >100%) | 0 |
| 15 | No this could not be true as 100% is all the students. There were 10 students still at school on Monday (The 1st sentence alone would score, but the additional incorrect statement loses the mark) | 0 |
| All of the following score 0 as they do not refer to the context of the question | ||
| 16 | No, it could only be out of 100% | 0 |
| 17 | No because the percent is out of 100 | 0 |
| 18 | No because 150% is impossible | 0 |
| 19 | No because 50 is half of 100 so it wouldn’t be above 150% | 0 |
| 20 | No there should always be 100% | 0 |
| Answer | Marks | Part marks and guidance | |
|---|---|---|---|
| 7 | 3 | M2 for \(\dfrac{42}{600}\) \(\times 100\) oe or M1 for \(\dfrac{42}{600}\) oe or \(\dfrac{n}{600}\) \(\times 100\) oe | e.g. \(42 \div 6\) \(n \lt 60\) |